. 2023 Jul;619(7969):300-304.
doi: 10.1038/s41586-023-06121-5. Epub 2023 Jun 14.

Single-photon absorption and emission from a natural photosynthetic complex

Affiliations

Single-photon absorption and emission from a natural photosynthetic complex

Quanwei Li et al. Nature. 2023 Jul.

Abstract

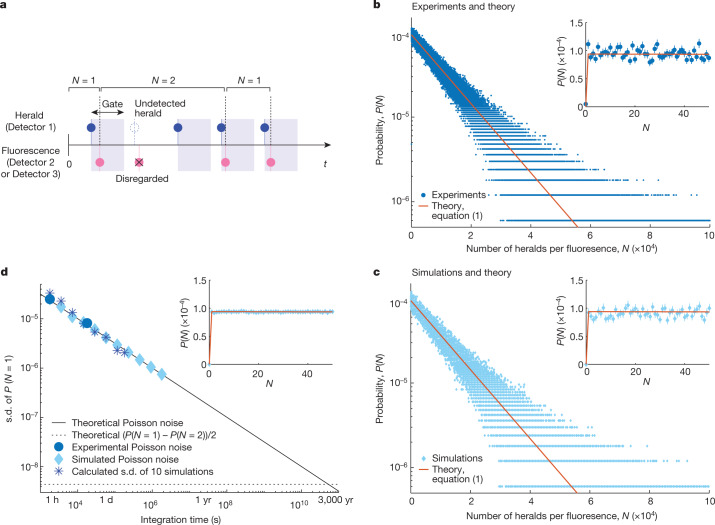
Photosynthesis is generally assumed to be initiated by a single photon1-3 from the Sun, which, as a weak light source, delivers at most a few tens of photons per nanometre squared per second within a chlorophyll absorption band1. Yet much experimental and theoretical work over the past 40 years has explored the events during photosynthesis subsequent to absorption of light from intense, ultrashort laser pulses2-15. Here, we use single photons to excite under ambient conditions the light-harvesting 2 (LH2) complex of the purple bacterium Rhodobacter sphaeroides, comprising B800 and B850 rings that contain 9 and 18 bacteriochlorophyll molecules, respectively. Excitation of the B800 ring leads to electronic energy transfer to the B850 ring in approximately 0.7 ps, followed by rapid B850-to-B850 energy transfer on an approximately 100-fs timescale and light emission at 850-875 nm (refs. 16-19). Using a heralded single-photon source20,21 along with coincidence counting, we establish time correlation functions for B800 excitation and B850 fluorescence emission and demonstrate that both events involve single photons. We also find that the probability distribution of the number of heralds per detected fluorescence photon supports the view that a single photon can upon absorption drive the subsequent energy transfer and fluorescence emission and hence, by extension, the primary charge separation of photosynthesis. An analytical stochastic model and a Monte Carlo numerical model capture the data, further confirming that absorption of single photons is correlated with emission of single photons in a natural light-harvesting complex.


Conflict of interest statement

The authors declare no competing interests.

Figures

Fig. 1
Fig. 1. Principle of the experiments.
a, Simplified schematic of the time-resolved PCQLS for studying single-photon transitions in photosynthetic systems. In the LH2 structure, the B800 ring (containing 9 bacteriochlorophylls) and the B850 ring (containing 18 bacteriochlorophylls) are colour coded as blue and red, respectively, produced from the Protein Data Bank file 1NKZ using ChimeraX. For simplicity, the carotenoids and protein subunits of LH2 are not shown here. The inset is a simplified energy diagram of LH2 showing the whole process from absorption of a single photon by the B800 ring to fluorescence of a single photon by the B850 ring after electronic energy transfer from B800. BBO, barium borate; PPKTP, periodically poled potassium titanyl phosphate; |G>, ground state; |1EM>, one-exciton manifold. b, Schematic of the raw signals showing the relative time delay τ between corresponding pairs of heralds and heralded fluorescent photons. c, Normalized coincidence counts of crosscorrelation between heralds and heralded fluorescent photons plotted as a function of their relative time delay τ with 128-ps bin size. The three sets of coloured dots show the measured data at three different incident photon rates represented by the average photon pair number np generated per pump pulse over a fourfold range (that is, 0.0458 (rate 1, blue), 0.0214 (rate 2, red) and 0.0103 (rate 3, orange), respectively, with 200-s integration time) (Supplementary Tables 2 and 3). The three solid curves are the corresponding single-exponential decay fits reconvoluted with the instrument response function (black dashed line) measured using the crosscorrelation between heralds and incident residue. The inset shows the obtained decay lifetimes, with error bars representing the 95% confidence intervals. Source data
Fig. 2
Fig. 2. Single-photon nature revealed by the second-order coherence function at zero time delay, g(2)(t = 0), conditioned on herald detection.
a, Schematics of the experiments to measure g(2)(t = 0) conditioned on herald detection by standard three-detector measurements. b, Schematics of the raw signal time trace. The gate window is 10 ns for fluorescence photons and 6 ns for incident photons. c, Measured values of g(2)(t = 0) conditioned on herald detection for incident and fluorescent photons. The conditional g(2)(t = 0) value of the heralded fluorescent photons, g(2)(t = 0) = 0.2044 ± 0.0723 (four s.d. below the single-photon threshold of 0.5), was calculated according to the equation g(2)(t = 0) = (NH × NC)/(N2 × N3) (see refs. , for full details) using the following measured counts from a 5-h integration time: herald count NH = 17,773,649,622, gated coincidence count between Detector 2 and Detector 3 NC = 8, gated Detector 2 N2 = 819,108 and gated Detector 3 N3 = 849,299. The conditional g(2)(t = 0) values of heralded incident photons were measured for the same three rates as in Fig. 1c, each with 10-s integration time (Supplementary Information Section V and Supplementary Fig. 4). Error bars represent the s.d. assuming Poisson statistics of the counts. The black dashed line shows the theoretical estimate of g(2)(t = 0) = 2np/(1 + np) for heralded detections derived in Supplementary Information Section V. Source data
Fig. 3
Fig. 3. Probability distribution of the number of heralds per heralded fluorescent photon.
a, Schematic of the raw signal time trace showing how the number of heralds between successive heralded fluorescent detections is counted. b,c, Experimental, theoretical and simulated probability distributions. b, The experimentally measured probability distributions from the same raw data used to extract the conditional g(2)(t = 0) of heralded fluorescent photons in Fig. 2c constructed from a total of 1,668,407 heralded fluorescent detections and a total of 17,773,649,622 herald detections, with 5-h integration time. Note here that the value P(N = 0) ≈ 4.8 × 10−6 is non-zero due to the eight events of two heralded fluorescent photons conditioned on a herald detection that also gave rise to the small non-zero g(2)(t = 0) value of the heralded fluorescence in Fig. 2c. The solid red curves show the prediction of the analytical stochastic model of equation (1) using the measured experimental parameters. c, Simulated probability distributions using a numerical Monte Carlo model (Supplementary Information Section VII) with experimental parameters from b shown together with the theoretical prediction of equation (1). The insets in b and c zoom into the first 50 bins, showing the data points together with error bars representing Poisson s.d. (countsinbinN normalized by the total counts of all bins). d, The s.d. of P(N = 1) as a function of the integration time showing that the Poisson counting noise (defined as countsinbinN=1 normalized by the total counts of all bins) can be reduced by longer integration time and thus, more total events. The inset zooms into a simulated distribution with 1.8 × 106-s integration time (100 times longer than the experimental and simulated data in b and c) and shows much reduced noise (Supplementary Information Fig. 8). Error bars represent Poisson s.d. Source data

References

    1. Blankenship, R. E. Molecular Mechanisms of Photosynthesis 3rd edn (John Wiley & Sons, 2021).
    1. Scholes GD, Fleming GR, Olaya-Castro A, van Grondelle R. Lessons from nature about solar light harvesting. Nat. Chem. 2011;3:763–774. doi: 10.1038/nchem.1145. - DOI - PubMed
    1. Croce, R., van Grondelle, R., van Amerongen, H. & van Stokkum, I. (eds) Light Harvesting in Photosynthesis (CRC Press, 2018).
    1. Savikhin S, Struve WS. Temperature dependence of electronic energy transfers within B850 antennae of the NF57 mutant of the purple bacterium Rhodobacter sphaeroides. Chem. Phys. 1996;210:91–100. doi: 10.1016/0301-0104(96)00122-X. - DOI
    1. van Amerongen, H., van Grondelle, R. & Valkunas, L. Photosynthetic Excitons (World Scientific, 2000).

Publication types

MeSH terms

Substances