. 2023 Jun;618(7966):790-798.
doi: 10.1038/s41586-023-06204-3. Epub 2023 Jun 14.

Psychedelics reopen the social reward learning critical period

Affiliations

Psychedelics reopen the social reward learning critical period

Romain Nardou et al. Nature. 2023 Jun.

Abstract

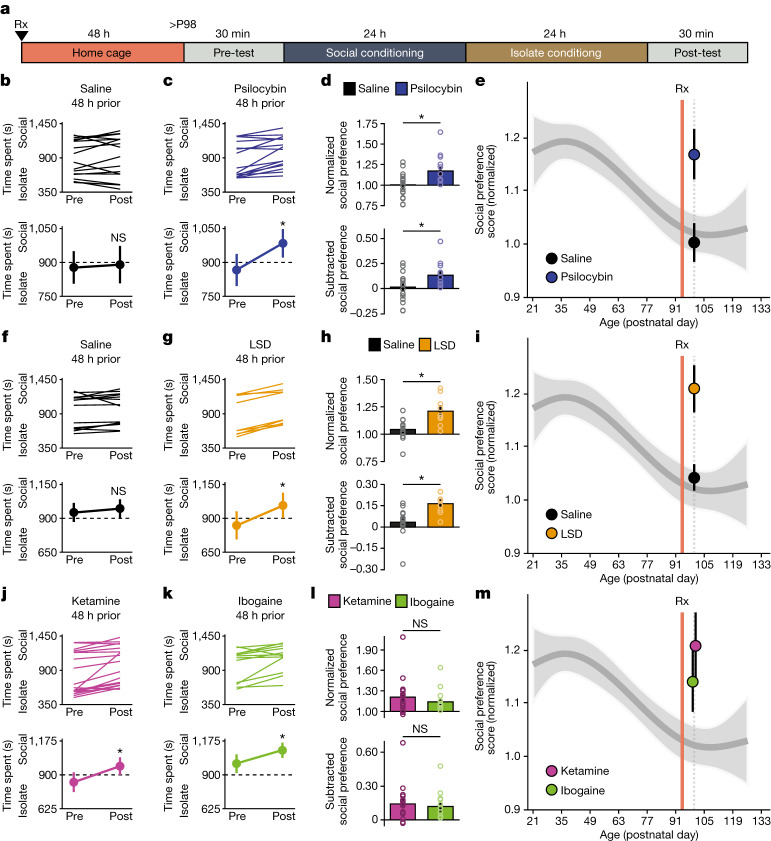
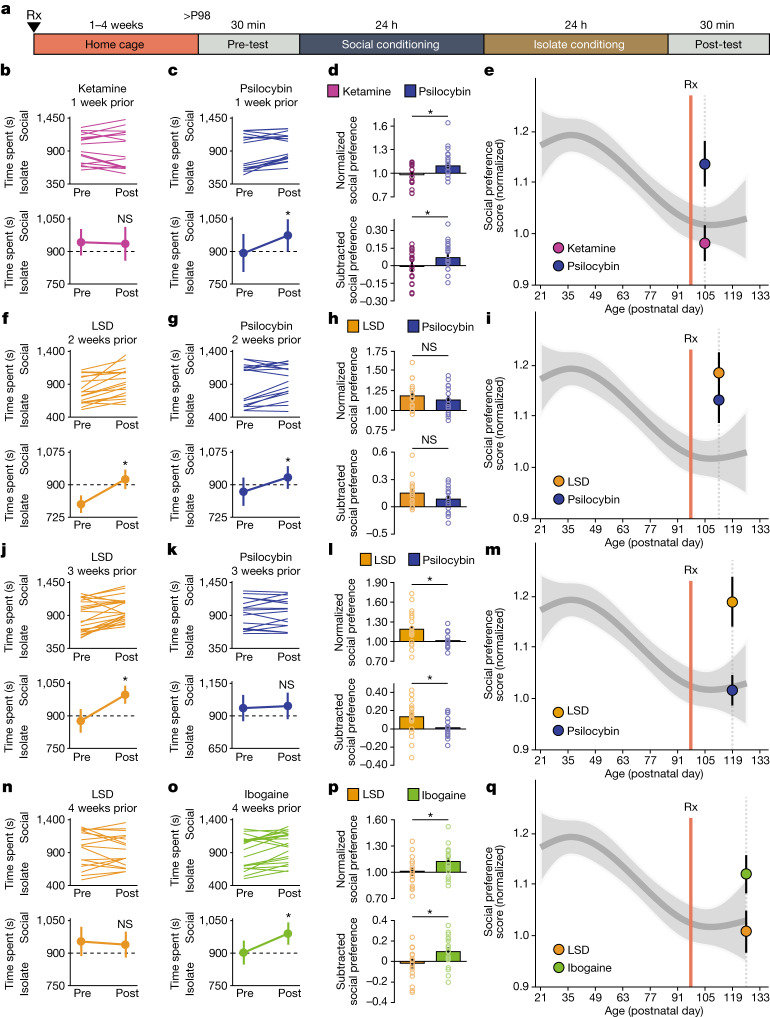
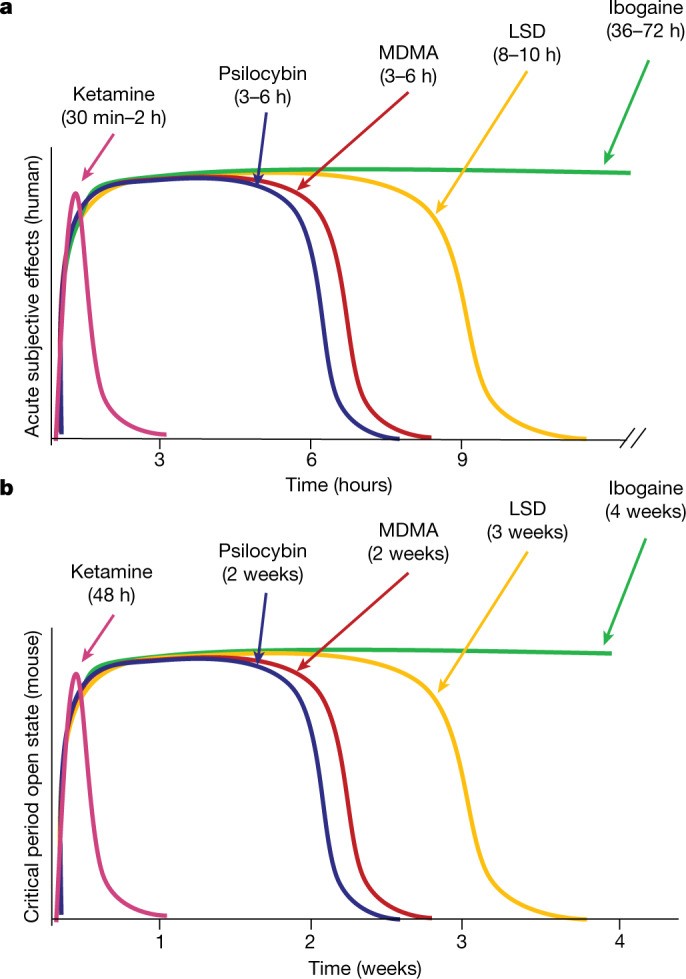
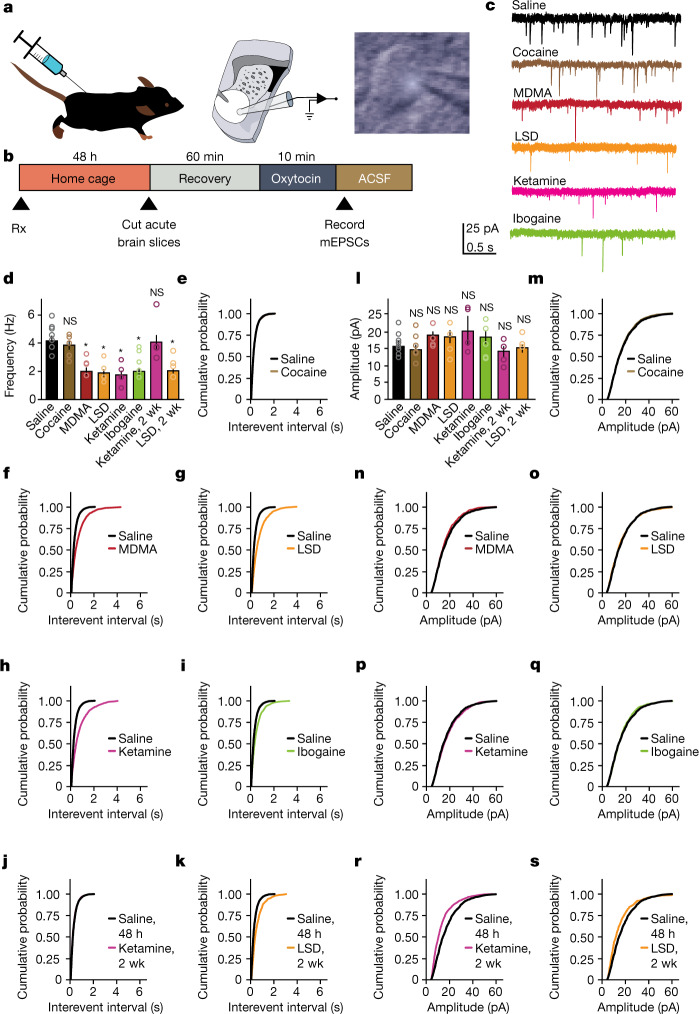
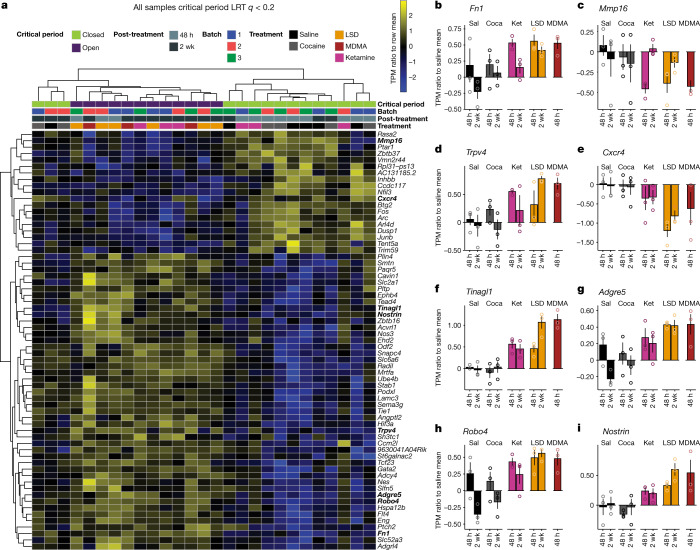
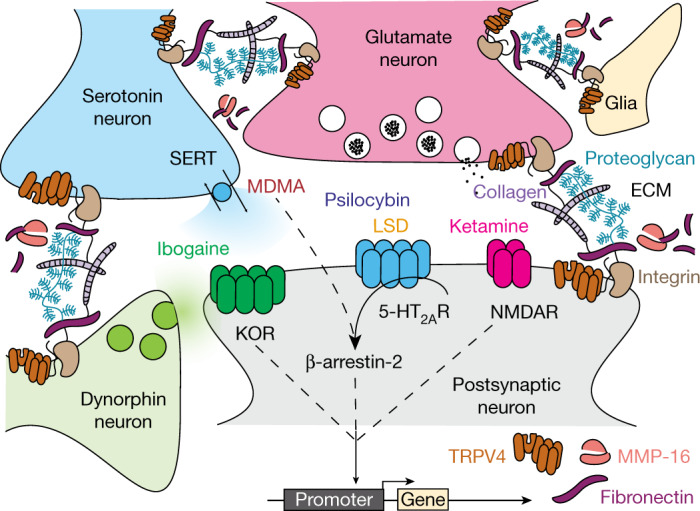
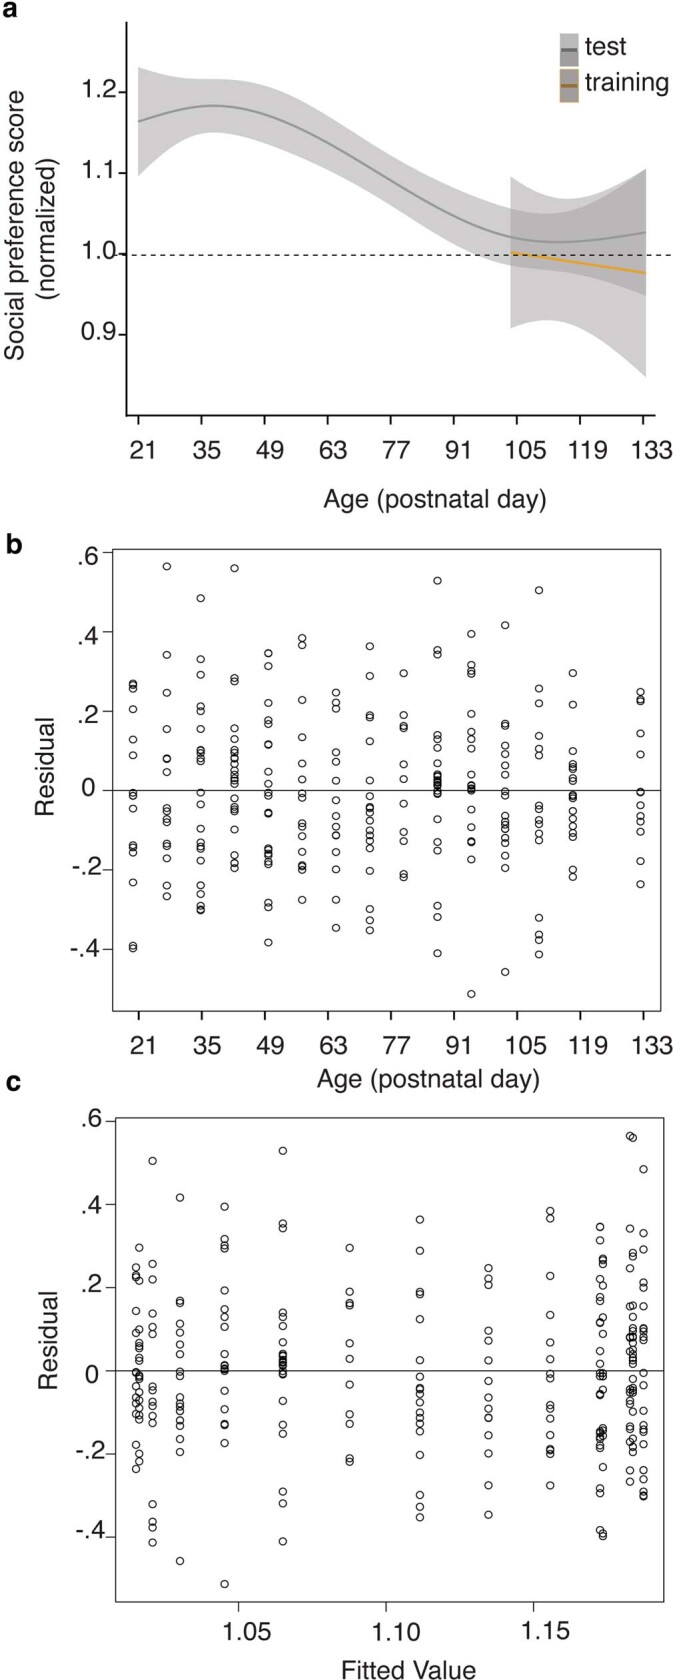
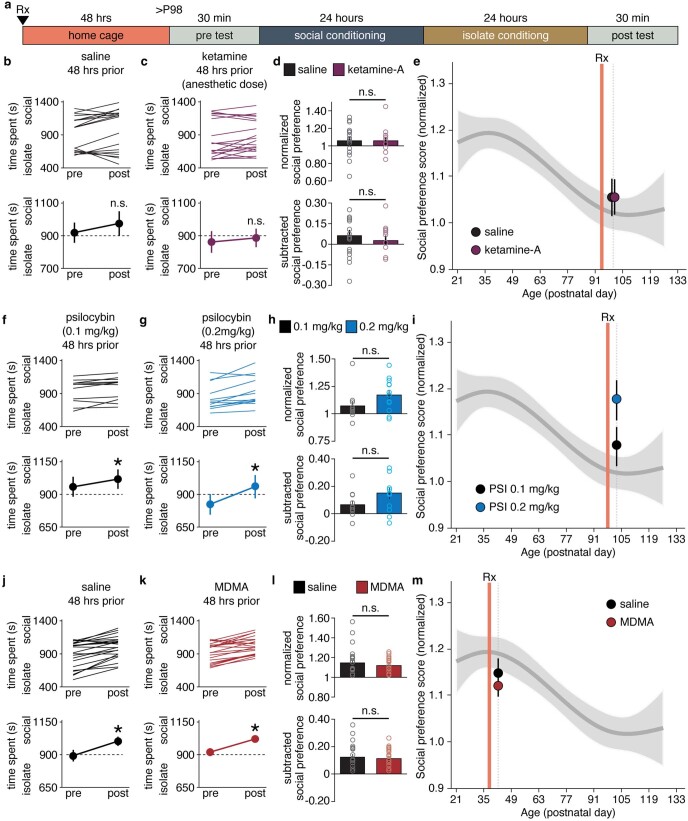
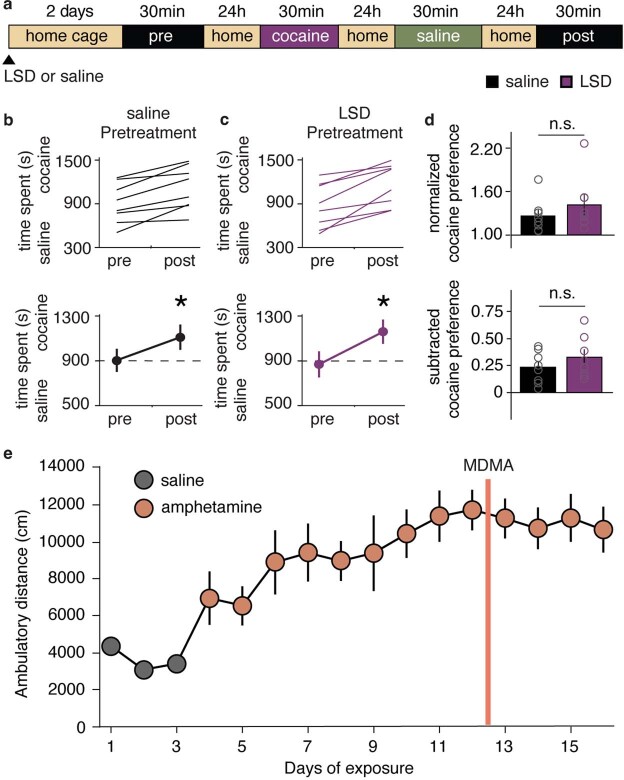
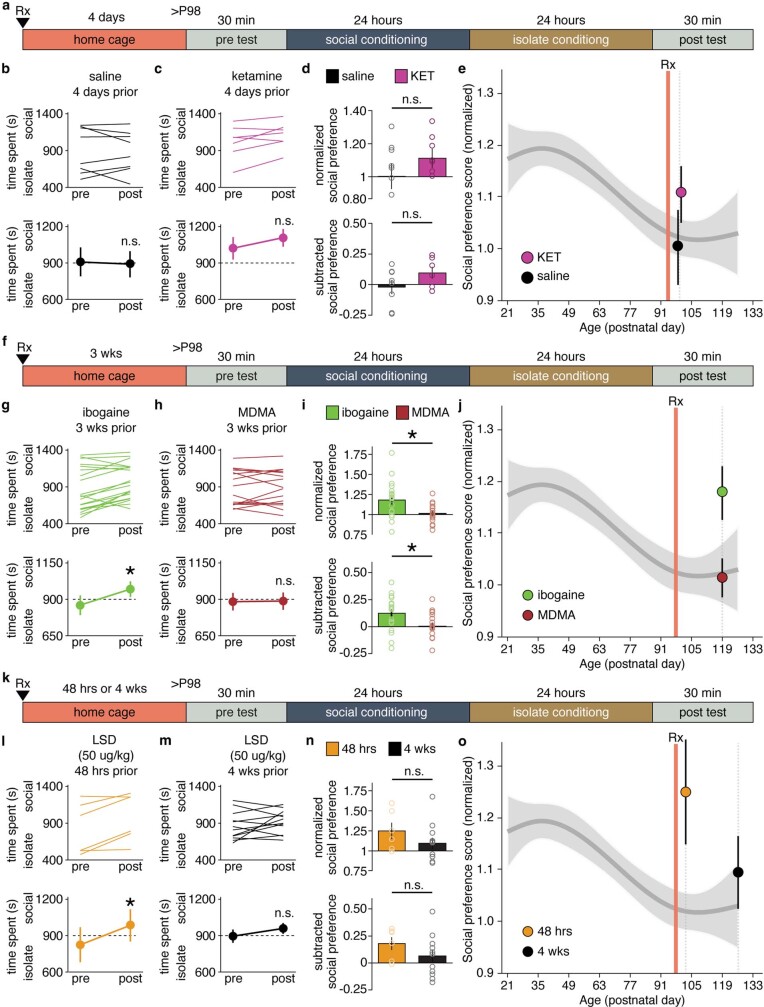
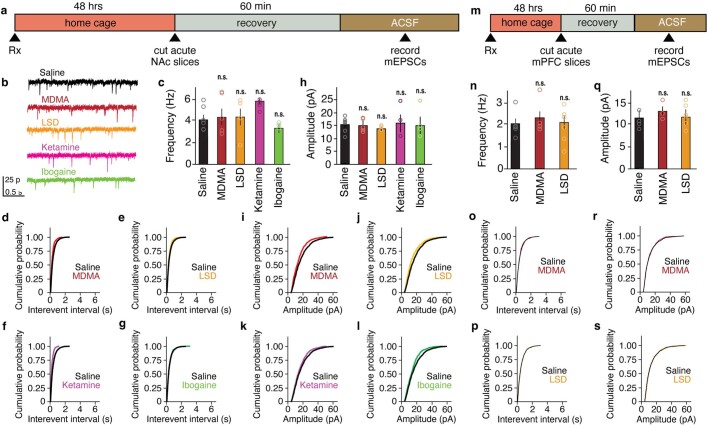
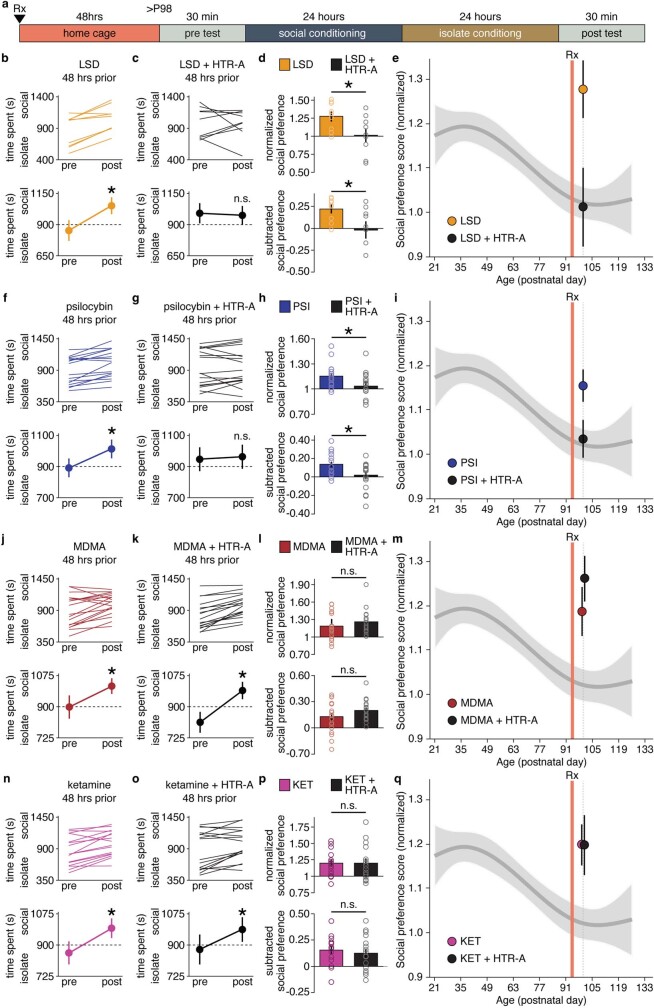
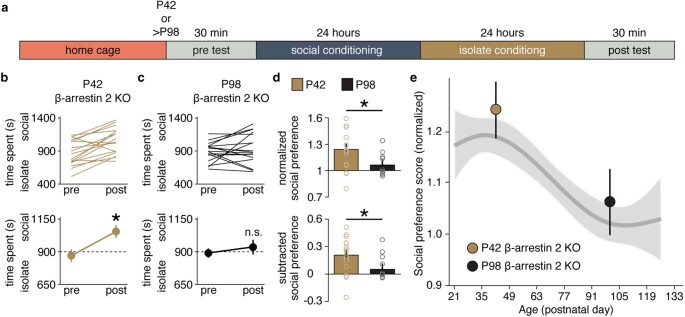
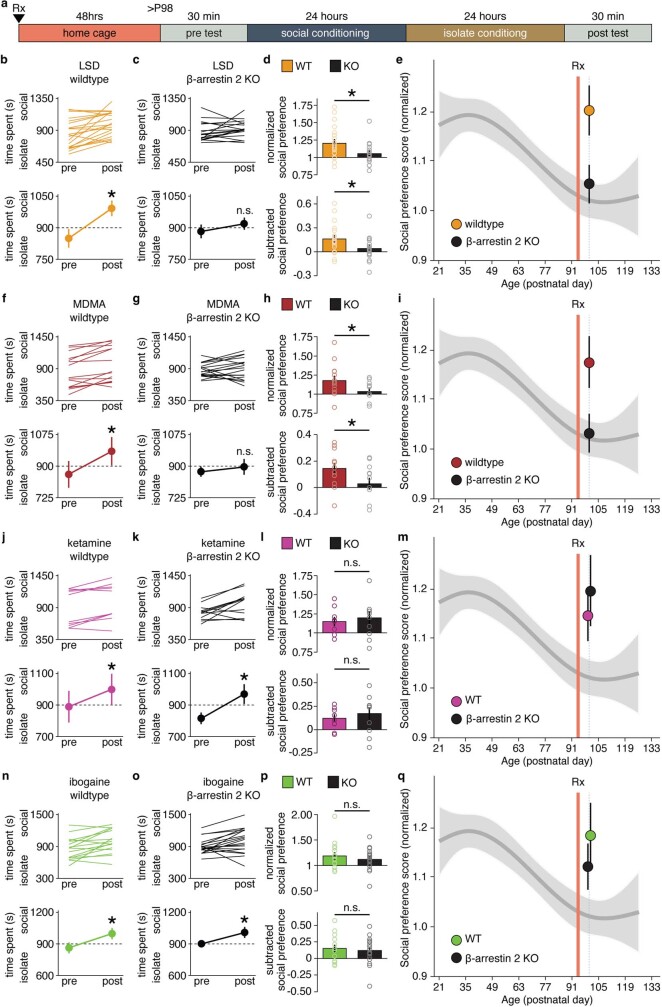
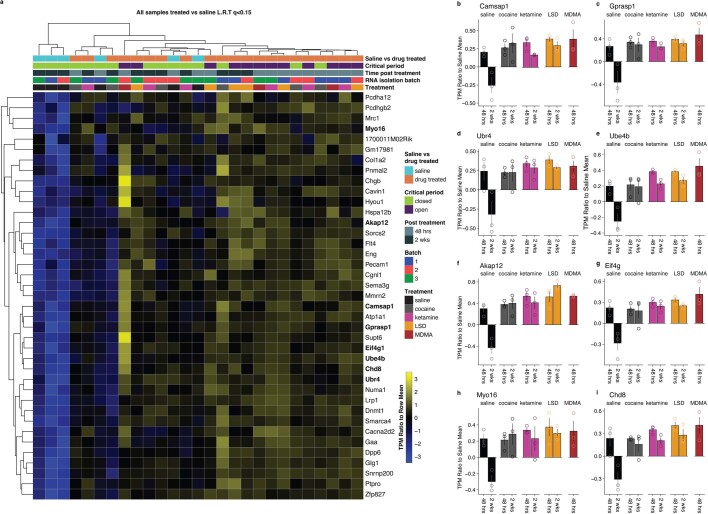
Psychedelics are a broad class of drugs defined by their ability to induce an altered state of consciousness1,2. These drugs have been used for millennia in both spiritual and medicinal contexts, and a number of recent clinical successes have spurred a renewed interest in developing psychedelic therapies3-9. Nevertheless, a unifying mechanism that can account for these shared phenomenological and therapeutic properties remains unknown. Here we demonstrate in mice that the ability to reopen the social reward learning critical period is a shared property across psychedelic drugs. Notably, the time course of critical period reopening is proportional to the duration of acute subjective effects reported in humans. Furthermore, the ability to reinstate social reward learning in adulthood is paralleled by metaplastic restoration of oxytocin-mediated long-term depression in the nucleus accumbens. Finally, identification of differentially expressed genes in the 'open state' versus the 'closed state' provides evidence that reorganization of the extracellular matrix is a common downstream mechanism underlying psychedelic drug-mediated critical period reopening. Together these results have important implications for the implementation of psychedelics in clinical practice, as well as the design of novel compounds for the treatment of neuropsychiatric disease.


Conflict of interest statement

G.D. is on the scientific advisory board for Compass Pathways, Pangea Botanica and the MIND Foundation.

Figures

Fig. 1
Fig. 1. Psychedelics reopen the social reward learning critical period.
a, Experimental time course of i.p. pretreatment (Rx) in sCPP. b,c,f,g,j,k, Individual (top) and average (bottom) responses of P98 mice indicate that mice pretreated with psilocybin (0.3 mg kg−1) (c; n = 15, t(14) = −3.741, P = 0.002), LSD (1 µg kg−1) (g; n = 9, t(8) = −7.095, P < 0.001), ketamine (3 mg kg−1) (j; n = 18, t(17) = −3.826, P < 0.002), and ibogaine (40 mg kg−1) (k; n = 12, t(11) = −2.690, P = 0.02) but not saline (b; n = 17 mice, t(16) = −0.441, P = 0.665. f; n = 14 mice, t(13) = −1.215, P = 0.25) develop a preference for the social bedding cue. Two-tailed paired t-test. d,h,l, Comparisons reveal a significant increase in normalized (top) and subtracted (bottom) social preference for pretreatment with psilocybin versus saline (d; normalized, t(30) = −2.800, P = 0.009; subtracted, t(30) = −2.401, P = 0.023), and with LSD versus saline (h; normalized, t(21) = −3.558, P = 0.002; subtracted, t(21) = −3.344, P = 0.003), but no difference between pretreatment with ketamine and ibogaine (l; normalized, t(28) = 0.749, P = 0.460; subtracted, t(28) = 0.409, P = 0.686). Two-tailed unpaired t-test, with Welch’s correction to account for unequal variance in l subtracted. *P < 0.05; NS, not significant (P > 0.05). e,i,m, Normalized social preference in mice pretreated with psilocybin versus saline (e), LSD versus saline (i) and ibogaine versus ketamine (m), plotted against a natural spline regression model of the developmental time course of normalized social preference scores. Comparison with the natural spline model revealed that the magnitude of sCPP in saline-treated mice did not deviate significantly from the closed state (b; P = 0.72) (f; P = 0.90), whereas mice pretreated with psilocybin (P = 1.12 × 10−6), LSD (P = 1.76 × 10−9), ketamine (P = 8.78 × 10−4) or ibogaine (P = 3.17 × 10−5) demonstrated a significant mean shift in range of the open state. Comparisons with the natural spline model were considered not significant (P > 0.1). Rx indicates drug treatment. Data are as mean ± s.e.m. n refers to the number of biologically independent mice.
Fig. 2
Fig. 2. The duration of the open state induced by psychedelics is variable.
a, Experimental time course of i.p. pretreatment in the sCPP assay. bq, sCPP in adult mice 1 week after i.p. pretreatment with ketamine (3 mg kg−1) or psilocybin (0.3 mg kg−1) (be), 2 weeks after pretreatment with LSD (1 µg kg−1) or psilocybin (0.3 mg kg−1) (fi), 3 weeks after pretreatment with LSD (1 µg kg−1) or psilocybin (0.3 mg kg−1) (jm) or 4 weeks after pretreatment with LSD (1 µg kg−1) or ibogaine (40 mg kg−1) (nq). b,c,f,g,j,k,n,o, Individual (top) and average (bottom) responses indicate the reinstatement of sCPP is absent one week after ketamine treatment (b, n = 16 mice, t(15) = 0.204, P = 0.841), lasts two weeks for psilocybin (c, 1 week: n = 17 mice, t(16) = −2.959, P = 0.009; g, 2 weeks: n = 22 mice, t(21) = −3.542, P = 0.002; k, 3 weeks: n = 16 mice, t(15) = −0.405, P = 0.691), lasts 3 weeks for LSD (f, 2 weeks: n = 18 mice, t(17) = −4.360, P < 0.001; j, 3 weeks: n = 23 mice, t(22) = −3.671, P = 0.001; n, 4 weeks: n = 17 mice, t(16) = 0.441, P = 0.665), and lasts at least 4 weeks for ibogaine (o, n = 20 mice, t(19) = −3.004, P = 0.007). Two-tailed paired t-test. d,h,l,p, Comparisons reveal a significant difference in sCPP between ketamine and psilocybin groups 1 week after pretreatment (d, normalized: t(31) = −2.700, P = 0.011; subtracted: t(31) = −2.113, P = 0.043), between LSD and psilocybin at 3 weeks (l, normalized: t(34) = 3.050, P = 0.004; subtracted: t(37) = 2.471, P = 0.018) but not at 2 weeks (h, normalized: t(38) = 0.390, P = 0.699; subtracted: t(38) = 1.077, P = 0.288), and LSD and ibogaine 4 weeks after pretreatment (p, normalized: t(35) = −2.045, P = 0.048; subtracted: t(35) = −2.283, P = 0.029). Two-tailed unpaired t-test, with Welch’s correction to account for unequal variance in l subtracted. *P < 0.05; NS, not significant (P > 0.05). e,i,m,q, Normalized social preference one week after ketamine or psilocybin (e), two (i) and three (m) weeks after LSD and psilocybin, and four weeks after LSD and ibogaine (q) plotted against a natural spline model of the developmental time course of normalized social preference scores. The magnitude of sCPP did not deviate significantly from the closed state 1 week after ketamine (eP = 0.949), three weeks after psilocybin (iP = 0.633) and four weeks after LSD (mP = 0.705), whereas the magnitude demonstrated a significant mean shift in range of the open state for both one (eP = 0.054) and two weeks (iP = 0.0211) after psilocybin, two (iP = 0.0121) and three weeks (mP = 0.00745) after LSD and four weeks after ibogaine (qP = 0.0758). Comparisons to the natural spline model were considered not significant (P > 0.1). Data are mean ± s.e.m. n refers to the number of biologically independent mice.
Fig. 3
Fig. 3. The durations of acute subjective effects in humans are proportional to the durations of the critical period open state in mice.
a, Durations of the acute subjective effects of psychedelics in humans (data from refs. ,,–). b, Durations of the critical period open state induced by psychedelics in mice. Based on ref. and Figs. 1 and 2 and Extended Data Fig. 5.
Fig. 4
Fig. 4. Psychedelics induce metaplasticity.
a,b, Illustration (a) and time course (b) of treatment and electrophysiology protocol. Illustration in a adapted from ref. . c, Representative mEPSC traces recorded from MSNs in the NAc of oxytocin-treated brain slices collected from mice pretreated with saline (n = 8), 20 mg kg−1 cocaine (n = 6), 10 mg kg−1 MDMA (n = 4), 1 µg kg−1 LSD (n = 4), 3 mg kg−1 ketamine (n = 4) or 40 mg kg−1 ibogaine (n = 5). dk, Average frequency of mEPSCs (d) and cumulative probabilities of interevent intervals for cocaine (e), MDMA (f), LSD (g), ketamine (h) and ibogaine (i) recorded from MSNs after two days, and after two weeks (wk) for ketamine (j) and LSD (k). ls, Average (l) and cumulative probability distributions of amplitudes recorded from MSNs for cocaine (m), MDMA (n), LSD (o), ketamine (p) and ibogaine (q) recorded from MSNs after two days, and after two weeks for ketamine (r) and LSD (s). One-way analysis of variance revealed a significant effect of treatment on frequency (dF(7,31) = 5.99, P = 0.0002) but not amplitude (lF(7,31) = 1.09, P = 0.39), and multiple comparison analysis revealed an oxytocin-mediated decrease in mEPSC frequency after pretreatment with psychedelics (f, MDMA: P = 0.011; g, LSD: P = 0.0013; h, ketamine: P = 0.001; i, ibogaine: P = 0.013), but not cocaine (P = 0.83), and that this decrease remained significant at the two-week time point with LSD (kn = 4, P = 0.01) but not ketamine (jn = 4, P = 0.99). All cells have been recorded in slices of adult mice at P98. Data are mean ± s.e.m. *P < 0.05; NS, not significant (P > 0.05). n refers to the number of biologically independent cells.
Fig. 5
Fig. 5. Characteristic changes in transcription induced by psychedelics.
a, Heat map of normalized RNA expression values from the microdissected NAc for genes that are significantly differentially expressed in conditions where the critical period remains in the open state versus conditions where the critical period remains in or returns to the closed state. LRT, likelihood ratio test; TPM, transcripts per million. bi, Ratio of expression values to average saline baseline for top scoring genes related to extracellular matrix remodelling: Fn1 (b), Mmp16 (c), Trpv4 (d), Cxcr4 (e), Tinagl1 (f), Adgre5 (g), Robo4 (h) and Nostrin (i). Coca, cocaine; ket, ketamine; sal, saline.
Fig. 6
Fig. 6. Working model of convergent cellular mechanisms of psychedelics.
Psychedelics act on a diverse array of principal binding targets and downstream signalling mechanisms that are not limited to the serotonin 2A receptor (Extended Data Fig. 7) or β-arr2 (Extended Data Fig. 9). Instead, mechanistic convergence occurs at the level of DNA transcription (Fig. 5). Dynamically regulated transcripts include components of the extracellular matrix (ECM) such as fibronectin, as well as receptors (such as TRPV4) and proteases (such as MMP-16) implicated in regulating the ECM. Adapted from ref. .
Extended Data Fig. 1
Extended Data Fig. 1. Social conditioned place preference assay.
Time course (top) and protocol (bottom) for the social conditioned place preference (social CPP) assay used to measure the reward value of social interactions, where an increased amount of time spent in the bedding paired to the socially conditioned cue in the ‘post’ compared to ‘pre’ trial is interpreted as evidence for a learned association between the positive reward value of social interactions and a novel bedding cue (social reward learning).
Extended Data Fig. 2
Extended Data Fig. 2. Computation model of social reward critical period.
Natural-spline model curve fitting the normalized time spent in social versus isolate cue following social CPP across 15 postnatal ages of not injected (P21-P112) or saline injected (P126) mice from Nardou et al. 2019. Ages were chosen to span major milestones in social and brain development including: weaning (postnatal day 21, P21), onset of puberty (P28), sexual maturity (P42), early adulthood (P60), and mature adulthood (P90). (a) Plot showing model fit to training and test data indicating a strong concordance. (b) Plot of residuals vs age for ns-spline model. (C) Plot of residuals vs fitted values for ns-spline model.
Extended Data Fig. 3
Extended Data Fig. 3. Psychedelic effects are dose, context, and age dependent.
(a) Diagram illustrating experimental time course of i.p. pretreatment in social CPP. (b,c) Individual (top) and average (bottom) responses indicate that adult animals do not develop a preference for the social bedding cue after pretreatment with an anesthetic dose of i.p. ketamine, suggesting an important role for context, since social interactions are precluded at this dose (100 mg/kg) (b, n = 18, t(17) = −1.75, P = 0.0986; c, n = 20, t(19) = −0.89452, P = 0.382). (d) Comparisons (two-tailed unpaired t-test) reveal no significant difference in normalized (top) and subtracted (bottom) social preference for saline versus ketamine pretreated animals (d, normalized, t(36) = 0.012694, P = 0.990; subtracted, t(36) = −0.7581, P = 0.454). (e) Normalized social preference of adult animals pretreated with saline and ketamine plotted against ns-spline model of the developmental time course of normalized social preference scores. Comparison to the ns-spine model revealed that the magnitude of sCPP in saline (P = 0.9976) and ketamine (P = 0.9921) pretreated animals did not deviate significantly from the “closed” state. (f,g) Individual (top) and average (bottom) responses indicate that adult animals develop a significant preference for the social bedding cue after pretreatment with 0.1 mg/kg (b, n = 11, t(10) = −2.3288, P = 0.0421) and 0.2 mg/kg psilocybin (c, n = 12, t(11) = −3.5499, P = 0.0046). (h) Comparisons (two-tailed unpaired t-test) reveal no significant difference in normalized (top) and subtracted (bottom) social preference for pretreatment with 0.1 mg/kg versus 0.2 mg/kg psilocybin (h, normalized, t(21) = −1.6504, P = 0.115; subtracted, t(21) = −1.7097, P = 0.109). (i) Normalized social preference of adult animals pretreated with 0.1 mg/kg and 0.2 mg/kg psilocybin plotted against ns-spline model of the developmental time course of normalized social preference scores. Comparison to the ns-spine model revealed that the magnitude of sCPP in animals pretreated with 0.1 mg/kg psilocybin (P = 0.7938) did not deviate significantly from the “closed” state, while animals pretreated with 0.2 mg/kg psilocybin (P = 0.04646) demonstrated a significant mean shift in range of the “open” state. (j,k) Individual (top) and average (bottom) responses indicate that P42 animals develop a significant preference for the social bedding cue after pretreatment with saline (j, n = 22, t(21) = −5.1882, P < 0.001) and MDMA (k, n = 22, t(21) = −5.5432, P < 0.001) (two-tailed paired t-test). (d), Comparisons (two-tailed unpaired t-test) reveal no significant difference in normalized (top) and subtracted (bottom) social preference for pretreatment with MDMA (10 mg/kg) versus saline (l, normalized, t(42) = 0.6877, P = 0.495; subtracted, t(42) = 0.29151, P = 0.772). (m) Normalized social preference of P42 animals pretreated with saline and MDMA plotted against ns-spline model of the developmental time course of normalized social preference scores. Comparison to the ns-spine model revealed that the magnitude of sCPP in animals pretreated with 10 mg/kg MDMA (P = 0.1831) or saline (P = .7721) did not deviate significantly from the “open” state; comparisons to spline regression model were considered not significant P > 0.1. Data are presented as mean ± s.e.m. *P < 0.05; n.s., comparisons not significant (P > 0.05). n = X biologically independent animals.
Extended Data Fig. 4
Extended Data Fig. 4. Psychedelic pretreatment does not addiction-like behaviors.
(a) Diagram illustrating experimental time course of i.p. injections in cocaine CPP. (b,c) Individual (top) and average (bottom) time spent in the cocaine paired context indicates that mice pretreated with saline (b, n = 8, t(7) = −4.5102, P = 0.0028) and LSD (c, n = 8, t(7) = −4.8353, P = 0.0019) both develop significantly increased preference for the cocaine context after conditioning with 5 mg/kg cocaine (two-tailed paired t-test). (d) Comparisons reveal no difference in normalized cocaine preference (top, t(14) = −1.0051, P = 0.332) and subtracted cocaine preference (bottom, t(14) = −1.1035, P = 0.288) (two-tailed unpaired t-test). (e) Locomotor activity during sensitization to amphetamine (20 mg/kg) following 3 days of saline pretreatment. Administration of MDMA after day 12 did not significantly alter the locomotor response to amphetamine (day 12 versus day 16, n = 12, t(11) = 2.2171, P = 0.443). Data are presented as mean ± s.e.m. *P < 0.05; n.s., comparisons not significant (P > 0.05). n = X biologically independent animals.
Extended Data Fig. 5
Extended Data Fig. 5. Duration of the open state induced by psychedelics is variable but not extended by increasing dose.
(a,f,k) Diagrams illustrating experimental time course of i.p. pretreatment in social CPP. (b,c) Individual (top) and average (bottom) responses indicate that adult animals do not develop a significant preference for the social bedding cue 4 days after pretreatment with saline (b, n = 8, t(7) = 0.38628, P = 0.711) and ketamine (3 mg/kg) (c, n = 7, t(6) = −2.2235, P = 0.068) (two-tailed paired t-test). (d) Comparisons (two-tailed unpaired t-test) reveal no significant difference in normalized (top) and subtracted (bottom) social preference for 4 days after pretreatment with ketamine versus saline (d, normalized, t(13) = t = −1.2142, P = 0.258; subtracted, t(13) = −1.6823, P = 0.123). (e) Comparison to the ns-spine model revealed that the magnitude of sCPP did not deviate significantly from the “closed” state four days after saline (P = 0.508) and ketamine (P = 0.4418). (g,h) Individual (top) and average (bottom) responses indicate the reinstatement of social CPP is present three weeks after pretreatment with ibogaine (g, 40 mg/kg, n = 20, t(19) = −3.5381, P = 0.0022), but absent with MDMA (h, 10 mg/kg, n = 16, t(15) = −0.11467, P = 0.968) (two-tailed paired t-test). (i) Comparisons (two-tailed unpaired t-test) reveal a significant difference in normalized (top, t(34) = 2.615, P = 0.0170) and subtracted (bottom, t(34) = 2.4756, P = 0.0204) social preference 3 weeks after pretreatment with ibogaine versus MDMA. Comparison to the ns-spine model revealed that the magnitude of sCPP demonstrated a significant mean shift in range of the “open” state for 3 weeks after ibogaine (P = 0.01158), while the magnitude did not deviate significantly from the “closed” state for 3 weeks after MDMA (P = 0.9152). (k,l) Individual (top) and average (bottom) responses indicate that the reinstatement of social CPP is present 48 h after pretreatment with LSD (k, n = 6, t(5) = −3.0103, P = 0.0297), but absent 4 weeks after (l, n = 12, t(11) = −1.1834, P = 0.262). (m) Comparisons reveal non-significant difference in normalized (top) and subtracted (bottom) social preference for 48 h versus 4 weeks after pretreatment with LSD (m, normalized, t(16) = 1.2786, P = 0.2314; subtracted, t(16) = 1.4209, P = 0.1792) (two-tailed unpaired t-test). (n) Comparison to the ns-spine model revealed that the magnitude of sCPP demonstrated a significant deviation to the “closed” state at 48 h (P = .0915), while the magnitude did not deviate significantly from the “closed” state at 4 weeks (P = 0.3168); comparisons to spline regression model were considered not significant P > 0.1. Data are presented as mean ± s.e.m. *P < 0.05; n.s., comparisons not significant (P > 0.05). n = X biologically independent animals.
Extended Data Fig. 6
Extended Data Fig. 6. Psychedelics do not induce hyperplasticity in the NAc or mPFC.
(a) Time course of treatment and electrophysiology protocol. (b) Representative mEPSC traces recorded from MSNs in the NAc of brain slices collected from mice pretreated 48 previous with saline (n = 6), 10 mg/kg MDMA (n = 6), 1 µg/kg LSD (n = 4), 3 mg/kg ketamine (n = 4), and 40 mg/kg ibogaine (n = 4). (c) Average frequency of mEPSCs and (dg) cumulative probabilities of inter event intervals recorded from MSNs. (h) Average and (il) cumulative probability distributions of amplitudes recorded from MSNs. One-way analysis of variance revealed no significant effect of treatment on frequency (F(5,21) = 1.05, P = 0.41) or amplitude (F(5,21) = 0.16, P = 0.97). (m) Time course of treatment and electrophysiology protocol for mEPSCs recorded in layer 5 pyramidal neurons in the mPFC of brain slices collected from mice pretreated 48 previous with saline (n = 5), 10 mg/kg MDMA (n = 4), 1 µg/kg LSD (n = 6). (n) Average frequency of mEPSCs and (op) cumulative probabilities of inter event intervals recorded from layer 5 pyramidal neurons. (q) Average and (rs) cumulative probability distributions of amplitudes recorded from layer 5 pyramidal neurons. One-way analysis of variance revealed no significant effect of treatment on frequency (F(2,12) = 0.34, P = 0.72) or amplitude (F(2,12) = 0.26, P = 0.78). All cells have been recorded in slices of adult animals at P98. Data are presented as mean ± s.e.m. *P < 0.05, n.s. comparisons not significant P > 0.05. n = X biologically independent cells.
Extended Data Fig. 7
Extended Data Fig. 7. Serotonin 2A receptors are not universally required for critical period reopening.
(a) Diagram illustrating experimental time course of i.p. pretreatment in social CPP. (b,c,f,g,j,k,n,o) Individual (top) and average (bottom) responses of P98 animals indicate that ketanserin (HTR-A) abolished the reopening of social reward learning critical period by LSD (b, LSD, n = 9 animals, t(8) = −4.938, P = 0.001; c, LSD + HTR-A, n = 9 animals, t(8) = 0.210, P = 0.839), and psilocybin (f, psilocybin n = 16 animals, t(15) = −4.494, P < 0.001; g, psilocybin + HTR-A, n = 17 animals, t(16) = −0.515, P = 0.613), but not by MDMA (j, MDMA, n = 18 animals, t(17) = −2.916, P = 0.01 ; k, MDMA + HTR-A, n = 17 animals, t(16) = −6.737, P < 0.001) and ketamine (n, ketamine n = 16 animals, t(15) = −4.517, P < 0.001; o, ketamine + HTR-A, n = 16 animals, t(15) = −2.952, P < 0.001) (two tailed paired t-test). (d,h,l,p) Comparisons of the normalized (top) and subtracted (bottom) social preference between treatment groups reveal a decrease following LSD + HTR-A versus LSD alone (d, normalized, t(16) = 2.427, P = 0.027; subtracted, t(16) = 2.377, P = 0.030), a decrease following psilocybin + HTR-A vs psilocybin alone (h, normalized, t(31) = 2.114, P = 0.043; subtracted, t(31) = 2.475, P = 0.019), but no difference between MDMA and MDMA + HTR-A pretreatment groups (l, normalized, t(33) = −0.971, P = 0.339; subtracted, t(33) = −1.282, P = 0.209), nor ketamine and ketamine + HTR-A pretreatment groups (p, normalized, t(30) = 0.013, P = 0.990; subtracted, t(30) = 0.535, P = 0.597) (two tailed unpaired t-test). (e,i,m,q) Normalized social preference in mice pretreated with LSD (e), psilocybin (i), MDMA (m) and ketamine (q) in the presence or the absence of HTR-A plotted against ns-spline model of the developmental time course of normalized social preference scores. Comparison to the ns-spine model revealed that the magnitude of sCPP did not deviate significantly from the “closed” state for LSD + HTR-A (P = 0.728), and psilocybin + HTR-A (P = 0.987), while the magnitude demonstrated a significant mean shift in range of the “open” state for LSD (P = 2.52e-09), psilocybin (P = 1.43e-06), MDMA in presence (P = 1.77e-05) or absence of HTR-A (P = 0.22e-4), and ketamine in presence (P = 0.002619) or absence of HTR-A (P = 0.000996); comparisons to spline regression model were considered not significant P > 0.1. Data are presented as mean ± s.e.m. *P < 0.05, n.s. comparisons not significant P > 0.05. n = X biologically independent animals.
Extended Data Fig. 8
Extended Data Fig. 8. β-arrestin 2 KO mice exhibit normal maturational profile of social reward learning.
(a) Diagram illustrating experimental time course of social CPP. (be) Social CPP in juvenile (P42) and adult (P98) β-arrestin 2 KO mice. (b,c) Individual (top) and average (bottom) responses of adult animals indicate that only juvenile β-arrestin 2 KO mice develop a preference for the social bedding cue (P42 (n = 17 animals, t(16) = −4.392, P < 0.001), P98 (n = 17 animals, t(16) = −0.922, P = 0.370) (two tailed paired t-test)). (d) Comparisons reveal a difference in normalized (top, t(32) = 2.110, P = 0.043) and subtracted (bottom, t(32) = 2.120, P = 0.042) social preference at P42 versus P98 mice (two tailed unpaired t-test). (e) Normalized social preference of β-arrestin 2 KO mice at P42 and P98 plotted against ns-spline model of the developmental time course of normalized social preference scores. Comparison to the ns-spine model revealed that the magnitude of sCPP did not deviate significantly from the “open” state at P42 (P = 0.840) and from the “closed” state at P98 (P = 0.760); comparisons to spline regression model were considered not significant P > 0.1. Data are presented as mean ± s.e.m. *P < 0.05, n.s. comparisons not significant P > 0.05. n = X biologically independent animals.
Extended Data Fig. 9
Extended Data Fig. 9. β-arrestin 2 is not universally required for critical period reopening.
(a) Diagram illustrating experimental time course of i.p. pretreatment in social CPP. (b,c,f,g,j,k,n,o) Individual (top) and average (bottom) responses of P98 animals indicate that LSD (b, WT, n = 21 animals, t(20) = −3.992, P < 0.001; c, β-arrestin 2 KO, n = 17 animals, t(16) = −1.105, P = 0.286) and MDMA (f, WT, n = 15 animals, t(14) = −3.994, P = 0.001; g, β-arrestin 2 KO, n = 18 animals, t(17) = −0.759, P = 0.458) don’t reopen the social reward learning critical period in β-arrestin 2 KO mice whereas ketamine (j, WT, n = 10 animals, t(9) = −3.448, P = 0.007; k, β-arrestin 2 KO, n = 12 animals, t(11) = −2.903, P = 0.014) and ibogaine (n, WT, n = 16 animals, t(15) = −3.135, P = 0.007; o, β-arrestin 2 KO, n = 18 animals, t(17) = −2.655, P = 0.016) do reopen the critical period both in WT and in β-arrestin 2 KO mice (two tailed paired t-test). (d,h,l,p) Comparisons of the normalized (top) and subtracted (bottom) social preference in WT and β-arrestin 2 KO mice reveal a difference in the magnitude of sCPP after pretreatment with LSD (d, normalized, t(36) = 2.248, P = 0.031; subtracted, t(36) = 2.139, P = 0.039), and MDMA (h, normalized, t(31) = 2.227, P = 0.033; subtracted, t(31) = 2.112, P = 0.043), but no difference after ketamine (l, normalized (t(20) = −0.545, P = 0.591, subtracted, t(20) = −0.676, P = 0.507) and ibogaine (p, normalized, t(33) = 0.790, P = 0.435; subtracted, t(33) = 0.462, P = 0.647) (two tailed unpaired t-test). (e,i,m,q) Normalized social preference in WT and β-arrestin 2 KO mice pretreated with LSD (e), MDMA (i), ketamine (l), and ibogaine (q) plotted against ns-spline model of the developmental time course of normalized social preference scores of male mice. Comparison to the ns-spine model revealed that the magnitude of sCPP did not deviate significantly from the “closed” state in β-arrestin 2 KO mice for LSD (P = 0.357) and MDMA (P = 0.490), while the magnitude demonstrated a significant mean shift in range of the “open” state for WT pretreated with LSD (WT, P = .00315), or MDMA (WT, P = .0140), and for WT and KO pretreated with ketamine (WT, P = .00911; β-arrestin 2 KO, P = .0198) or ibogaine (WT, P = .0249; β-arrestin 2 KO, P = .0954); comparisons to spline regression model were considered not significant P > 0.1. Data are presented as mean ± s.e.m. *P < 0.05, n.s. comparisons not significant P > 0.05. n = X biologically independent animals.
Extended Data Fig. 10
Extended Data Fig. 10. Comparison of gene expression for saline versus all psychoactive drug (including cocaine) treatment groups.
(a) Heatmap of normalized RNA expression values from the microdissected NAc for genes significantly differentially expressed between treatment with any psychoactive drug including cocaine vs. the saline control. (bi) Ratio of expression values to average saline baseline for top scoring genes from this analysis related to increased synaptic transmission.

Comment in

References

    1. Snyder, S. H. Drugs and the Brain (W. H. Freeman & Co., 1986).
    1. Shulgin AT. The background and chemistry of MDMA. J. Psychoactive Drugs. 1986;18:291–304. doi: 10.1080/02791072.1986.10472361. - DOI - PubMed
    1. Griffiths RR, et al. Psilocybin produces substantial and sustained decreases in depression and anxiety in patients with life-threatening cancer: a randomized double-blind trial. J. Psychopharmacol. 2016;30:1181–1197. doi: 10.1177/0269881116675513. - DOI - PMC - PubMed
    1. Noller GE, Frampton CM, Yazar-Klosinski B. Ibogaine treatment outcomes for opioid dependence from a twelve-month follow-up observational study. Am. J. Drug Alcohol Abuse. 2018;44:37–46. doi: 10.1080/00952990.2017.1310218. - DOI - PubMed
    1. Johnson MW, Griffiths RR. Potential therapeutic effects of psilocybin. Neurotherapeutics. 2017;14:734–740. doi: 10.1007/s13311-017-0542-y. - DOI - PMC - PubMed

Publication types