. 2023 Jun;618(7966):799-807.
doi: 10.1038/s41586-023-06197-z. Epub 2023 Jun 14.

A tripartite rheostat controls self-regulated host plant resistance to insects

Affiliations

A tripartite rheostat controls self-regulated host plant resistance to insects

Jianping Guo et al. Nature. 2023 Jun.

Abstract

Plants deploy receptor-like kinases and nucleotide-binding leucine-rich repeat receptors to confer host plant resistance (HPR) to herbivores1. These gene-for-gene interactions between insects and their hosts have been proposed for more than 50 years2. However, the molecular and cellular mechanisms that underlie HPR have been elusive, as the identity and sensing mechanisms of insect avirulence effectors have remained unknown. Here we identify an insect salivary protein perceived by a plant immune receptor. The BPH14-interacting salivary protein (BISP) from the brown planthopper (Nilaparvata lugens Stål) is secreted into rice (Oryza sativa) during feeding. In susceptible plants, BISP targets O. satvia RLCK185 (OsRLCK185; hereafter Os is used to denote O. satvia-related proteins or genes) to suppress basal defences. In resistant plants, the nucleotide-binding leucine-rich repeat receptor BPH14 directly binds BISP to activate HPR. Constitutive activation of Bph14-mediated immunity is detrimental to plant growth and productivity. The fine-tuning of Bph14-mediated HPR is achieved through direct binding of BISP and BPH14 to the selective autophagy cargo receptor OsNBR1, which delivers BISP to OsATG8 for degradation. Autophagy therefore controls BISP levels. In Bph14 plants, autophagy restores cellular homeostasis by downregulating HPR when feeding by brown planthoppers ceases. We identify an insect saliva protein sensed by a plant immune receptor and discover a three-way interaction system that offers opportunities for developing high-yield, insect-resistant crops.


Conflict of interest statement

The authors declare no competing interests.

Figures

Fig. 1
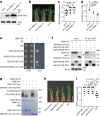
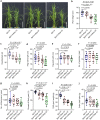
Fig. 1. The BPH salivary protein BISP interacts with BPH14 and is delivered into rice.
a, Phenotypes of rice plants carrying Bph14 and N14 after 7 days of BPH infestation. b, Weight gain and representative images of BPH insects feeding on Bph14 and N14 plants for 2 days (n = 20, biologically independent samples). The box limits indicate the 25th and 75th percentiles, the whiskers indicate the full range of the data and the centre line indicates the median. Individual data points are plotted. ce, BISP interacted with BPH14 in Y2H (c), co-IP (d) and BiFC (e) assays. N14 and BISP(125–241) served as negative controls. DDO, SD/-Leu-Trp; QDO, SD/-Leu-Trp-His-Ade. bZIP63–CFP, nuclear marker. f, Quantification of relative YFP intensities in BiFC assays. Data are the mean ± s.d. (n = numbers of biologically independent cells). g, Amino acid sequence of BISP. The asterisk indicates the stop codon. Glycine residues are marked in red. The 13-amino acid and 4-amino acid tandem repeats are underlined in blue and black, respectively. h,i, Immunohistochemical localization of BISP in female BPH salivary glands using pre-immune rabbit serum (h) or anti-BISP antibodies (i). Red fluorescence (Cy3) and blue fluorescence show the localization of BISP and DAPI-stained nuclei, respectively. j, BISP was delivered into rice leaf sheaths during BPH infestation. Leaf sheath proteins were analysed using anti-BISP antibodies. Ponceau S staining served as the loading control. k, Immunohistochemical staining showing BISP in BPH-infested rice leaf sheaths. The non-infected (middle) and BPH-infested (bottom) sheaths were detected by anti-BISP antibodies and pre-immune rabbit serum, respectively, served as negative controls. In b and f, P values were derived by one-way analysis of variance (ANOVA). Experiments (ae,hk) were repeated at least three times, each giving similar results. The results of the other two repeats are presented in Supplementary Fig. 2. Scale bars, 5 μm (e), 25 μm (k), 100 μm (h,i) or 10 cm (a). Source data
Fig. 2
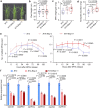
Fig. 2. BISP interacts with OsRLCK185 and suppresses rice defence responses.
a, Immunoblot detection of BISP in N14 and N14–Bisp transgenic rice lines. b,c, Phenotypes (b) and BPH resistance scores (c) of N14 and N14–Bisp plants after 4 days of BPH infestation. n = 36 plants examined over 3 independent experiments. d, Endogenous free SA levels in N14–Bisp and N14 plants. FW, fresh weight. Data are the mean ± s.d. (n = 3, biologically independent experiments). e, BISP interacted with OsRLCK185 and its kinase domain in a Y2H assay. OsRLCK185(1–85), OsRLCK185KD, OsRLCK185(354–491), OsRLCK185 deletion mutants; KD, kinase domain (amino acids 86–353); TDO, SD/-Leu-Trp-His with 1.5 mM 3-AT (3-amino-1,2,4-triazole). f, Co-IP showing the interaction between BISP and OsRLCK185. BISP(26–124) and OsRLCK159 served as negative controls. g, OsRLCK185 autophosphorylation activity was reduced by BISP. BISP(26–124)–GST–His proteins served as the negative control. Kinase activity was detected by autoradiography and input proteins shown after Coomassie Brilliant Blue staining (CBB). h,i, Phenotypes (h) and BPH-resistance scores (i) of Osrlck185 and WT plants after 4 days of BPH infestation. n = 45 plants examined over 3 independent experiments. In box plots in c and i, the box limits indicate the 25th and 75th percentiles, the whiskers indicate the full range of the data and the centre line indicates the median. Individual data points are plotted. In c,d and i, P values were derived by one-way ANOVA. The experiments (a,b,dh) were repeated at least three times, each giving similar results. Scale bars, 10 cm (b,h). Source data
Fig. 3
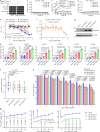
Fig. 3. BISP interacts with the BPH14 LRR domain and activates resistance signalling.
a,b, BISP interacted with the LRR domain of BPH14 in Y2H (a) and co-IP (b) assays. N14–LRR and BISP(125–241) served as negative controls. c, BISP(26–124) interacted with BPH14 and its LRR domain in a co-IP assay. N14–LRR served as a negative control. d, BLI analysis for binding kinetics between LRR (BPH14–LRR) and BISP. BLI response profile for BISP at different concentrations with sensor-immobilized LRR. Kd, equilibrium dissociation constant; Kon, association rate constant; Koff, dissociation rate constant. e, BLI analysis for competitive binding between BISP and BISP(26–124) with LRR. f, BISP increased the levels of BPH14 homomeric complex in a co-IP assay in rice protoplasts. BISP(125–241) and N14 served as negative controls. Numbers above the lanes indicate band intensity relative to co-precipitated BPH14–MYC, quantified using ImageJ. g, Co-expression of BPH14 and BISP increased WRKY72 levels. h,i, Protein (h) and relative transcript (i) levels of Wrky72 were increased in non-infested Bph14–Bisp lines compared with Bph14 and MH63 plants. j, Endogenous free SA levels in non-infested Bph14–Bisp and Bph14 plants. k,l, Phenotypes (k) and BPH-resistance scores (l) of Bph14–Bisp and Bph14 plants after BPH infestation for 14 days. n = 36 plants examined over 3 independent experiments. m, Weight gain of BPHs feeding on Bph14–Bisp and Bph14 plants for 48 h (n = 22, biologically independent samples). n,o, Photographs (n) and plant heights (o, n = 21 plants) of non-infested Bph14–Bisp and Bph14 plants at the 4-leaf stage. In box plots in l, m and o, the box limits indicate the 25th and 75th percentiles, the whiskers indicate the full range of the data and the centre line indicates the median. Individual data points are plotted. In g and h, numbers above/under the lanes indicate band intensity relative to actin (loading control) quantified using ImageJ. In h, i and j, data are the mean ± s.d. (n = 3, biologically independent experiments). In i, j, l, m and o, P values were derived by one-way ANOVA. Similar results were obtained from two (d,e) or three (ac,f–h,k,mo) independently replicated experiments. Scale bars, 10 cm (k,n). Source data
Fig. 4
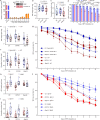
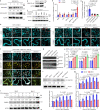
Fig. 4. BISP is degraded through OsNBR1-mediated autophagy.
a, Effects of BPH14 and N14 on BISP levels in rice protoplasts. b, Effects of the 26S proteasome inhibitor MG132 on BISP levels in rice protoplasts. c, Effects of autophagy inhibitors on BISP protein levels in rice protoplasts. 3-MA, 3-methyladenine; CQ, chloroquine; E-64d, aloxistatin; LQ, leupeptin. DMSO was the solvent for all inhibitors. d, Transmission electron microscopy images of autophagic structures in the phloem of non-infested Bph14–Bisp plants. Insets show enlarged autophagosome image at higher magnification. Red arrows indicate the location of double-membrane autophagosomes. CC, companion cell; SE, sieve element cell; V, vacuole. Scale bars, 500 nm. e, Quantification of double-membraned autophagosomes. P values were derived by one-way ANOVA. Data are the mean ± s.e.m. (n = 5, biologically independent experiments with every 8 cells as a biological replicate). f, Immunoblot detection of BISP, OsATG8 and OsNBR1 in Bph14 and MH63 plants. g, Y2H assay of the interactions between BISP, BPH14, OsNBR1 and four OsATG8 proteins. h, Co-IP assays of interactions between OsNBR1 and BISP or BPH14 in rice protoplasts. i, Co-IP assay of interactions between OsNBR1 and four OsATG8 proteins in rice protoplasts. The OsNBR1 mutant N1 served as a negative control. j, Effects of OsNBR1 and BPH14 on BISP levels in rice protoplasts. N14 and N1 served as negative controls. k, BPH14 enhanced interactions between OsNBR1 and BISP in rice protoplasts. N14 served as a negative control. Numbers under the lanes indicate band intensity relative to co-precipitated OsNBR1–MYC, quantified using ImageJ. l, Immunoblot detection of BISP in protoplasts of MH63, Bph14 and OsNBR1 knockout (Osnbr1) plants. m, Immunoblot detection of BISP in MH63, Bph14 and Osnbr1 plants after BPH infestation. Numbers under the lanes (ac,f,j,l,m) indicate protein abundance relative to that of actin (loading control), quantified using ImageJ. Experiments (ad,fm) were repeated three times and gave similar results. Source data
Fig. 5
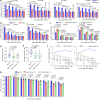
Fig. 5. BPH14-mediated BISP degradation contributes to the termination of BPH14 activation.
a, Immunoblot detection of BISP, OsATG8, OsNBR1, and WRKY72 in Bph14 and MH63 plants after cessation of BPH feeding. b, Relative Wrky72 transcript levels in Bph14 and MH63 plants after cessation of BPH feeding. c, Co-IP detection of levels of BPH14 homomeric complex formation. N1 served as a negative control. Numbers above the lanes indicate band intensity relative to co-precipitated BPH14–MYC, quantified using ImageJ. d, Immunoblot detection of BISP and WRKY72 in Bph14 and Bph14–Osnbr1 plants after cessation of BPH feeding. e, Relative Wrky72 transcript levels in Bph14 and Bph14–Osnbr1 plants after cessation of BPH feeding. f,g, Photographs (f) and resistance scores (g) of Bph14 and Bph14–Osnbr1 plants after 14 days of BPH infestation. Scale bar, 10 cm. The box limits indicate the 25th and 75th percentiles, the whiskers indicate the full range of the data and the centre line indicates the median. Individual data points are plotted (n = 42 plants examined over 3 independent experiments). h, A working model for BISP-induced immunity regulation. In BPH-susceptible rice, BISP interacts with OsRLCK185 and suppresses its phosphorylation activity, thereby inhibiting basal defence and promoting BPH feeding. In rice carrying the BPH resistance gene Bph14, BISP binds directly to the LRR domain of BPH14 and activates HPR. Continuous activation of HPR is detrimental to plant growth and reproduction. Therefore, following activation of BPH14-mediated immunity, BISP–BPH14 binds to OsNBR1, which mediates the autophagic degradation of BISP. The degradation of BISP leads to the termination of BPH14-mediated immunity, which restores cellular homeostasis and prevents the fitness costs associated with prolonged activation of BPH14-mediated immunity. The timing of dissociation of the BISP–BPH14 complex after association with OsNBR1 and the fate of BPH14 are yet to be determined. Numbers under lanes (a,d) indicate protein abundance relative to that of actin (loading control, a,c,d), quantified using ImageJ. In b, c, e and g, P values were derived by one-way ANOVA. In b and e, data are the mean ± s.d. (n = 3, biologically independent experiments). Experiments (a,c,d,f) were repeated three times, each giving similar results. PRRs, pattern recognition receptors. Source data
Extended Data Fig. 1
Extended Data Fig. 1. Host-plant resistance evaluation, BISP subcellular localization in rice protoplasts, Bisp gene and BISP protein expression profile in BPH, and BISP delivery into rice leaf sheath.
a, BPH-resistance scores of Bph14 and N14 plants after BPH infestation. Bph14 and N14 plants express the resistant NLR (BPH14) and the susceptible allele variant (N14), respectively. Lower scores indicate higher resistance to the insects. Data were collected 7 days after BPH infestation (n = 36 plants examined over 3 independent experiments). P values were derived by one-way ANOVA. b, Honeydew excretion of BPHs fed on Bph14 and N14 plants for 2 days. P values were derived by one-way ANOVA (n = 20, biologically independent plants). c, BISP-GFP had a nucleocytoplasmic localization in rice protoplasts. bZIP63-RFP was used as a nuclear marker. The confocal images were taken 14–20 h after transformation. Scale bar, 5 μm. d, Immunoblot detection of full-length BISP-GFP expression in rice protoplasts. BISP-GFP was detected by anti-GFP antibody. e, Immunoblot detection of the expressed proteins in BiFC assays. BISP-YN, BISP125–241-YN(BISP(125–241)-YN), and BPH14-YC or N14-YC were co-expressed in rice protoplasts and the total proteins were detected using anti-Myc, anti-HA or anti-ACTIN antibody. f, Relative levels of Bisp RNA in different BPH tissues. SG, salivary glands; FB, fat body. Data are mean ± s.d. (n = 3, biologically independent experiments). g, Relative level of Bisp RNAs during different developmental stages. 1st to 5th, are first to fifth instars; Female and Male are adults. Data are mean ± s.d. (n = 3, biologically independent experiments). h, (Upper) Determination of the anti-BISP specificity using purified BISP-GST-His. The purified BISP-GST-His protein was serially diluted and detected by anti-BISP or anti-His antisera. (Bottom) Correlation between the anti-BISP labeled signal and anti-His labeled signals. The densities of anti-BISP and anti-His labeled signals were quantified using ImageJ with the undiluted sample set as 1. i, (Upper) Determination of the anti-BISP specificity using a dilution series of total mixed adults BPH proteins. BISP was detected using the anti-BISP antiserum. Ponceau staining (Ponceau S) is a loading control. (Bottom) Correlation between the anti-BISP labeled and Ponceau S signals. The density of anti-BISP labeled and Ponceau S signals were quantified using ImageJ with the undiluted sample set as 1. j,k, Immunohistochemical localization of BISP in male BPH salivary glands. Anti-BISP (j) or pre-immune rabbit serum (k) was used as the primary antiserum. Red fluorescence (Cy3) shows the localization of BISP and blue fluorescence shows the location of DAPI-stained nuclei. Scale bars, 100 μm. l,m, Immunohistochemical localization of BISP in mixed adults BPH guts. Anti-BISP (l) or pre-immune rabbit serum (m) was used as the primary antiserum. Red fluorescence (Cy3) shows the localization of BISP and blue fluorescence shows the location of DAPI-stained nuclei. Scale bars, 100 μm. n,o, Immunohistochemical localization of NlSP1 in female BPH salivary glands. Either anti-NlSP1 (n) or pre-immune rabbit serum (o) was used as the primary antiserum. Red fluorescence (Cy3) shows the localization of NlSP1 and blue fluorescence shows the location of DAPI-stained nuclei. Scale bars, 100 μm. p, Quantification of Cy3 intensities. The Cy3 fluorescence in samples using anti-BISP, anti-NlSP1 and pre-immune serum was normalized relative to DAPI fluorescence (blue) intensity. P values were derived by one-way ANOVA. Data are mean ± s.d. (n = 5, biologically independent experiments). q-t, Immunogold electron microscopy analysis of the distribution of BISP in the rice leaf sheaths during BPH feeding. q,s, TEM image of the BPH salivary sheaths in the rice phloem tissue. Either anti-BISP (q) or pre-immune rabbit serum (s) was used as the primary antiserum. Scale bars, 20 μm. r,t, TEM image of the boxed area in (q) and (s). Red arrows indicate the anti-BISP-labeled immunogold particles (dark spots). Scale bars, 200 nm. SH, salivary sheaths; P, phloem cells. In box plots in a,b, the box limits indicate the 25th and 75th percentiles, the whiskers indicate the full range of the data, and the center line indicates the median. Individual data points are plotted. Experiments were independently repeated two (qt) or three (be, ho) times, each giving similar results. Source data
Extended Data Fig. 2
Extended Data Fig. 2. BISP played crucial roles in the feeding and performance of BPH on rice plants.
a, Effects of dsRNA injection on Bisp transcript levels in BPHs. Bisp-Ri (Bisp-RNAi) insects were assayed daily for 10 days. GFP-Ri (GFP-RNAi) and CK insects were assayed on day 3. Data are mean ± s.d. (n = 3, biologically independent experiments). The inset shows a representative immunoblot demonstrating the relative abundance of BISP in GFP-Ri BPHs and Bisp-Ri BPHs at 3 days after injection. Total BPH proteins were extracted from injected or control insects and immunoblotted. BISP was detected with anti-BISP antibodies and Ponceau S staining was used as the loading control. b,c,d, Weight gain (b), honeydew excretion (c) and survival rates (d) of dsRNA-injected and non-injected BPHs fed on N14 plants. e,f,g, Weight gain (e), honeydew excretion (f) and survival rates (g) of dsRNA-injected and non-injected BPHs fed on the Osrlck185-1 (Osrlck185-1) and WT plants. h,i,j, Weight gain (h), honeydew excretion (i) and survival rates (j) of dsRNA-injected BPHs fed on the Bph14 and MH63 plants. In aj, BPHs were microinjected with Bisp dsRNA (Bisp-Ri) or GFP dsRNA (GFP-Ri) and non-injected BPHs (CK) served as a control. For bj, P values were derived by one-way ANOVA. In b,c,e,f,h,i, data are mean ± s.d. (n = 20, biologically independent plants); in d,g,j, data are mean ± s.e.m. (n = 5, biologically independent experiments). In box plots in b,c,e,f,h,i, the box limits indicate the 25th and 75th percentiles, the whiskers indicate the full range of the data, and the center line indicates the median. Individual data points are plotted. In ej, different letters indicate significant differences (P < 0.05, one-way ANOVA); exact P values are provided in Supplementary Table 4. All the experiments were repeated three times, each giving similar results. Source data
Extended Data Fig. 3
Extended Data Fig. 3. Effects of Bisp on BPH resistance in N14-Bisp transgenic lines.
a, Photographs of the independent N14-Bisp homozygous T2 transgenic lines (N14-Bisp-3 and N14-Bisp-11) and N14 plants at the 3-leaf stage without BPH feeding. Scale bar, 10 cm. b, Plant height of N14-Bisp lines and N14 at the 3-leaf stage. P values were derived by one-way ANOVA (n = 30, biologically independent samples). c, d, Weight gain (c) and honeydew excretion (d) of BPHs reared on the N14-Bisp transgenic and N14 plants for 2 d. P values were derived by one-way ANOVA (n = 10, biologically independent samples). e, Results of the two-host choice assay examining the settling of BPHs on the N14-Bisp transgenic and N14 plants. P values were derived by one-way ANOVA. Data are means ± s.d. (for N14-3 and N14-Bisp-11, n = 7 and 10, respectively, biologically independent experiments). f, Transcript levels analysis of SA biosynthesis- and signaling-related genes OsICS1 and OsNPR1 and defense-related genes OsPR1a, OsPR1b, OsPR5 and OsPR10 in two N14-Bisp transgenic lines and N14 plants. P values were derived by one-way ANOVA. Data are mean ± s.d. (n = 3, biologically independent experiments). In box plots in b, c, d, the box limits indicate the 25th and 75th percentiles, the whiskers indicate the full range of the data, and the center line indicates the median. Individual data points are plotted. All the experiments were repeated three times, each giving similar results. Source data
Extended Data Fig. 4
Extended Data Fig. 4. Identification of OsRLCK185 and its role in plant defense.
a, Y2H screen for BISP-interacting kinases. Yeast strain AH109 was co-transformed with the indicated constructs and grown on DDO (SD/-Leu-Trp) and TDO (SD/-Leu-Trp-His) selective medium containing 1.5 mM 3-amino-1,2,4-triazole (3-AT). b, Immunoblot detection of proteins expressed in yeast using anti-HA and anti-Myc (anti-MYC) antibodies, respectively. Ponceau S staining was used as the loading control. Asterisks indicate specific bands detected by immunoblotting analysis. c, Structure of OsRLCK185. The orange box indicates the kinase domain. d, BISP but not BISP26–124 (BISP(26–124)) reduced OsRLCK185 autophosphorylation activity at Ser and Thr residues in vitro. OsRLCK185 proteins were immunoblotted and phosphorylated OsRLCK185 was detected with anti-phosphoserine/ phosphothreonine antibodies. The input proteins were immunoblotted and detected with anti-His antibodies. e, Verification of three independent OsRLCK185 knockout lines (Osrlck185Osrlck185-1, −2, and −3) by PCR-based sequencing. f,g, Weight gain (f) and honeydew excretion (g) of BPHs on three Osrlck185 lines and WT plants for 2 d. P values were derived by one-way ANOVA (n = 30, biologically independent samples). In box plots, the box limits indicate the 25th and 75th percentiles, the whiskers indicate the full range of the data, and the centre line indicates the median. Individual data points are plotted. Experiments were repeated three times (a,b,d,f,g) or two times (e), each giving similar results. Source data
Extended Data Fig. 5
Extended Data Fig. 5. BISP triggered Bph14-mediated BPH resistance in Bph14 plants.
a, Y2H assays between the full-length BPH14, the BPH14 LRR domain (LRR) and the N14 LRR domain (N14-LRR) and the BISP deletion mutants BISP26–124 (BISP(26–124)) and BISP125–241(BISP(125–241)). DDO, SD/-Leu-Trp; TDO, SD/-Leu-Trp-His with 2.5 mM 3-AT. b, Biolayer interferometry (BLI) determination of the binding kinetics between N14-LRR and BISP. BLI response profile of BISP at different concentrations with the sensor-immobilized N14-LRR. c, BLI analysis for the binding kinetics between the BPH14 LRR and BISP26–124. BLI response profile of BISP26–124 at different concentrations with the sensor-immobilized LRR. Kd, equilibrium dissociation constant; Kon, association rate constant; Koff, dissociation rate constant. d, BLI analysis for the binding kinetics between the BPH14 LRR and BISP125–241. BLI response profile of BISP125–241 at different concentrations with the sensor-immobilized LRR. e, MST analysis of binding affinity between fluorescently labeled LRR, N14-LRR and BISP, BISP26–124 and BISP125–241. The Kd values show the binding between LRR and BISP, BISP26–124. ΔFnorm is the normalized fluorescence minus the relative fluorescence of the unbound state. Data are mean ± s.d. (n = 3, biologically independent experiments). f, MST analysis of the competitive binding between BISP and BISP26–124 with LRR. ΔFnorm is the normalized fluorescence minus the relative fluorescence of the unbound state. Data are mean ± s.d. (n = 3, biologically independent experiments). g, BISP protein levels in the independent Bph14-Bisp homozygous T2 transgenic lines and Bph14 control plants. Total proteins were immunoblotted and detected with anti-Myc and anti-ACTIN antibodies, respectively. h, Relative transcript levels of Bph14-activated SA biosynthesis- and signaling-related genes OsICS1 and OsNPR1, and defense-related genes OsPR1a, OsPR1b, OsPR5 and OsPR10 in the Bph14-Bisp transgenic lines and WT Bph14 plants. P values were derived by one-way ANOVA. Data are mean ± s.d. (n = 3, biologically independent experiments). i, Honeydew excretion by BPHs reared on the Bph14-Bisp transgenic lines and WT Bph14 plants for 48 h. P values were derived by one-way ANOVA (n = 20, biologically independent plants). In box plots, the box limits indicate the 25th and 75th percentiles, the whiskers indicate the full range of the data, and the center line indicates the median. Individual data points are plotted. j, Survival rate of BPHs feeding on the Bph14-Bisp transgenic lines and WT Bph14 plants for 9 days. P values were derived by one-way ANOVA. Data are mean ± s.e.m. (n = 5, biologically independent experiments). k, Two-host choice test of BPHs on the Bph14-Bisp transgenic plants and WT Bph14 plants. P values were derived by one-way ANOVA. Data are mean ± s.e.m. (n = 8, biologically independent experiments). All the experiments were repeated two (bd) or three (a,g,ik) times, each giving similar results. Source data
Extended Data Fig. 6
Extended Data Fig. 6. Agronomic traits of the Bph14-Bisp transgenic lines and WT Bph14 plants.
a, Phenotypes of the Bph14-Bisp transgenic lines and Bph14 plants at the heading stage. Scale bar, 30 cm. b, c, Plant height (b) and heading date (c) of the Bph14-Bisp transgenic lines and Bph14 plants at the heading stage. P values were derived by one-way ANOVA. For b, n = 18, biologically independent samples. For c, n = 30, biologically independent samples. dj, Agronomic traits of the Bph14-Bisp transgenic lines and WT Bph14 plants at the mature stage. (d), Flag leaf length. (e), Flag leaf width. (f), The number of panicles per plant. (g), The number of filled grains per plant. (h), Percentage of filled grains. (i), 1,000-grain weight. (j), Grain yield per plant. One-way ANOVA (n = 18, biologically independent samples). In box plots in bj, the box limits indicate the 25th and 75th percentiles, the whiskers indicate the full range of the data, and the center line indicates the median. Individual data points are plotted. Source data
Extended Data Fig. 7
Extended Data Fig. 7. The autophagic degradation of BISP was promoted by BPH14.
a, Dosage effect of BPH14 on BISP levels in rice protoplasts. BISP-MYC was expressed with or without BPH14-MYC in rice protoplasts. Total proteins were immunoblotted and detected with anti-Myc and anti-ACTIN antibodies, respectively. b, Immunoblots showing that proteasome degradation of WRKY72-HA was blocked by MG132 treatment. Total protoplast proteins were immunoblotted and detected with anti-HA and anti-ACTIN antibodies, respectively. c, Immunoblots showing that the autophagy degradation of Hd1-HA was blocked by treatments with autophagy inhibitors. Total protoplast proteins were immunoblotted and detected with anti-HA and anti-ACTIN antibodies, respectively. d, (Upper) Confocal images of CFP-ATG8f-labeled autophagic puncta structures in the absence (left row) or presence (right row) of ConA. Autophagosomes in cells co-expressing CFP-ATG8f with BISP, N14, or BPH14 (individually) and CFP-ATG8f and BISP with N14 or BPH14 after agroinfiltration of N. benthamiana leaves are displayed. Red arrows indicate CFP-ATG8f-labeled autophagic puncta. (Bottom) Insets show enlarged autophagosome image at higher magnification. Scale bars, 25 μm. e, Average number of CFP-NbATG8-labeled autophagic puncta in the presence or absence ConA. P values were derived by one-way ANOVA. Data are mean ± s.d. (n = 6, biologically independent experiments). f,g,h, Silencing of NbATG6, NbPI3K or NbATG7 suppressed the production of CFP-ATG8f-labeled autophagic puncta. (f), Confocal images of CFP-ATG8f-labeled autophagic puncta structures co-localized with BISP-YFP. CFP-ATG8f, BISP-YFP and BPH14 were transiently co-expressed in the silenced leaves (VIGS-NbATG6, VIGS-NbPI3K and VIGS-NbATG7) or the non-silenced control leaves (VIGS-EV). Red arrows indicate CFP-ATG8f-labeled autophagic puncta co-localized with BISP-YFP. (Bottom) Insets show enlarged autophagosome image at higher magnification. Scale bars, 25 μm. (g), The transcript levels of NbATG6, NbPI3K and NbATG7 by semi-quantitative RT-PCR. The transcript levels of NbACTB were used as a loading control. (h), Average number of CFP-NbATG8-labeled autophagic puncta in the silenced and control leaves. P values were derived by one-way ANOVA. Data are mean ± s.d. (n = 6, biologically independent experiments). i, Immunoblot detection of OsATG8 in the non-infested Bph14-Bisp transgenic lines, Bph14 and MH63 plants. Total proteins were immunoblotted and detected with anti-AtATG8A and anti-ACTIN antibodies, respectively. j, Relative transcript levels of OsATG8s (OsATG8a, OsATG8b, OsATG8c) in the non-infested Bph14-Bisp transgenic lines, Bph14 and MH63 plants. P values were derived by one-way ANOVA. Data are mean ± s.d. (n = 3, biologically independent experiments). k, Relative transcript levels of OsATG8s (OsATG8a, OsATG8b, OsATG8c) in Bph14 and MH63 plants after BPH feeding for different durations. P values were derived by one-way ANOVA. Data are mean ± s.d. (n = 3, biologically independent experiments). l, Immunoblot detection of OsATG8 and OsNBR1 in the non-infested and BPH-infested MH63 and Bph14 plants in the absence or presence of ConA treatment. Leaf sheaths total proteins were immunoblotted and detected with anti-AtATG8A, anti-AtNBR1 and anti-ACTIN antibodies, respectively. Numbers under the lanes (a,c,i,l) indicate protein abundance relative to that of ACTIN, quantified by ImageJ. Experiments (ad,f,g,i,l) were repeated three times, each giving similar results. Source data
Extended Data Fig. 8
Extended Data Fig. 8. OsNBR1 played a role in the autophagic degradation of BISP by BPH14.
a, Immunoblot detection of proteins expressed in yeast using anti-HA and anti-Myc antibodies, respectively. Ponceau S staining was used as the loading control. Asterisks indicate specific bands detected by immunoblotting analysis. b, Confocal images of CFP-NbATG8f-labeled autophagic puncta structures in the absence (left) or presence (right) of ConA. The photos showing cells co-expressing CFP-NbATG8f and BISP with N14 and OsNBR1, BPH14, BPH14 and OsNBR1, or BPH14 and OsNBR1 mutant N1 after agroinfiltration of N. benthamiana leaves. Red arrows indicate CFP-NbATG8f-labeled autophagic puncta. (Bottom Row) Insets show enlarged autophagosome image at higher magnification. EV, Empty Vector. Scale bars, 25 μm. c, Average number of CFP-NbATG8-labeled autophagic puncta in the absence or presence of ConA. Data are mean ± s.d. (n = 10, biologically independent samples). Different letters indicate significant differences (P < 0.05, one-way ANOVA); exact P values are provided in Supplementary Table 4. d, Immunoblot detection of OsNBR1 levels in the non-infested Bph14-Bisp transgenic lines, Bph14 and MH63 plants. Total proteins were immunoblotted and detected with anti-AtNBR1 and anti-ACTIN antibodies, respectively. Numbers under the lanes indicate protein abundance relative to that of ACTIN, quantified by ImageJ. e, Relative OsNBR1 transcript levels in the non-infested Bph14-Bisp transgenic lines, Bph14 and MH63 plants. P values were derived by one-way ANOVA. Data are means ± s.d. (n = 3, biologically independent experiments). f, Relative OsNBR1 transcript levels in Bph14 and MH63 plants after BPH infestation. P values were derived by one-way ANOVA. Data are mean ± s.d. (n = 3, biologically independent experiments). Experiments (a,b,d) were repeated at least three times, each giving similar results. Source data
Extended Data Fig. 9
Extended Data Fig. 9. The PB1 domain, UBA domain and LIR motif of OsNBR1 played essential roles in BPH14-promoted autophagic degradation of BISP.
a, Y2H assay of the interactions between OsNBR1 and the CC, NB, and LRR domains of BPH14. DDO, SD/-Leu-Trp; TDO, SD/-Leu-Trp-His with 1 mM 3-AT. b, Co-IP assay of the interactions between OsNBR1 and the CC, NB, and LRR domains of BPH14 in rice protoplasts. OsNBR1-MYC and CC-HA, NB-HA or LRR-HA were co-expressed in rice protoplasts, and used in the co-IP assay with anti-Myc agarose; the input and immunoprecipitated proteins were detected with anti-HA, anti-Myc or anti-ACTIN antibodies. c, Schematic illustration of OsNBR1 and the N1-N7 mutant constructs used in this study. d, OsNBR1 mutants were unable to degrade BISP in rice protoplasts. BISP-MYC was co-expressed with BPH14-MYC and the full-length OsNBR1 (FL-HA) or its HA-tagged mutants (N1-N7-HA) in rice protoplasts. The levels of BISP-MYC protein were detected with anti-Myc antibody. eh, Co-IP assays of the interactions between the OsNBR1 mutants and BISP (e), BPH14 (f), OsATG8c (g) and OsNBR1 (h) in rice protoplasts. BISP-MYC, BPH14-MYC, MYC- OsATG8c, or OsNBR1-MYC was co-expressed with OsNBR1(FL-HA) and its HA-tagged mutants (N1-N7-HA) in rice protoplasts. Proteins interacting with OsNBR1-HA or its mutants were identified in a co-IP assay with anti-MYC agarose; the input and immunoprecipitated proteins were detected with anti-HA, anti-Myc or anti-ACTIN antibodies. i, Summary of interactions between the OsNBR1 mutants and BISP, BPH14, OsATG8c, and OsNBR1, respectively. j, Verification of the mutations in the independent homozygous OsNBR1 knockout (Bph14-Osnbr1Osnbr1) lines (Bph14-Osnbr1-1 and Bph14-Osnbr1-2) by PCR-based sequencing. k, Immunoblot detection of OsNBR1 proteins in Bph14 and two OsNBR1 knockout lines (Bph14-Osnbr1-1 and Bph14-Osnbr1-2). Total proteins were immunoblotted and detected with anti-AtNBR1 and anti-ACTIN antibodies, respectively. In c-i, FL, full-length of OsNBR1. N1-N7, the seven OsNBR1 mutants. Experiments were repeated three times (a,b,dh,k) or two times (j) with similar results.
Extended Data Fig. 10
Extended Data Fig. 10. Effects of BPH infestation cessation in BPH14 activation and termination and the role OsNBR1 played in BPH resistance.
a, Relative transcript levels of OsATG8s and OsNBR1 in Bph14 and MH63 plants upon the cessation of BPH feeding. b, Relative transcript levels of Bph14-mediated resistance signaling genes, OsICS1 and OsNPR1, in Bph14 and MH63 plants upon the cessation of BPH feeding. c, Relative transcript levels of Bph14-mediated resistance signaling genes, OsICS1 and OsNPR1, in the Bph14-Osnbr1 (Bph14-Osnbr1) lines (Bph14-Osnbr1-1 and Bph14-Osnbr1-2) and Bph14 plants upon the cessation of BPH feeding. d, BPH weight gain on the Bph14-Osnbr1 lines (Bph14-Osnbr1-1 and Bph14-Osnbr1-2) and Bph14 plants after 48 h of feeding. e, Honeydew excretion by BPHs reared on the Bph14-Osnbr1 lines and Bph14 plants after 48 h of feeding. f, Two-host choice test of BPHs feeding on the Bph14-Osnbr1 lines and Bph14 plants. g, Survival rates of BPHs feeding on the Bph14-Osnbr1 lines and Bph14 plants for 8 days. In a,b,c, P values were derived by one-way ANOVA. Data are mean ± s.d. (n = 3, biologically independent experiments). In d,e, P values were derived by one-way ANOVA (n = 18, biologically independent samples). In f,g,P values were derived by one-way ANOVA. Data are mean ± s.e.m. (n = 10, biologically independent samples). In box plots in d,e, the box limits indicate the 25th and 75th percentiles, the whiskers indicate the full range of the data, and the center line indicates the median. Individual data points are plotted. Source data

Similar articles

Cited by

References

    1. Kaloshian I, Walling L. Hemipteran and dipteran pests: effectors and plant host immune regulators. J. Integr. Plant Biol. 2016;58:350–361. - PubMed
    1. Hatchett JH, Gallun RL. Genetics of the ability of the Hessian fly, Mayetiola destructor, to survive on wheats having different genes for resistance. Ann. Entomol. Soc. Am. 1970;63:1400–1407.
    1. Oerke EC. Crop losses to pests. J. Agric. Sci. 2006;144:31–43.
    1. Jiang Y, Zhang C, Chen R, He S. Challenging battles of plants with phloem-feeding insects and prokaryotic pathogens. Proc. Natl Acad. Sci. USA. 2019;116:23390–23397. - PMC - PubMed
    1. Shangguan X, et al. A mucin-like protein of planthopper is required for feeding and induces immunity response in plants. Plant Physiol. 2018;176:552–565. - PMC - PubMed