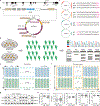
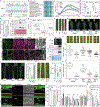
. 2023 Jun;618(7967):1017-1023.
doi: 10.1038/s41586-023-06205-2. Epub 2023 Jun 14.

Genome editing of a rice CDP-DAG synthase confers multipathogen resistance

Affiliations

Genome editing of a rice CDP-DAG synthase confers multipathogen resistance

Gan Sha et al. Nature. 2023 Jun.

Abstract

The discovery and application of genome editing introduced a new era of plant breeding by giving researchers efficient tools for the precise engineering of crop genomes1. Here we demonstrate the power of genome editing for engineering broad-spectrum disease resistance in rice (Oryza sativa). We first isolated a lesion mimic mutant (LMM) from a mutagenized rice population. We then demonstrated that a 29-base-pair deletion in a gene we named RESISTANCE TO BLAST1 (RBL1) caused broad-spectrum disease resistance and showed that this mutation caused an approximately 20-fold reduction in yield. RBL1 encodes a cytidine diphosphate diacylglycerol synthase that is required for phospholipid biosynthesis2. Mutation of RBL1 results in reduced levels of phosphatidylinositol and its derivative phosphatidylinositol 4,5-bisphosphate (PtdIns(4,5)P2). In rice, PtdIns(4,5)P2 is enriched in cellular structures that are specifically associated with effector secretion and fungal infection, suggesting that it has a role as a disease-susceptibility factor3. By using targeted genome editing, we obtained an allele of RBL1, named RBL1Δ12, which confers broad-spectrum disease resistance but does not decrease yield in a model rice variety, as assessed in small-scale field trials. Our study has demonstrated the benefits of editing an LMM gene, a strategy relevant to diverse LMM genes and crops.


Conflict of interest statement

Competing interests G.L., G.S. and X.H. are coinventors on a provisional patent application no. 202111041400.3 filed by Huazhong Agricultural University entitled ‘The OsRBL1 truncated protein and its application in balancing disease resistance and yield in rice’ that covers rbl1 and rbl1Δ12 lines. The remaining authors declare no competing interests.

Figures

Extended Data Fig. 1 |
Extended Data Fig. 1 |. The plant glycerolipid metabolic pathway related to cytidinediphosphate-diacylglycerol synthase 1 (CDS1).
Rice RBL1 is homologous to yeast Cds1. CDP-DAG, cytidinediphosphate-diacylglycerol; DAG, diacylglycerol; PA, phosphatidic acid; PAH, phosphatidic acid phosphohydrolase; PC, phosphatidylcholine; PE, phosphatidylethanolamine; PG, phosphatidylglycerol; PGPS, phosphatidylglycerol phosphate synthase; PI, phosphatidylinositol; PI4K, phosphatidylinositol 4-kinases; PI4P, phosphatidylinositol 4-phosphate; PI4P5K, phosphatidylinositol 4-phosphate 5-kinase; PI(4,5)P2, phosphatidylinositol-4,5-bisphosphate; PIS, phosphatidylinositol synthase; PS, phosphatidylserine; PSS, phosphatidylserine synthase.
Extended Data Fig. 2 |
Extended Data Fig. 2 |. Expression of plant defense-related genes, yield, and genetic complementation of the rbl1 line.
a, Panicles and seeds of the rbl1 and WT lines. Bars, 1 cm. Grain yield of the rbl1 and WT lines. Data are displayed as box and whisker plots with individual data points. The box plot elements are: center line, median; box limits, 25th and 75th percentiles. b, In situ detection of reactive oxygen species (ROS) in the rbl1 mutant and wild-type (WT, KitaakeX) leaves using 3,3′-diaminobenzidine (DAB) staining. Bar, 1 cm. c, Total salicylic acid (SA) levels are increased in the rbl1 mutant. Total SA was isolated from leaves of 2-week-old seedlings. d, qRT-PCR assays of genes that serve as markers of the plant immune response. Total RNA was extracted from leaves of 4-week-old plants. The Actin gene was used as the internal control. e, A 29 nucleotide deletion cosegregates with a lesion mimic phenotype in the M3 population derived from line rbl1. PCR results of InDel markers targeting the 29 nucleotide deletion: one short band, homozygous; one large band, wild-type alleles; two bands, heterozygous. “+” indicates lesions on the leaf of the M3 plant and “−” no lesion. A χ2 test of the phenotypic ratio revealed that the actual value 26: 92 of lesioned plants to normal plants is statistically similar to the expected value 1: 3 (χ2 = 0.213, P-value = 0.644 > 0.05). Similar results were obtained from three independent experiments. f, Complementation assays. Genotyping of the T0 lines using Cleaved Amplified Polymorphic Sequences (CAPS) markers. Leaves were photographed at 21 days post sowing (dps). For results of agarose gel electrophoresis, one band indicates the rbl1 mutant and three bands indicate the complemented line. Bar, 1 cm. Similar results were obtained from three independent experiments. g, qRT-PCR assays of RBL1 in the WT, rbl1, and complementation lines. Complementation line 10 was used as CoR1 in Fig. 1. The Actin gene was used as the internal control. Data are mean ± s.e.m, n = number of biologically independent samples in the graphs. Asterisks indicate significant differences compared to the WT using the two-tailed Student’s t-test (*P < 0.05, **P < 0.01, ***P < 0.001, ****P < 0.0001). For exact P values, see.
Extended Data Fig. 3 |
Extended Data Fig. 3 |. Expression assays of RBL1.
a, qRT-PCR assays of RBL1 in different tissues of the wild-type (WT, Kitaake) plants at the flowering stage. b, qRT-PCR assays of RBL1 in response to spray inoculation of M. oryzae strain ZB25 on Kitaake seedlings. c, Tissue-specific expression of RBL1 visualized by staining for the β-glucuronidase (GUS) reporter activity under control of the RBL1 promoter. For numbers: 1, seedling; 2 and 3, root; 4, stem; 5, shoot apical mristem; 6, leaf; 7, stamen; 8, pistil; 9, premilk stage; 10, panicle; 11, maturity stage. Bars in 1, 4, and 7, 5 mm; bars in 2, 3, 5, 6, and 8 to 11, 1 mm. Data are mean ± s.e.m, n = number of biologically independent samples in the graphs. Significant differences indicated by different letters were calculated using the Duncan’s new multiple range test.
Extended Data Fig. 4 |
Extended Data Fig. 4 |. Arabidopsis thaliana cds mutants show enhanced resistance to Phytophthora capsica.
a, Phylogenetic analysis of RBL1 homologs from plants and other organisms. The phylogenetic tree was constructed using MEGA10. Accession numbers for different RBL1 homologs: Arabidopsis thaliana (NP_176433.2), Beta vulgaris subsp. vulgaris (XP_010694835.1), Brachypodium distachyon (XP_003564318.1), Brassica rapa (RID78417.1), Chenopodium quinoa (XP_021731901.1), Chlamydomonas reinhardtii (PNW85433.1), Glycine max (XP_003556374.1), Gossypium barbadense (KAB2026876.1), Homo sapiens (NP_001254.2), Hordeum vulgare (KAE8818711.1), Mus musculus (NP_775546.2), Oryza sativa (NC_029256.1), Saccharomyces cerevisiae (AJQ02739.1), Schizosaccharomyces pombe (NP_596416.1), Sorghum bicolor (KAG0539475.1), Triticum aestivum (KAF7023922.1), and Zea mays (NP_001132909.1). b, Protein domain analysis of RBL1 homologs from various organisms. Conserved protein domains in RBL1 homologs were predicted using SMART and visualized using iTOL. CTP_transf_1, phosphatide cytidylyltransferase. c, Amino acid alignment of the 19 residues that are truncated in the rbl1 line. The consensus is shown at the bottom. d, The cds mutant and wild-type (WT, Col-0, A. thaliana) plants at 28 days post sowing (dps). Bar, 1 cm. e, qRT-PCR assays. Total RNA was extracted from leaves of 4-week-old plants. f, Leaf length of the WT and cds mutant lines at 28 dps. gi, Infected leaves (g), lesion area (h), and relative quantification of pathogen biomass (i) of WT and cds lines 36 h after inoculation (hpi) with Phytophthora capsica strain LT263. Bar, 1 cm. Data are mean ± s.e.m, n = number of biologically independent samples in the graphs. The box plot elements are: center line, median; box limits, 25th and 75th percentiles. Significant differences indicated by different letters were calculated using the Duncan’s new multiple range test.
Extended Data Fig. 5 |
Extended Data Fig. 5 |. Exogenous supplementation of PI delays lesion formation in rbl1.
a, Lesion formation was suppressed in the rbl1 but not cul3a or spl-D mutants. Plants were grown on 1/2 MS media supplemented with PI. WT, the wild-type Kitaake. Photographs were taken from 12-day-old rbl1, 2-week-old clu3a, and 2-week-old spl-D plants with corresponding control lines. Bar, 1 cm. b, Lesion formation in the rbl1 mutant was not affected by application of exogenous PG. Plants were grown on the 1/2 MS media supplemented with PG. Photographs were taken from 12-day-old plants. Bar, 1 cm. c, Lesion formation in the rbl1 mutant was enhanced with exogenous application of PI(4,5)P2. Plants were grown on the 1/2 MS media supplemented with PI(4,5)P2. Photographs were taken from 10-day-old plants. Bar, 1 cm. d, Exogenous PA enhances lesion formation in rbl1 and leaf tip necrosis in WT. Bar, 1 cm. e, Lesion formation in rbl1 was suppressed by exogenous diphenyleneiodonium chloride (DPI). Plants were grown on 1/2 MS media supplemented with DPI. Photographs were taken of 10-day-old plants. Bar, 1 cm. Data are mean ± s.e.m, n = number of independent replicates. Asterisks indicate significant differences compared to the mock using the two-tailed Student’s t-test (*P < 0.05, **P < 0.01, ***P < 0.001, ****P < 0.0001). For exact P values, see.
Extended Data Fig. 6 |
Extended Data Fig. 6 |. Design of multiplexed gRNAs for genome editing of RBL1 and field trials.
a, Gene structure of RBL1 and the site targeted by each numbered guide RNA (gRNA). b, Map and cloning sites of the CRISPR/Cas9 vector pRGEB32 used in genome editing (left); vectors with different gRNAs (right). c, Sequences of gRNAs designed using CRISPR-P 2.0. Purple letters indicate protospacer-adjacent motif sites (PAMs). d, A schematic diagram of co-transformation of different constructs and genotyping of T0 lines. Edited sites in each T0 plant were identified using Sanger sequencing and agarose gel electrophoresis. WT, the wild-type Kitaake. e, Design of the normal field plots. f, Design of the field plots in the rice blast nursery. WT, the wild-type Kitaake; rbl1Δ12, the edited line; LTH, the very susceptible rice variety Lijiangxintuanheigu, which was used as the spreader line for rice blast. Each plot contains 100 plants 0.2 m apart. g, Identification of transgene-free T1 plants of rbl1Δ12. Primers specific to the Cas9, hph and Actin genes, respectively, were used in genotyping. The hph gene encoding a hygromycin B phosphotransferase confers hygromycin resistance in the rice transgenic lines. The amplicon of the Actin gene was used as the DNA quality control. WT, Kitaake. Similar results were obtained from three independent experiments. h. Agronomic traits of the rbl1Δ12 and Kitaake lines. Data for each agronomic trait were collected from 50 plants for each line that was grown in the normal paddy field. Data are mean ± s.e.m, n = number of biologically independent samples in the graphs. In the box and whisker plots, dots indicate individual data points, and the error bars represent maximum and minimum values. Center line, median; box limits, 25th and 75th percentiles. Asterisks indicate significant differences using the two-tailed Student’s t-test (****P < 0.0001). For exact P values, see.
Extended Data Fig. 7 |
Extended Data Fig. 7 |. Characterization of the rbl1Δ12 line and the allele.
a, Sanger sequencing of the edited site indicated by the arrow in the rbl1Δ12 line with the wild-type (WT, Kitaake) as the reference. The PAM site was shown in blue, and the dashed line represents the 12 nucleotide deletion. b, Amino acid sequence alignment of RBL1 homologs around the four residues (underlined) that are truncated in the rbl1Δ12 line. Highlighted are conserved residues in the RBL1 homologs. c, ROS generation in the WT, rbl1Δ12, Nipponbare (Nip), LTH, and R498 rice plants challenged with chitin at the booting stage. RLU, relative light unit. d, qRT-PCR assays of RBL1 expression in different tissues of the WT, rbl1Δ12, and rbl1 plants at the flowering stage. e, qRT-PCR assays of heterologous expression of RBL1 in yeast. Yeast 18s rRNA was used as the internal control. f, Immunoblotting analysis of RBL1-, rbl1-, and RBL1Δ12-6×His fusion proteins in yeast. Ponceau S staining indicates the protein loading. WT, yeast strain BY4741; other strains are transformants of the yeast cds1 mutant carrying pYES2-RBL1, pYES2-rbl1, and pYES2- RBL1Δ12, respectively. Similar results were obtained from three independent experiments. g, Stability of the RBL1- and RBL1Δ12-6×His fusion proteins analyzed using differential scanning calorimetry (DSC). h, Subcellular localization of the RBL1- and RBL1Δ12-GFP fusion proteins transiently expressed in Nicotiana benthamiana leaf epidermal cells, analyzed together with the endoplasmic reticulum marker HDEL-mCherry. Bars, 25 μm. i, RBL1-GFP rescues the growth defect of yeast cds1. WT, yeast strain BY4741; R1G, the yeast cds1 mutant carrying pYES2-RBL1-GFP. Strains were cultured on YPGal or YPD plates at 30 °C for 3 days before sampling. Immunoblotting analysis of the RBL1-GFP fusion protein in the yeast strain R1G that forms a homodimer. CBB staining indicates the protein loading. Similar results were obtained from three independent experiments. j, 9-week-old WT, rbl1Δ12, and complemented T1 plants. The white asterisk indicates the spontaneous lesion in the insets. Bar, 10 cm. Shown on the right are qRT-PCR assays of RBL1 in the WT, rbl1Δ12, and CoR1:: rbl1Δ12 lines. The Actin gene was used as the internal control. k, Punch inoculation of the WT, rbl1Δ12, and CoR1:: rbl1Δ12 lines with M. oryzae. The lesion area was measured at 14 dpi. Bar, 1 cm. l, Leaves of 3-week-old WT, rbl1, rbl1Δ12, and F1 plants of rbl1 crossed with rbl1Δ12. Bar, 1 cm. m, The WT, rbl1Δ12, and F2 plants derived from the WT line crossed with rbl1Δ12 at 60 dps. Spontaneous lesions-indicated by white asterisks-formed on the top leaves of homozygous rbl1Δ12 lines. Bars, 10 cm. n, Punch inoculation assays of the WT, rbl1Δ12, and F2 plants with M. oryzae. The lesion area was measured at 14 dpi. Bar, 1 cm. o, qRT-PCR assays of RBL1 in the WT, rbl1Δ12 and F2 plants at the tillering stage. p, WT and rbl1Δ12 transgenic plants expressing the PI(4,5)P2 biosensor at 32 hpi with M. oryzae stain ZB25 expressing the cytoplasmic effector Pwl2 tagged with mCherry. BIC, biotrophic interfacial complex; EIHM, extra-invasive hyphal membrane; IH, invasive hyphae. Bar, 10 μm. q, BIC formation in plants shown in (p). r, Membrane lipid composition analysis of the WT, rbl1Δ12, and rbl1 lines. DW, dry weight. s, PIP and PIP2 content in the WT, rbl1Δ12, and rbl1 lines. Data are mean ± s.e.m, n = number of biologically independent samples in the graphs. The box plot elements are: center line, median; box limits, 25th and 75th percentiles. Asterisks in (e) and (q) indicate significant differences using the two-tailed Student’s t-test (*P < 0.05, **P < 0.01). For exact P values, see Source Data. Significant differences indicated by different letters in (d),(j),(k), (n),(o),(r), and (s) were calculated using the Duncan’s new multiple range test.
Extended Data Fig. 8 |
Extended Data Fig. 8 |. No mutations were observed in predicted off-target sites in rbl1Δ12.
The top seven predicted off-target sites were analyzed using Sanger sequencing with the Kitaake (WT) genome as the reference. Purple letters indicate protospacer-adjacent motif sites (PAMs). The right panel shows the sequencing results of the potential off-target sites.
Extended Data Fig. 9 |
Extended Data Fig. 9 |. Genome editing of RBL1 enhances disease resistance in two other rice cultivars.
a, Lesion mimic phenotypes and enhanced resistance to M. oryzae in RBL1-edited Nipponbare (Nip) lines. Infected leaves and lesion area of punch-inoculated RBL1-edited lines with M. oryzae at 14 dpi. Bar, 1 cm. b, 12-week-old RBL1-edited Nipponbare lines. Bar, 10 cm. c, qRT-PCR assays of RBL1 and plant defense-related genes OsPR8 and OsPR10 in the RBL1-edited Nipponbare lines. Total RNA was extracted from 4-week-old leaves. The Actin gene was used as the internal control. df, Similar assays as shown in (ac) were performed on rice cultivar Zhonghua11 (ZH11). g, Sanger sequencing of the edited sites, indicated by arrows, in nr-7 and zr-7 lines, with the wild-type (WT, Kitaake) as the reference. The mutated nucleotides are shown in gray (deletion) and blue (insertion). h, Amino acid sequence alignment of the region mutated in lines nr-7 and zr-7. The four amino acids truncated in RBL1Δ12 are indicated by arrows. Shaded are conserved residues in the RBL1 homologs. Two amino acids are truncated in nr-7, with the first one overlapping the truncated residues in RBL1Δ12. An 84-bp frameshift mutation caused by a 1-bp deletion followed by a 1-bp insertion alters the sequence of 28 amino acids (gray) in zr-7, with the first two overlapping the truncated residues in RBL1Δ12. Data are mean ± s.e.m, n = number of biologically independent samples in the graphs. And asterisks indicate significant differences compared to the WT using the unpaired Student’s t-test (**P < 0.01, ***P < 0.001, ****P < 0.0001). For exact P values, see Source Data. Significant differences indicated by different letters in (c) and (f) were calculated using the Duncan’s new multiple range test.
Fig. 1 |
Fig. 1 |. Cloning the RBL1 gene from the LMM rbl1, which has enhanced immunity.
a, Wild-type (WT, KitaakeX) and rbl1 mutant plants at 40 days after sowing. Scale bar, 10 cm. b, Spontaneous lesions. Scale bar, 1 cm. c, Inoculation of rice lines with Xoo at 14 days post-inoculation (dpi). Scale bar, 1 cm. d, Lesion length at 14 dpi for WT and rbl1 plants. e, Punch inoculation with M. oryzae at 14 dpi. The area between the dashed lines was covered by aluminium foil before spontaneous lesions appeared. Scale bar, 1 cm. f, Lesion area and relative fungal biomass. g, Fungal infection rates at 72 hpi. h, Rice sheath cells infected by eGFP-tagged M. oryzae strain ZB25. Scale bars, 25 μm. i, ROS generation in rice plants challenged with chitin and water (mock). RLU, relative light unit. j, Screenshot of the 29 nucleotide deletion in rbl1. Chr., chromosome. k, Gene structure of RBL1. The grey box indicates the exon skipped in rbl1. The sequence of the deletion is shown and the intron sequence is in italic. l, Schematic diagram of RBL1. The red box indicates the truncation. The CDS signature motif is shown at the bottom. m, 10-week-old WT, rbl1 and complemented (COR1) plants. Scale bar, 10 cm. COR1, rbl1 complemented plants. n, Leaves of the lines shown in m. o, Quantitative PCR with reverse transcription (RT–qPCR) assays of RBL1. p, Infection assays with M. oryzae at 14 dpi. All data are mean ± s.e.m.; n is the number of biologically independent samples. Box plots with individual data points: centre line, median; box limits, 25th and 75th percentiles. Asterisks indicate significant differences using the two-tailed Student’s t-test (**P < 0.01, ***P < 0.001, ****P < 0.0001). For exact P values, see Source Data. Significant differences indicated by different letters (in o and p) were calculated using the Duncan’s new multiple range test.
Fig. 2 |
Fig. 2 |. RBL1 functions as a CDP-DAG synthase.
a, RBL1 rescues the growth defect of the yeast cds1 mutant (images show growth on YPGal and YPD medium). WT, yeast strain BY4741; cdsC, yeast mutant cds1 expressing RBL1. b, Immunoblotting analysis of the RBL1–6×His fusion protein (monomeric and dimeric states). CBB, Coomassie brilliant blue. Similar results were obtained from three independent experiments. c, Lipidomics assays of yeast strains cultured in YPGal or YPD. DW, dry weight; DAG, diacylglycerol; PA, phosphatidic acid; PC, phosphatidylcholine; PE, phosphatidylethanolamine; PG, phosphatidylglycerol; PI, phosphatidylinositol; PS, phosphatidylserine. d, Lipidomic analysis of the 4-week-old wild-type (WT, Kitaake) and rbl1 lines. MGDG, monogalactosyldiacylglycerol; DGDG, digalactosyldiacylglycerol. e, Fatty-acid species of PI. No alterations were detected between WT and rbl1 for fatty-acid species 36:1 to 36:6. f, Eight-week-old T1 plants of the OsPIS1 overexpression OsPIS1::rbl1 lines. Scale bar, 10 cm. g, Lesions on new rice leaves. Scale bar, 1 cm. h, Lesion area of the lines shown in g. i, RT–qPCR assays of genes in the OsPIS1::rbl1 line. j, Punch inoculation with M. oryzae and relative fungal biomass at 14 dpi. Scale bar, 1 cm. k, Lipid content for PI, phosphatidylinositolphosphates (PIPs) and PtdInsP2 (PIP2). l, Eight-week-old plants. OsPAH2::rbl1, the rbl1 line overexpressing OsPAH2. Black scale bar, 1 cm; white scale bar, 10 cm. m, RT–qPCR assays. n, Punch inoculation with M. oryzae and the lesion area at 14 dpi. Scale bar, 1 cm. o, Lipidomics assays of different rice lines. Data are mean ± s.e.m.; n is the number of biologically independent samples in the graphs. Asterisks in d,e,h and i indicate significant differences using the two-tailed Student’s t-test (*P < 0.05, **P < 0.01, ***P < 0.001, ****P < 0.0001). For exact P values, see Source Data. The box plot elements are: centre line, median; box limits, 25th and 75th percentiles. Significant differences indicated by letters in c, ik and mo were calculated using the Duncan’s new multiple range test.
Fig. 3 |
Fig. 3 |. PtdIns(4,5)P2, enriched in infection-specific structures, is reduced in rbl1 plants.
a, Dot blots of membrane PIP2 in the WT (Kitaake) and rbl1 lines. b, Relative levels of membrane PIP2. Actin was used as the sample control. c, Epidermal cells of rice lines expressing the PtdIns(4,5)P2 (PI(4,5)P2) biosensor. Scale bar, 25 μm. d, Relative fluorescence intensity of the PI(4,5)P2 biosensor in c. The box plot elements are: centre line, median; box limits, 25th and 75th percentiles. e, Immunoblots of the PtdIns(4,5)P2 biosensor in c. M, molecular-weight marker; PHPLC, the pleckstrin homology domain of PLCδ1; PLC, the biosensor phospholipase C; RBC, ribulose-1,5-bis-phosphate carboxylase/oxygenase. f, PI(4,5)P2 aggregates around the infectious hyphal tip of M. oryzae at 22 hpi. AP, appressorium; IH, invasive hyphae. Pwl2 is a cytoplasmic effector, a biomarker for the BIC. Scale bar, 10 μm. g, Rice cells of the WT expressing the PI(4,5)P2 biosensor infected by the M. oryzae strain expressing the fluorescent apoplastic effector Bas4–mCherry at 27 hpi. Scale bar, 10 μm. h, Fluorescence intensity of the plasma membrane and EIHM shown in g. i, PI(4,5)P2 and Pwl2 at the BIC at 32 hpi. The inset shows the enlarged BIC. Scale bars, 5 μm. j, BIC formation rates from 150 infected cells. Scale bar, 10 μm. Experiments were repeated three (e) or more (f,g,i and j) times with similar results. k, Working model of how RBL1 confers rice resistance to M. oryzae. RBL1 is important for the biosynthesis of phosphatidylinositol and phosphatidylinositolphosphates including PI(4,5)P2. As M. oryzae invades, PI(4,5)P2 is recruited to the EIHM and enriched in the BIC. The accumulation of phosphatidic acid, a minor factor, and other unknown factors contribute to the enhanced immunity of rbl1. ER, endoplasmic reticulum; PM, plasma membrane. Data are mean ± s.d. (j) or mean ± s.e.m.; n is the number of independent replicates (b) or biologically independent samples (d and h). Asterisks indicate significant differences using the two-tailed Student’s t-test (***P < 0.001, ****P < 0.0001). For exact P values, see Source Data.
Fig. 4 |
Fig. 4 |. RBL1Δ12 confers broad-spectrum disease resistance with no observed yield penalty in field trials.
a, Guide RNA sites, indicated by dots, for genome editing of RBL1. The asterisk indicates the edited site in rbl1Δ12. b, Edited RBL1 lines. Scale bar, 1 cm. c, Eight-week-old plants in the greenhouse. Scale bar, 10 cm. d, Agronomic traits: grain setting rate, number of tillers and grain yield. e, Lesions from different M. oryzae strains at 14 dpi. Scale bar, 1 cm. f, Lesions from various Xoo strains at 14 dpi. Scale bar, 1 cm. g, In planta bacterial growth of Xoo strain PXO99. h, Panicles infected with strains of U. virens. Rice false smut balls were counted at 17 dpi. i, Quantitative assays of ustiloxins from U. virens in infected panicles. FW, fresh weight. j, Spikelets infected with strains of U. virens. Arrows indicate invasive hyphae. an, anther; pa, palea; sf, stamen filament; st, stigma. Scale bars, 100 μm. Experiments were repeated twice with similar results. k, Rice grain yield in the ‘normal’ field trials with a low incidence of rice blast. l, Field assessment of blast resistance in the blast nursery. Representative panicles are shown on the left. Disease severity is indicated by the percentage of necrotic panicles for each plant caused by M. oryzae infection. Scale bar, 1 cm. m, Grain yield of plants grown in the blast nursery. Seeds per plant are shown on the left. Scale bar, 1 cm. The box plot elements are: centre line, median; box limits, 25th and 75th percentiles. Data are mean ± s.e.m.; n is the number of biologically independent samples in the graphs. Asterisks indicate significant differences using the two-tailed Student’s t-test (*P < 0.05, **P < 0.001, ***P < 0.001, ****P < 0.0001). For exact P values, see Source Data. Significant differences indicated by different letters in dg were calculated using the Duncan’s new multiple range test.

Comment in

References

    1. Gao C Genome engineering for crop improvement and future agriculture. Cell 184, 1621–1635 (2021). - PubMed
    1. Liu X, Yin Y, Wu J & Liu Z Structure and mechanism of an intramembrane liponucleotide synthetase central for phospholipid biosynthesis. Nat. Commun. 5, 4244 (2014). - PMC - PubMed
    1. Qin L et al. Specific recruitment of phosphoinositide species to the plant–pathogen interfacial membrane underlies Arabidopsis susceptibility to fungal infection. Plant Cell 32, 1665–1688 (2020). - PMC - PubMed
    1. Zhu H, Li C & Gao C Applications of CRISPR–Cas in agriculture and plant biotechnology. Nat. Rev. Mol. Cell Biol. 21, 661–677 (2020). - PubMed
    1. Chen K, Wang Y, Zhang R, Zhang H & Gao C CRISPR/Cas genome editing and precision plant breeding in agriculture. Annu. Rev. Plant Biol. 70, 667–697 (2019). - PubMed

Publication types

MeSH terms

Substances