. 2023 Jun;618(7965):531-536.
doi: 10.1038/s41586-023-06024-5. Epub 2023 Jun 14.

Hadaean to Palaeoarchaean stagnant-lid tectonics revealed by zircon magnetism

Affiliations

Hadaean to Palaeoarchaean stagnant-lid tectonics revealed by zircon magnetism

John A Tarduno et al. Nature. 2023 Jun.

Abstract

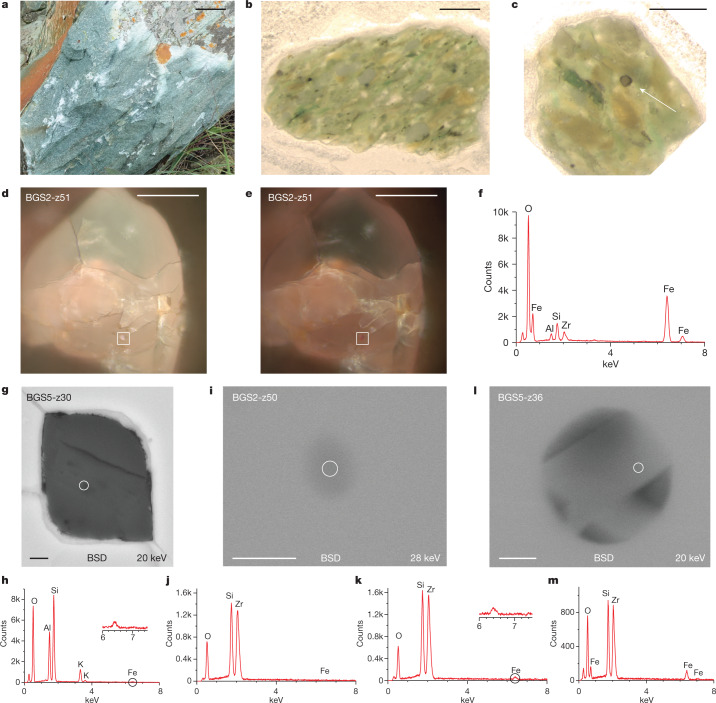
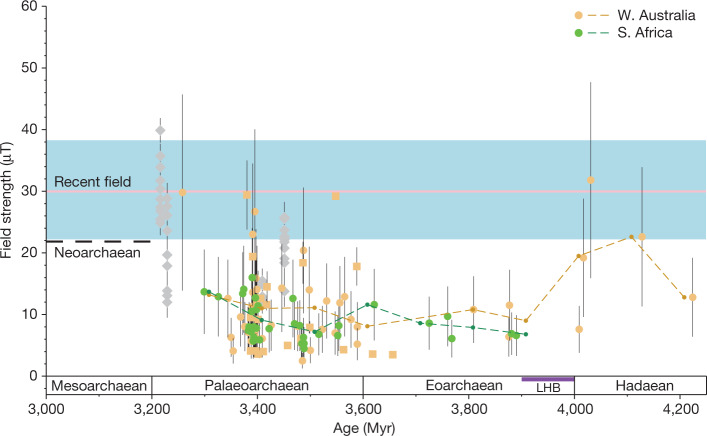
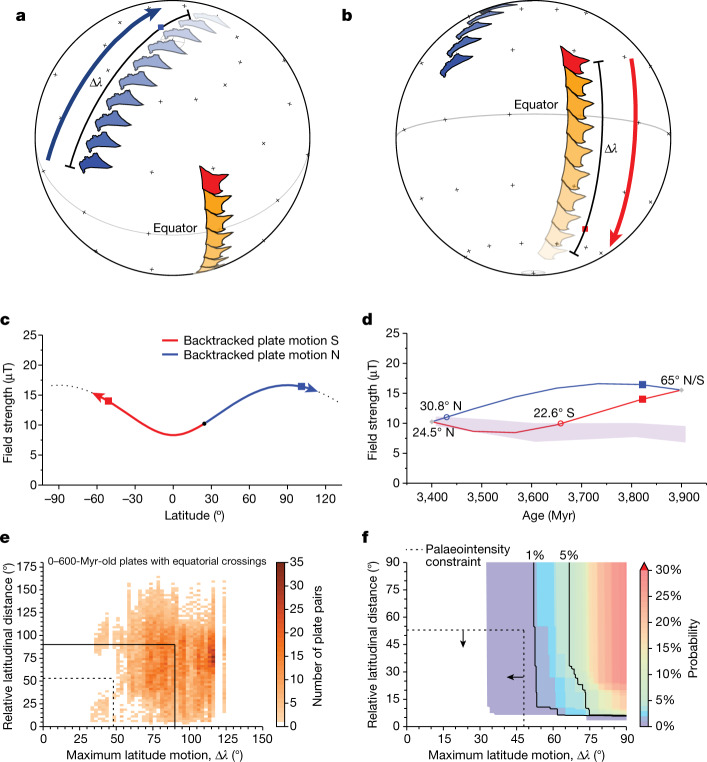
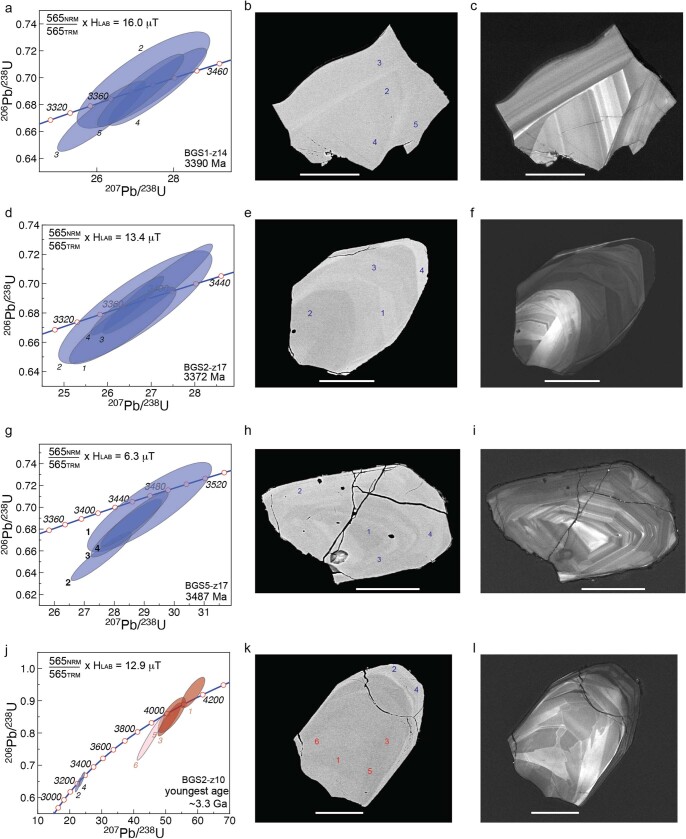
Plate tectonics is a fundamental factor in the sustained habitability of Earth, but its time of onset is unknown, with ages ranging from the Hadaean to Proterozoic eons1-3. Plate motion is a key diagnostic to distinguish between plate and stagnant-lid tectonics, but palaeomagnetic tests have been thwarted because the planet's oldest extant rocks have been metamorphosed and/or deformed4. Herein, we report palaeointensity data from Hadaean-age to Mesoarchaean-age single detrital zircons bearing primary magnetite inclusions from the Barberton Greenstone Belt of South Africa5. These reveal a pattern of palaeointensities from the Eoarchaean (about 3.9 billion years ago (Ga)) to Mesoarchaean (about 3.3 Ga) eras that is nearly identical to that defined by primary magnetizations from the Jack Hills (JH; Western Australia)6,7, further demonstrating the recording fidelity of select detrital zircons. Moreover, palaeofield values are nearly constant between about 3.9 Ga and about 3.4 Ga. This indicates unvarying latitudes, an observation distinct from plate tectonics of the past 600 million years (Myr) but predicted by stagnant-lid convection. If life originated by the Eoarchaean8, and persisted to the occurrence of stromatolites half a billion years later9, it did so when Earth was in a stagnant-lid regime, without plate-tectonics-driven geochemical cycling.


Conflict of interest statement

The authors declare no competing interests.

Figures

Fig. 1
Fig. 1. BGS, detrital zircons and Fe-bearing inclusions.
a, Field photo of BGS. Scale bar, 5 cm. b, Example section of BGS approximately 300 μm thick. Scale bar, 1 mm. c, Example of detrital zircon (arrow) in BGS matrix. Scale bar, 1 mm. d,e, Reflected-light images (100×) of zircon BGS2-z51, with the boxes highlighting Fe-oxide inclusion (magnetite) at 0° (d) and 90° (e) polarization. Scale bars, 50 μm. f, SEM EDS spectra of Fe inclusion highlighted in d and e (see Extended Data Fig. 2 for further SEM images and EDS analyses). g, SEM BSD image of silicate inclusion in zircon BGS5-z30 with EDS analysis location identified by the circle (see Extended Data Fig. 1 for further SEM images and EDS spectra). Scale bar, 1 μm. h, EDS spectra of g with Fe signal highlighted. i, SEM BSD image of Fe-oxide inclusion (magnetite) in zircon BGS2-z50 with EDS spectra analysis location highlighted by the circle. Scale bar, 200 nm. j,k, EDS analyses of i. An Fe signal was not observed using a 20-keV beam (j) but was detected using a 28-keV beam (k), emphasizing that the inclusion is at depth (>4 μm). (Methods. Corresponding reflected-light images showing inclusion extinction are in Extended Data Fig. 2.) l, SEM BSD image of Fe-oxide particles in zircon BGS5-z36 with EDS location highlighted by the circle (further reflected-light and SEM images are shown in Extended Data Fig. 2). Scale bar, 200 nm. m, EDS spectra of l. Source data
Fig. 2
Fig. 2. Palaeomagnetic thermal demagnetization, palaeointensity determinations and SHRIMP age data from individual BGS zircons.
a, Orthogonal vector plot of thermal demagnetization of unoriented zircon BGZ5-z1 (shown as inset). Temperatures shown are in °C. Red, vertical projection of the magnetization; blue, horizontal projection. Scale bar, 50 μm. b, NRM moment after thermal demagnetization (a) normalized to its undemagnetized value plotted versus demagnetization temperature. Value after heating at 565 °C highlighted (vertical red line). c, Concordia diagram showing SHRIMP geochronological analyses (uncertainty ellipses are 2σ) and palaeointensity value for zircon BGS2-z14. d, Corresponding backscattered scanning electron microscope image with analysed spots labelled. e, Corresponding cathodoluminescence image. fh, Analyses as shown in ce for zircon BGS1-z11. ik, Analyses as shown in ce for zircon BGS1-z9. Red, analyses from core; blue, analyses from rim; grey, excluded from calculation of mean age. Scale bars, 50 μm. Source data
Fig. 3
Fig. 3. Palaeointensity history from BGS (South Africa) and JH (Western Australia) zircons.
Zircon palaeointensity results: green circles, 565 °C palaeointensity determinations (this study); yellow from the JH (boxes, Thellier–Coe palaeointensity results; circles, 565 °C palaeointensity determinations),. Green and yellow dashed lines: 100-Myr running average of zircon palaeointensity results from the BGS and JH, respectively. Other single-silicate palaeointensity results from extant igneous rocks shown as grey diamonds,. Recent field: pink solid line is mean and standard deviation (blue shaded region) from a bootstrap resampling of data from the past 800 thousand years, set to the palaeolatitude of the Mesoarchaean data. Neoarchaean field strength (dashed black line) based on mean of select time-averaged palaeointensity results,. LHB, Late Heavy Bombardment. All data are above threshold for geomagnetic field presence based on external field imparted by the solar wind. Near-constant palaeointensity values between approximately 3.9 Ga and approximately 3.4 Ga indicate palaeolatitude stasis of the recording sites (see text). Source data
Fig. 4
Fig. 4. Hypothetical latitudinal motions typical of 0–600 Myr plate tectonics.
a, Two hypothetical continents, one backtracked north (blue) and the other south (red, orange), from a starting latitude of 24.5° corresponding to the 3.4–3.45-Ga palaeolatitude of the BGS (hemisphere is unknown and arbitrarily set as N). Northward motion (blue arrow) and maximum latitudinal motion (Δλ) highlighted. Blue square represents the median Δλ value observed for continental plates of the past 600 Myr. b, Same as a but the continent backtracked south is highlighted (in red and red arrow). Red square represents the median maximum latitudinal value observed for continental plates of the past 600 Myr. c, Dipole relationship between field intensity and latitude, set to the palaeolatitude of the BGS at 3.4–3.45 Ga (hemisphere is unknown and arbitrarily set as N), and the BGS/JH field strength value. Squares as in a and b. d, BGS and JH palaeointensity data (W. Australia + S. Africa) shown as the standard error of the 100-Myr bin mean (violet band) with predicted latitude history for a site moving northward (a) or southward (b). Squares as in a and b. Open circles are the values for which the backtracked palaeolatitude began to differ from the observations. e, 2D histogram of the relative latitudinal distance and maximum latitude motion (Δλ) characteristics of equatorial crossing plates of the past 600 Myr. Colour scale shows the number of unique plate pairs that exhibit motion as in b. Data are grouped into 2.5° bins. Dashed lines are the BGS/JH palaeointensity constraints (d; see ‘Statistical analysis of BGS and JH zircon palaeointensity data’ section in Methods). f, Expanded view of e, shown as the probability of sampling a pair of equatorial crossing plates with these relative latitudinal distance and Δλ characteristics. Dashed lines and arrows are the BGS/JH palaeointensity constraints. Source data
Extended Data Fig. 1
Extended Data Fig. 1. Silicate and apatite inclusions in BGS detrital zircons.
a, SEM secondary electron (SE2) images of zircon BGS2-z36 with apatite inclusion highlighted. b, Higher magnification of the inclusion with EDS analysis location highlighted. c, EDS spectra. d, Reflected-light microscope image of zircon BGS2-z39. e, SEM BSD image of zircon BGS2-z39 with quartz inclusion highlighted. f, Higher magnification of the inclusion with EDS analysis location highlighted. g, EDS spectra. h, Reflected-light microscope image of zircon BGS5-z30. i, SEM BSD image of zircon BGS5-z30 with feldspar inclusion identified. j, Higher magnification of the inclusion with EDS analysis locations highlighted. kn, EDS spectra. Source data
Extended Data Fig. 2
Extended Data Fig. 2. Fe-oxide and silicate inclusions in BGS detrital zircons.
a, SEM BSD image of zircon BGS2-z51 highlighting melt inclusions discussed (b,f,d); entire grain shown as inset with 50-μm scale bar. b, Higher-magnification SEM BSD image of feldspar inclusion b. EDS analysis location highlighted. c, EDS spectra of inclusion b. d, Higher-magnification SEM BSD image of multicomponent inclusion partially disrupted by polishing. EDS analysis location highlighted. e, EDS spectra from d suggesting a feldspar composition. f, Higher-magnification SEM BSD image of inclusion f (see Fig. 1 showing extinction with 90° change in polarization) showing EDS analysis locations. This inclusion may be partially disrupted by polishing. g, EDS spectra of main grain in f highlighting strong Fe signal. Al may be from adjacent feldspar (see h). h, EDS of small grain in f showing spectra compatible with feldspar. i, Reflected-light microscopy image (100×) of zircon BGS2-z50. j, Reflected-light images (1,000× oil immersion) at 0° (top) and 90° (bottom) polarization showing extinction of Fe-oxide inclusion (magnetite) at depth (see Fig. 1). k, Reflected-light image of zircon BGS5-z36 (see Fig. 1). l, SEM BSD image of BGS5-z36. Fe particles shown in Fig. 1 are approximately 2 μm from the grain edge (also see ‘Microtectonic analyses of zircons’ section in Methods). Source data
Extended Data Fig. 3
Extended Data Fig. 3. Further palaeointensity determinations and SHRIMP age data from individual BGS zircon crystals.
a, Concordia diagram showing SHRIMP geochronological analyses (uncertainty ellipses are 2σ) and palaeointensity value for zircon BGS1-z14. b, Corresponding backscatter scanning electron microscope with analysis spots labelled in a. c, Corresponding cathodoluminescence image. Images b and c shown with 50-μm scale. df, Analyses as shown in ac for zircon BGS2-z17. gi, Analyses as shown in ac for zircon BGS5-z17. jl, Analyses as shown in ac for zircon BGS2-z10. Red, analyses from core; blue, analyses from rim. Source data
Extended Data Fig. 4
Extended Data Fig. 4. BGS and JH zircon palaeointensity values versus time.
a, BGS palaeointensity data (green circles) and JH palaeointensity data (yellow circles), shown with Welch’s t-test P-value (red curve; see ‘Statistical analysis of BGS and JH zircon palaeointensity data’ section in Methods). b, JH zircon palaeointensity values (Tarduno et al.,) with 100-Myr moving-window average. c, BGS zircon palaeointensity values shown with data of a. d, Residuals of JH palaeointensity values relative to model (JH 100-Myr moving-window average). e, Residuals of BGS palaeointensity values relative to model (JH 100-Myr moving-window average). f, Empirical cumulative distribution function (ECDF) plot of JH and BGS residuals. Source data
Extended Data Fig. 5
Extended Data Fig. 5. Plate-motion analysis 0–600 Ma.
a, Distribution of sites used in plate-motion analysis. Different colours distinguish between assigned plates. b, Representative example of the motion path for a single site with Δλ at the median value (76°) determined using the plate-motion models described in the text. Solid line shows motion path resolved at 1-Myr intervals, black circles show 20-Myr steps. Blue circle, present-day site location; yellow circle, site palaeolocation at 600 Ma; red diamond, location at which the maximum latitudinal displacement is reached. c, Distribution of Δλ from 228 sites located on 66 plates, determined using 1-Myr time steps shown with age of maximum latitudinal distance (Δλ) from present versus angle. d, Distribution of Δλ in 5° bins; red line (and right y axis) shows empirical cumulative distribution of Δλ. Source data
Extended Data Fig. 6
Extended Data Fig. 6. Maximum latitudinal motion (Δλ) of sites for the past 600 Myr.
Plate-motion-model-derived Δλ values with (a) 1-Myr and (b) 100-Myr downsampling. Histograms show number of sites (total n = 228) with Δλ binned into 5° groups. Solid vertical line shows median Δλ; dashed vertical lines mark the 95% interval for the distribution. Source data

Similar articles

Cited by

References

    1. Hawkesworth CJ, Cawood PA, Dhuime B. The evolution of the continental crust and the onset of plate tectonics. Front. Earth Sci. 2020;8:326. doi: 10.3389/feart.2020.00326. - DOI - PMC - PubMed
    1. Shirey SB, Richardson SH. Start of the Wilson cycle at 3 Ga shown by diamonds from subcontinental mantle. Science. 2011;333:434–436. doi: 10.1126/science.1206275. - DOI - PubMed
    1. Stern RJ. Evidence from ophiolites, blueschists, and ultrahigh-pressure metamorphic terranes that the modern episode of subduction tectonics began in Neoproterozoic time. Geology. 2005;33:557–560. doi: 10.1130/G21365.1. - DOI
    1. Tarduno JA, Blackman EG, Mamajek EE. Detecting the oldest geodynamo and attendant shielding from the solar wind: implications for habitability. Phys. Earth Planet. Inter. 2014;233:68–87. doi: 10.1016/j.pepi.2014.05.007. - DOI
    1. Byerly BL, et al. Hadean zircon from a 3.3 Ga sandstone, Barberton greenstone belt, South Africa. Geology. 2018;46:967–970. doi: 10.1130/G45276.1. - DOI