. 2023 Oct;43(7):1611-1622.
doi: 10.1007/s10875-023-01530-7. Epub 2023 Jun 14.

Autosomal Dominant STAT6 Gain of Function Causes Severe Atopy Associated with Lymphoma

Collaborators, Affiliations

Autosomal Dominant STAT6 Gain of Function Causes Severe Atopy Associated with Lymphoma

Ekaterina Minskaia et al. J Clin Immunol. 2023 Oct.

Abstract

The transcription factor STAT6 (Signal Transducer and Activator of Transcription 6) is a key regulator of Th2 (T-helper 2) mediated allergic inflammation via the IL-4 (interleukin-4) JAK (Janus kinase)/STAT signalling pathway. We identified a novel heterozygous germline mutation STAT6 c.1255G > C, p.D419H leading to overactivity of IL-4 JAK/STAT signalling pathway, in a kindred affected by early-onset atopic dermatitis, food allergy, eosinophilic asthma, anaphylaxis and follicular lymphoma. STAT6 D419H expression and functional activity were compared with wild type STAT6 in transduced HEK293T cells and to healthy control primary skin fibroblasts and peripheral blood mononuclear cells (PBMC). We observed consistently higher STAT6 levels at baseline and higher STAT6 and phosphorylated STAT6 following IL-4 stimulation in D419H cell lines and primary cells compared to wild type controls. The pSTAT6/STAT6 ratios were unchanged between D419H and control cells suggesting that elevated pSTAT6 levels resulted from higher total basal STAT6 expression. The selective JAK1/JAK2 inhibitor ruxolitinib reduced pSTAT6 levels in D419H HEK293T cells and patient PBMC. Nuclear staining demonstrated increased STAT6 in patient fibroblasts at baseline and both STAT6 and pSTAT6 after IL-4 stimulation. We also observed higher transcriptional upregulation of downstream genes (XBP1 and EPAS1) in patient PBMC. Our study confirms STAT6 gain of function (GOF) as a novel monogenetic cause of early onset atopic disease. The clinical association of lymphoma in our kindred, along with previous data linking somatic STAT6 D419H mutations to follicular lymphoma suggest that patients with STAT6 GOF disease may be at higher risk of lymphomagenesis.245 words.

Keywords: Atopy; Gain-of-function; Lymphoma; STAT6.


Conflict of interest statement

SOB has received grant support from CSL Behring and personal fees or travel expenses from Immunodeficiency Canada/IAACI, CSL Behring, Baxalta US Inc and Biotest. ECM has received honoraria from GlaxoSmithKline, AstraZeneca and Orchard Therapeutics. BG was an advisor to the following companies: UCB Pharma S.A., Epimune GmbH, Octapharma, Atheneum Partners GmbH, and GigaGen Inc. and a speaker for Janssen-Cilag GmbH. The rest of the authors declare that they have no conflicts of interest.

Figures

Fig. 1
Fig. 1
STAT6 pathway, pedigree genotyping and proband immunophenotyping. A: Schematic diagram of IL-4 mediated STAT6 pathway. B: Kindred pedigree and Sanger sequencing confirming heterozygous STAT6 D419H in affected family members. C: T helper (Th) subsets according to the differential expression of the chemokine receptors CCR6 and CXCR3. Frequency of CXCR3-CCR6- (D), CXCR3 + CCR6- (E), and CXCR3-CCR6 + (F), respectively, within CD4 memory T cells defined as CD45RA-, in the proband as compared with a cohort of healthy individuals. Flow cytometry analysis of: frequency of CD4 + T cells producing IL-4 (G) and mean intensity of fluorescence (MFI) within CD4 + IL4 + (H); frequency of CD8 + T cells producing IL-4 (I) and MFI within CD8 + IL4 + (J) cells. Serum IL-4 (K) as determined by multiplex electrochemiluminescence-based cytokine assay. Each dot represents one individual
Fig. 2
Fig. 2
D419H variant leads to increased levels of STAT6 and pSTAT6 in Human embryonic kidney (HEK) 293 T cells. A: Western blot with densitometry measurements showing increased STAT6 and pSTAT6 in D419H in HEK 293 T cells, relative to GAPDH housekeeping gene. Image representative of 2 independent experiments. B, C: Bar charts show mean densitometry of STAT6 and pSTAT6. D: Bar chart show pSTAT6/STAT6 ratio. Data are from 2 independent experiments. Each data point is the mean of 3 technical repeats, with protein levels normalised to GAPDH housekeeping gene. Ruxo- Ruxolitinib
Fig. 3
Fig. 3
D419H variant leads to increased levels of STAT6 in patient fibroblast cells compared to healthy control (HC). A: Western blot with densitometry measurements showing increased STAT6 pre- and post-IL-4 stimulation in D419H fibroblasts, relative to GAPDH housekeeping gene. pSTAT6 was only detected post-IL-4 stimulation in HC and D419H. Image representative of 3 independent experiments. B: Flow cytometric analysis showing increased STAT6 and pSTAT6 levels pre- and post IL4 stimulation of D419H fibroblasts from 3 independent experiments. HC – healthy control, M – proband’s mother, P – proband
Fig. 4
Fig. 4
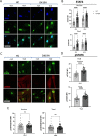
D419H variant leads to increased levels of STAT6 and pSTAT6 in patient fibroblast cells compared to healthy control (HC) with increased nuclear localisation. A: Confocal images of immunofluorescence of STAT6 with nuclear localization in D419H proband fibroblasts in comparison to HC, pre- and post- IL-4 stimulation. B: Bar charts show mean fluorescent intensity of nuclear and total STAT6 and is representative of 2 independent experiments, with each point representing one cell, 50 cells analysed per condition. C: Confocal images of immunofluorescence of pSTAT6 with nuclear localization in D419H proband fibroblasts in comparison to HC, pre- and post- IL-4 stimulation. D: Bar charts show mean fluorescent intensity of nuclear and total pSTAT6 following IL-4 stimulation. This is representative of 2 independent experiments, with each point representing one cell, 50 cells analysed per condition. E: Bar charts showing ratio of pSTAT6:STAT6 post- IL-4 stimulation in nucleus and in the whole cell. **** p-value < 0.0001, ns – not statistically significant
Fig. 5
Fig. 5
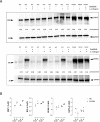
D419H variant leads to increased levels of STAT6 and pSTAT6 in patient PBMC compared to 3 healthy controls (HC). A: Western blot with densitometry measurements showing increased STAT6 across IL-4 concentration and with ruxolitinib, in D419H PBMC, and is representative of 2 experiments. B: RT-qPCR 2-∆CT levels of XBP-1, BCL-6, EPAS1 and GATA3 mRNA transcript in HC and patient D419H T cells. Lower 2-∆CT values indicate higher gene expression level

References

    1. Paul WE, Zhu J. How are T(H)2-type immune responses initiated and amplified? Nat Rev Immunol. 2010;10(4):225–235. doi: 10.1038/nri2735. - DOI - PMC - PubMed
    1. Walker JA, McKenzie ANJ. T(H)2 cell development and function. Nat Rev Immunol. 2018;18(2):121–133. doi: 10.1038/nri.2017.118. - DOI - PubMed
    1. Mikita T, et al. Requirements for interleukin-4-induced gene expression and functional characterization of Stat6. Mol Cell Biol. 1996;16(10):5811–5820. doi: 10.1128/MCB.16.10.5811. - DOI - PMC - PubMed
    1. Li J, et al. Structural basis for DNA recognition by STAT6. Proc Natl Acad Sci U S A. 2016;113(46):13015–13020. doi: 10.1073/pnas.1611228113. - DOI - PMC - PubMed
    1. Goenka S, Kaplan MH. Transcriptional regulation by STAT6. Immunol Res. 2011;50(1):87–96. doi: 10.1007/s12026-011-8205-2. - DOI - PMC - PubMed

Publication types