. 2023 Jun 14;21(1):135.
doi: 10.1186/s12964-023-01141-0.

Lactobacillus acidophilus and propionate attenuate Sjögren's syndrome by modulating the STIM1-STING signaling pathway

Affiliations

Lactobacillus acidophilus and propionate attenuate Sjögren's syndrome by modulating the STIM1-STING signaling pathway

Jin Seok Woo et al. Cell Commun Signal. .

Abstract

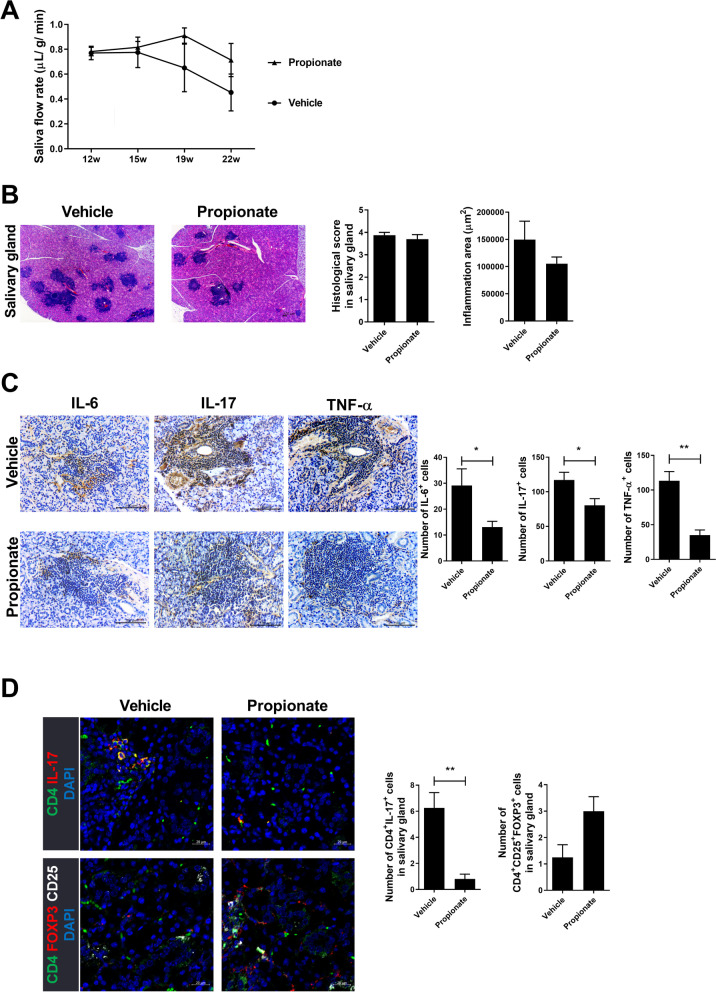
Background: Sjögren's syndrome (SS) is an autoimmune disease characterized by inflammation of the exocrine gland. An imbalance of gut microbiota has been linked to SS. However, the molecular mechanism is unclear. We investigated the effects of Lactobacillus acidophilus (L. acidophilus) and propionate on the development and progression of SS in mouse model.

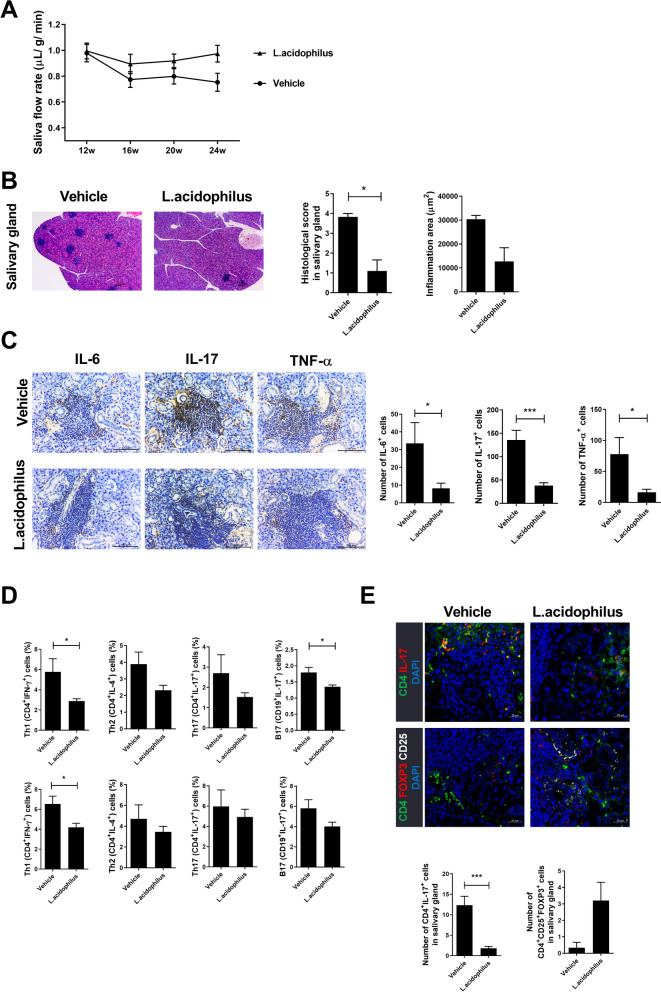
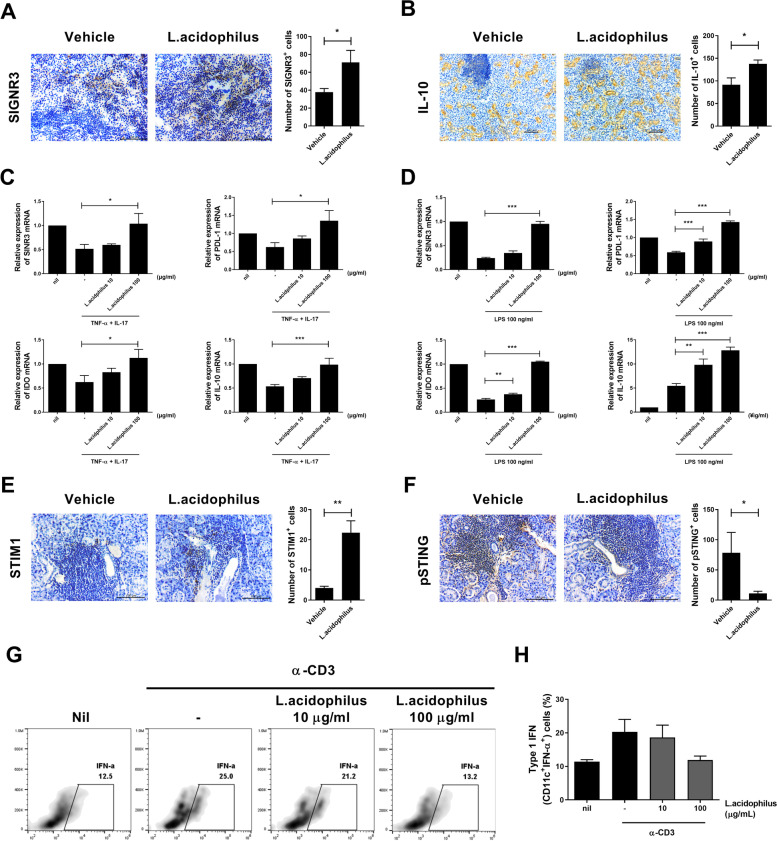
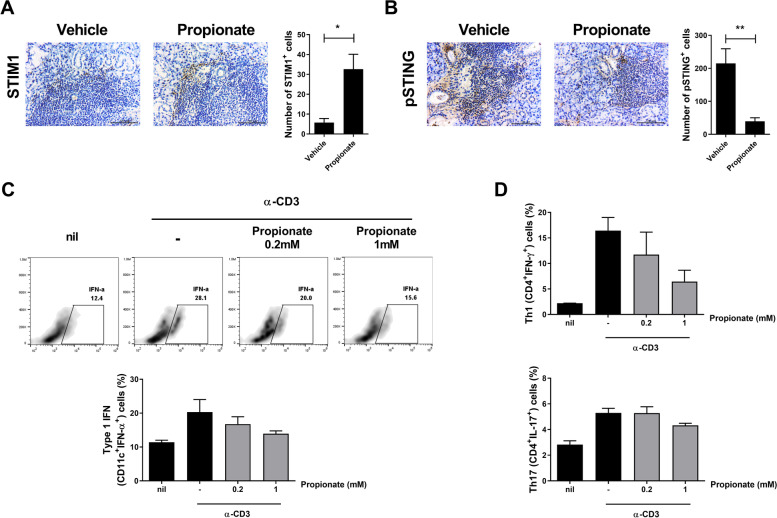
Methods: We compared the gut microbiomes of young and old mice. We administered L. acidophilus and propionate up to 24 weeks. The saliva flow rate and the histopathology of the salivary glands were investigated, and the effects of propionate on the STIM1-STING signaling pathway were evaluated in vitro.

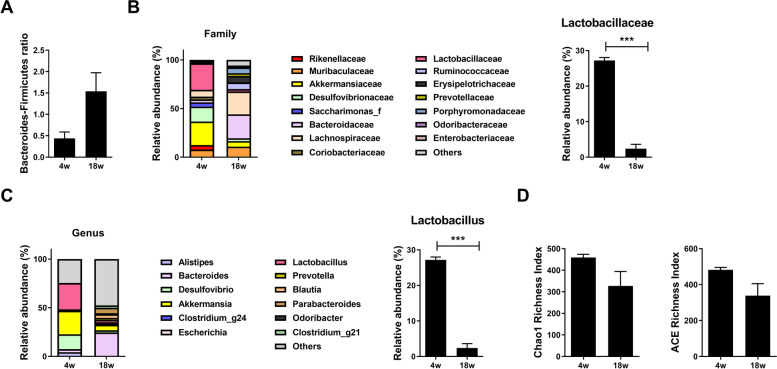
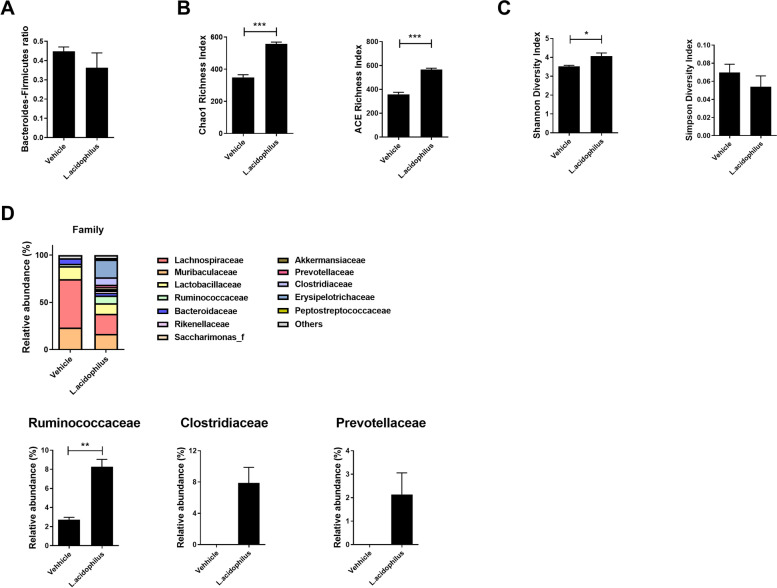
Results: Lactobacillaceae and Lactobacillus were decreased in aged mice. SS symptoms were ameliorated by L. acidophilus. The abundance of propionate-producing bacterial was increased by L. acidophilus. Propionate ameliorated the development and progression of SS by inhibiting the STIM1-STING signaling pathway.

Conclusions: The findings suggest that Lactobacillus acidophilus and propionate have therapeutic potential for SS. Video Abstract.

Keywords: Lactobacillus acidophilus; Propionate; Sjögren’s syndrome; Stimulation of interferon genes (STING); Stromal interaction moleculae 1 (STIM1).


Conflict of interest statement

The authors declare no competing interests.

Figures

Fig. 1
Fig. 1
Changes in the microbiome with age. Cecal microbiome analyses of 4- and 18-week-old NOD mice. A Bacteroides:Firmicutes ratio in 4- and 18-week-old NOD mice. B Abundance (family level) of the gut microbiome (left) and Lactobacillaceae (right) in 4- and 18-week-old NOD mice. C Abundance (genus level) of the gut microbiome (left) and Lactobacillus (right) in 4- and 18-week-old NOD mice. D Chao1 and ACE indices. Data are means ± SD (*p < 0.05, **p < 0.005, ***p < 0.001)
Fig. 2
Fig. 2
Therapeutic effects of L. acidophilus in SS. L. acidophilus was administered orally to NOD mice, which were monitored for 24 weeks. Salivary glands and the spleen were harvested. A Saliva flow rate at 12, 16, 20, and 24 weeks. B Salivary glands were stained with H&E. The histological score (left) and inflammation area (right) are shown. C Salivary gland tissues were stained for IL-6, IL-17, and TNF-α. Numbers of cells positive for IL-6 (left), IL-17 (center), and TNF-α (right) are shown. D Splenocytes (top) and salivary glands (bottom) analyzed by flow cytometry for percentages of Th1 (CD4+IFN-γ+), Th2 (CD4+IL-4+), Th17 (CD4+IL-17+), and B17 (CD19+IL-17+) cells. E Salivary glands were analyzed by confocal microscopy. Representative images of Th17 (CD4+IL-17+; top) and Treg (CD4+CD25+FOXP3.+; bottom) cells are shown. Bar graphs show the numbers of cells positive for Th17 and Treg. Data are means ± SD (*p < 0.05, **p < 0.005, ***p < 0.001)
Fig. 3
Fig. 3
Regulation of SINGR3 expression by L. acidophilus. Salivary glands were harvested from the vehicle and L. acidophilus groups. A Representative images of SINGR3-positive cells in salivary glands and average numbers of SINGR3-positive cells. B Representative images of IL-10-positive cells in salivary glands and average numbers of IL-10-positive cells. C HSG cells were stimulated with TNF-α (2 ng/mL) and IL-17 (20 ng/mL) in the absence or presence of L. acidophilus (10 or 100 µg/mL) for 48 h and harvested for mRNA extraction and real-time PCR. Bar graphs show mRNA levels of SINGR3 (top and left), PD-L1 (top and right), IDO (bottom and left), and IL-10 (bottom and right). D Mouse non-T cells from the spleen were stimulated with LPS (100 ng/mL) in the absence or presence of L. acidophilus (10 or 100 µg/mL) for 48 h and harvested for mRNA extraction and real-time PCR. mRNA levels of SINGR3 (top and left), PD-L1 (top and right), IDO (bottom and left), and IL-10 (bottom and right) are shown. E Representative images of STIM1 in the salivary gland and average numbers of STIM1-positive cells. F Representative images of phosphor-STING in the salivary gland and average numbers of phosphor-STING-positive cells. G Splenocytes were stimulated with anti-CD3 (0.5 µg/mL) in the absence or presence of L. acidophilus (10 or 100 µg/mL) for 48 h and harvested for flow cytometry. FACS plots show percentages of type I IFN–producing dendritic cells. H Bar graphs show average percentages of type I IFN–positive cells. Data are means ± SD (*p < 0.05, ***p < 0.001)
Fig. 4
Fig. 4
L. acidophilus affects the gut microbiota. Cecal microbiome analyses of the vehicle and L. acidophilus groups. A Bacteroides:Firmicutes ratio. B Chao1 and ACE indices. C Shannon and Simpson diversity indices. D Composition of gut microbiota at the family level (top). Bar graphs at the bottom show the abundance of Ruminococcaceae (left), Clostridiaceae (center), and Prevotellaceae (right). Data are means ± SD (*p < 0.05, **p < 0.005, ***p < 0.001)
Fig. 5
Fig. 5
Therapeutic effects of propionate in SS. Propionate (200 mg/kg) was administered intraperitoneally to 12-week-old NOD mice, which were monitored for 24 weeks. Salivary glands and the spleen were harvested. A Saliva flow rate at 12, 16, 19, and 23 weeks. B Salivary glands were stained with H&E. Bar graphs show the histological score (left) and inflammation area (right). C Salivary gland tissue stained for IL-6, IL-17, and TNF-α and numbers of cells positive for IL-6 (left), IL-17 (center), and TNF-α (right). D Salivary glands were visualized by confocal microscopy. Representative images of Th17 (CD4+IL-17+; top) and Treg (CD4+CD25+FOXP3.+; bottom) cells are shown. Bar graphs show numbers of Th17- and Treg-positive cells. Data are means ± SD (*p < 0.05, **p < 0.005, ***p < 0.001)
Fig. 6
Fig. 6
Propionate regulates expression of STIM1 and STING. Salivary gland tissue was stained for STIM1 and phospho-STING. A Representative images of STIM1 in the salivary gland and average numbers of STIM1-positive cells. B Representative images of phosph0-STING in the salivary gland and average numbers of phosphor-STING-positive cells. C Splenocytes were stimulated with anti-CD3 (0.5 µg/mL) in the absence or presence of propionate (0.2 or 1 mM) for 48 h and harvested for flow cytometry. FACS plots show percentages of type I IFN–positive cells. Bar graphs show average percentages of type I IFN–producing dendritic cells. D Percentages of Th1 (CD4+IFN-γ+) and Th17 (CD4+IL-17.+) cells. Data are means ± SD (*p < 0.05, ***p < 0.001)

References

    1. Murube J. Henrik Sjogren, 1899–1986. Ocul Surf. 2010;8(1):2–7. doi: 10.1016/S1542-0124(12)70212-4. - DOI - PubMed
    1. Nguyen CQ, Yin H, Lee BH, Carcamo WC, Chiorini JA, Peck AB. Pathogenic effect of interleukin-17A in induction of Sjogren's syndrome-like disease using adenovirus-mediated gene transfer. Arthritis Res Ther. 2010;12(6):R220. doi: 10.1186/ar3207. - DOI - PMC - PubMed
    1. Kakan SS, Edman MC, Yao A, Okamoto CT, Nguyen A, Hjelm BE, et al. Tear miRNAs identified in a murine model of Sjogren's Syndrome as potential diagnostic biomarkers and indicators of disease mechanism. Front Immunol. 2022;13:833254. doi: 10.3389/fimmu.2022.833254. - DOI - PMC - PubMed
    1. Brito-Zeron P, Baldini C, Bootsma H, Bowman SJ, Jonsson R, Mariette X, et al. Sjogren syndrome. Nat Rev Dis Primers. 2016;2:16047. doi: 10.1038/nrdp.2016.47. - DOI - PubMed
    1. Soret P, Le Dantec C, Desvaux E, Foulquier N, Chassagnol B, Hubert S, et al. A new molecular classification to drive precision treatment strategies in primary Sjogren's syndrome. Nat Commun. 2021;12(1):3523. doi: 10.1038/s41467-021-23472-7. - DOI - PMC - PubMed

Publication types