. 2023 Jun 14;20(1):78.
doi: 10.1186/s12984-023-01198-5.

Assessing real-world gait with digital technology? Validation, insights and recommendations from the Mobilise-D consortium

Affiliations

Assessing real-world gait with digital technology? Validation, insights and recommendations from the Mobilise-D consortium

M Encarna Micó-Amigo et al. J Neuroeng Rehabil. .

Erratum in

  • Correction: Assessing real-world gait with digital technology? Validation, insights and recommendations from the Mobilise-D consortium.
    Micó-Amigo ME, Bonci T, Paraschiv-Ionescu A, Ullrich M, Kirk C, Soltani A, Küderle A, Gazit E, Salis F, Alcock L, Aminian K, Becker C, Bertuletti S, Brown P, Buckley E, Cantu A, Carsin AE, Caruso M, Caulfield B, Cereatti A, Chiari L, D'Ascanio I, Eskofier B, Fernstad S, Froehlich M, Garcia-Aymerich J, Hansen C, Hausdorff JM, Hiden H, Hume E, Keogh A, Kluge F, Koch S, Maetzler W, Megaritis D, Mueller A, Niessen M, Palmerini L, Schwickert L, Scott K, Sharrack B, Sillén H, Singleton D, Vereijken B, Vogiatzis I, Yarnall AJ, Rochester L, Mazzà C, Del Din S; Mobilise-D consortium. Micó-Amigo ME, et al. J Neuroeng Rehabil. 2024 May 3;21(1):71. doi: 10.1186/s12984-024-01361-6. J Neuroeng Rehabil. 2024. PMID: 38702693 Free PMC article. No abstract available.

Abstract

Background: Although digital mobility outcomes (DMOs) can be readily calculated from real-world data collected with wearable devices and ad-hoc algorithms, technical validation is still required. The aim of this paper is to comparatively assess and validate DMOs estimated using real-world gait data from six different cohorts, focusing on gait sequence detection, foot initial contact detection (ICD), cadence (CAD) and stride length (SL) estimates.

Methods: Twenty healthy older adults, 20 people with Parkinson's disease, 20 with multiple sclerosis, 19 with proximal femoral fracture, 17 with chronic obstructive pulmonary disease and 12 with congestive heart failure were monitored for 2.5 h in the real-world, using a single wearable device worn on the lower back. A reference system combining inertial modules with distance sensors and pressure insoles was used for comparison of DMOs from the single wearable device. We assessed and validated three algorithms for gait sequence detection, four for ICD, three for CAD and four for SL by concurrently comparing their performances (e.g., accuracy, specificity, sensitivity, absolute and relative errors). Additionally, the effects of walking bout (WB) speed and duration on algorithm performance were investigated.

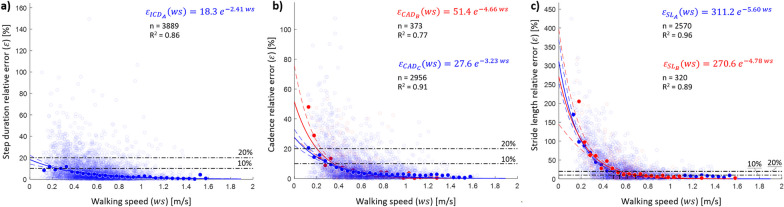
Results: We identified two cohort-specific top performing algorithms for gait sequence detection and CAD, and a single best for ICD and SL. Best gait sequence detection algorithms showed good performances (sensitivity > 0.73, positive predictive values > 0.75, specificity > 0.95, accuracy > 0.94). ICD and CAD algorithms presented excellent results, with sensitivity > 0.79, positive predictive values > 0.89 and relative errors < 11% for ICD and < 8.5% for CAD. The best identified SL algorithm showed lower performances than other DMOs (absolute error < 0.21 m). Lower performances across all DMOs were found for the cohort with most severe gait impairments (proximal femoral fracture). Algorithms' performances were lower for short walking bouts; slower gait speeds (< 0.5 m/s) resulted in reduced performance of the CAD and SL algorithms.

Conclusions: Overall, the identified algorithms enabled a robust estimation of key DMOs. Our findings showed that the choice of algorithm for estimation of gait sequence detection and CAD should be cohort-specific (e.g., slow walkers and with gait impairments). Short walking bout length and slow walking speed worsened algorithms' performances. Trial registration ISRCTN - 12246987.

Keywords: Accelerometer; Algorithms; Cadence; DMOs; Digital health; Real-world gait; SL; Validation; Walking; Wearable sensor.


Conflict of interest statement

A. Mueller and F. Kluge are employees of, and may hold stock in, Novartis. B. Eskofier reports consulting activities with adidas AG, Siemens AG, Siemens Healthineers AG, WSAudiology GmbH outside of the study. He is a shareholder in Portabiles HealthCare Technologies GmbH. In addition, Dr. Eskofier holds a patent related to gait assessment. H. Sillén is an employee of, and may hold stock in, AstraZeneca. M. Froelich is an employee of Grunenthal. L. Palmerini and L. Chiari are co-founders and own shares of mHealth Technologies (https://mhealthtechnologies.it/). L. Schwickert and C. Becker are consultants of Philipps Healthcare, Bosch Healthcare, Eli Lilly, Gait-up. M. Niessen is an employee of McRoberts. Jeff Hausdorff reports having submitted a patent for assessment of mobility using wearable sensors in 400 PD.

Figures

Fig. 1
Fig. 1
Example of identification of False Positive (FP), False Negative (FN), True Positive (TP) and True Negative (TN) for the Gait Sequence Detection (GSD) algorithms, of each window (0.1 s). Events classified from the comparison of each individual window between the INDIP reference system (RS) and the single wearable device (WD) for the detection of gait sequences. Each window of the WD and RS outputs are depicted as a rectangle, where white rectangles represent windows of non-gait sequences, and grey rectangles denote windows of a detected gait sequence
Fig. 2
Fig. 2
Example of performance analysis for initial contact detection (ICD) algorithms. The figure shows Initial contacts events identified by the reference system (IC-RS, depicted in black solid line) and initial contacts events identified by the single wearable device (IC-WD, depicted in orange dotted line). False Negatives, False Positive and True Positive events are defined with respect to the selected temporal tolerance window of 0.5 s (in grey) centred around the IC-RS. a Shows the identification of False Negative events (i.e., initial contact identified by the reference system but not identified by the single wearable device within the tolerance window) and False Positive events (i.e., initial contact wrongly identified by the single wearable device because although identified, it is outside the tolerance window). b Shows the identification of True Positives events (i.e., initial contact events correctly identified by the single wearable device) and example of other cases for identification of False Positive events (i.e., initial contact wrongly identified by the single wearable device). Note that the initial contact event, identified by the single wearable device, nearest to the true event (identified by the INDIP) will be considered a True Positive, and the rest of the identified events, False Positives. The figure also shows in blue how absolute errors are calculated only from True Positive events
Fig. 3
Fig. 3
Effect of walking speed on the relative errors in a step duration, b CAD and c step length estimations. The empty shaded circles (n) represent the relative error for each walking bout when the selected algorithms are used (ICDA for all cohorts in blue; CADB for the congestive heart failure (CHF), chronic obstructive pulmonary disease (COPD), healthy adults (HA), multiple sclerosis (MS) and Parkinson’s disease (PD) cohorts in red; CADC for the proximal femoral fracture (PFF) cohort in blue; SLA for CHF, COPD, HA, PFF and PD in blue; and SLB for MS in red). The filled circles indicate the median relative errors quantified in consecutive walking speed (ws) windows of 0.05 m/s. The sizes of the filled circles have been calculated as the ratio between the number of empty shaded circles in a given walking speed window and the total number of empty shaded circles (i.e., all observations). The obtained exponential curves (represented in blue and red continuous lines) and equations are the result of a best-fit approach used to determine the association between walking speed and the calculated median errors; R2 values are also shown. The horizontal black dash-dotted lines visually indicate the relative error thresholds of 10 and 20%
Fig. 4
Fig. 4
Effect of walking bout duration on the relative errors (ε) in a step duration, b cadence, and c step length estimations. For each parameter and the selected algorithms (ICDA for all cohorts; CADB for the congestive heart failure (CHF), chronic obstructive pulmonary disease (COPD), healthy adults (HA), multiple sclerosis (MS) and Parkinson’s disease (PD) cohorts; CADC for the proximal femoral fracture (PFF) cohort; SLA for CHF, COPD, HA, PFF and PD; and SLB for MS), the individual filled circles (n) represent the relative error for each WB, colour coded according to the walking speed measured for that specific bout. The empty grey circles indicate the median relative errors quantified in subsequent separate walking bout duration (wbd) windows of 2 s. Grey intensity represents the weight associated to the relevant observation, calculated as the ratio between the number of points in a given walking bout duration window and the total number of points, in the best-fit approach; a darker grey represents a larger weight. The black continuous lines and equations are the result of a best-fit approach used to determine the association between walking bout duration and the median errors; R2 values are also shown. The horizontal black dash-dotted lines visually indicate the relative error thresholds of 10% and 20%. For a clear visualization of the results, 95% of the walking bout duration have been reported

References

    1. Van Kan GA, Rolland Y, Andrieu S, Bauer J, Beauchet O, Bonnefoy M, et al. Gait speed at usual pace as a predictor of adverse outcomes in community-dwelling older people an International Academy on Nutrition and Aging (IANA) Task Force. J Nutr Health Aging. 2009;13(10):881–9. doi: 10.1007/s12603-009-0246-z. - DOI - PubMed
    1. Studenski S, Perera S, Patel K, Rosano C, Faulkner K, Inzitari M, et al. Gait speed and survival in older adults. JAMA. 2011;305(1):50–58. doi: 10.1001/jama.2010.1923. - DOI - PMC - PubMed
    1. Handoll HH, Sherrington C, Mak JC. Interventions for improving mobility after hip fracture surgery in adults. Cochrane Database Syst Rev. 2011 doi: 10.1002/14651858.CD001704.pub4. - DOI - PubMed
    1. Henderson EJ, Lord SR, Brodie MA, Gaunt DM, Lawrence AD, Close JC, et al. Rivastigmine for gait stability in patients with Parkinson’s disease (ReSPonD): a randomised, double-blind, placebo-controlled, phase 2 trial. Lancet Neurol. 2016;15(3):249–258. doi: 10.1016/S1474-4422(15)00389-0. - DOI - PubMed
    1. Mirelman A, Rochester L, Maidan I, Del Din S, Alcock L, Nieuwhof F, et al. Addition of a non-immersive virtual reality component to treadmill training to reduce fall risk in older adults (V-TIME): a randomised controlled trial. Lancet. 2016;388(10050):1170–1182. doi: 10.1016/S0140-6736(16)31325-3. - DOI - PubMed

Publication types

Associated data

LinkOut - more resources