. 2023 Jun 14;21(1):138.
doi: 10.1186/s12964-023-01157-6.

The tumor promoter cysteinyl leukotriene receptor 1 regulates PD-L1 expression in colon cancer cells via the Wnt/β-catenin signaling axis

Affiliations

The tumor promoter cysteinyl leukotriene receptor 1 regulates PD-L1 expression in colon cancer cells via the Wnt/β-catenin signaling axis

Shakti Ranjan Satapathy et al. Cell Commun Signal. .

Abstract

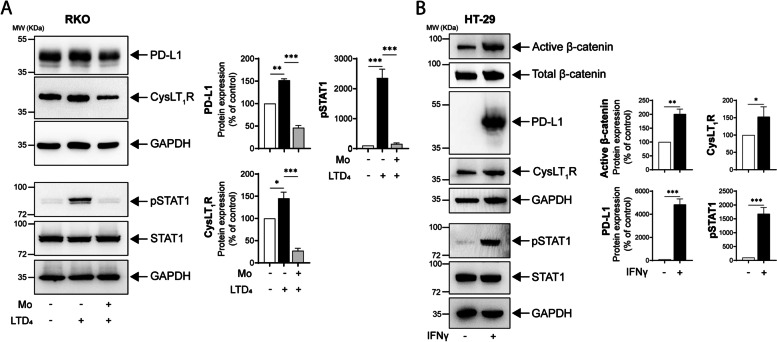
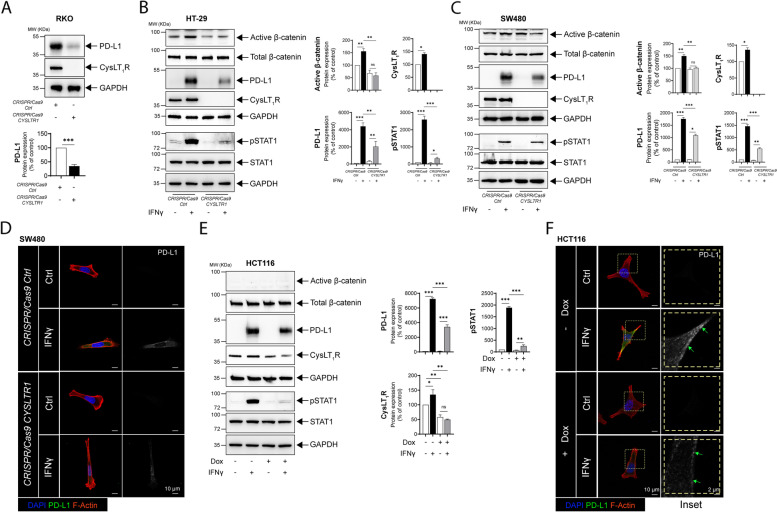
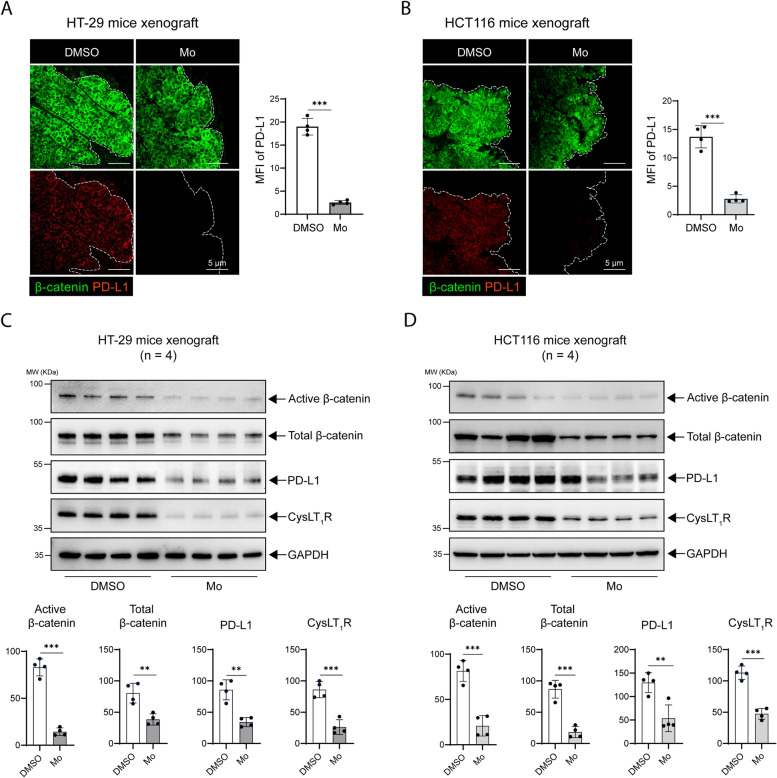
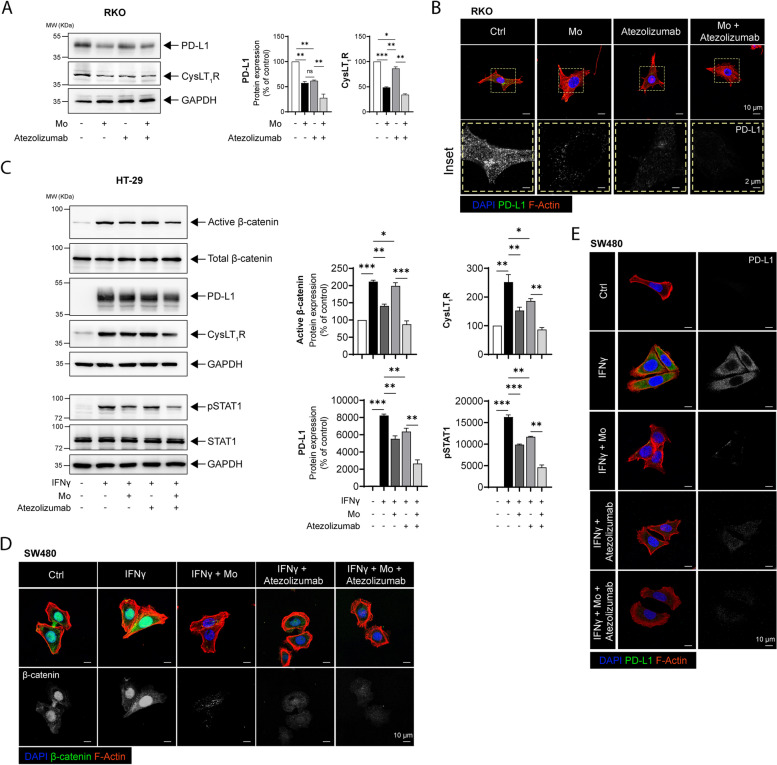
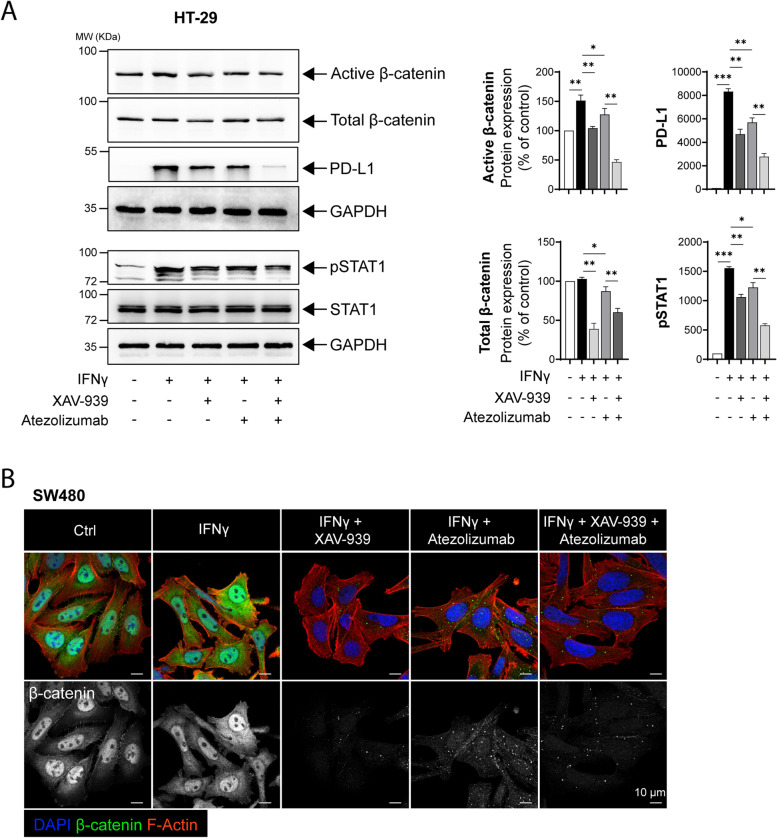
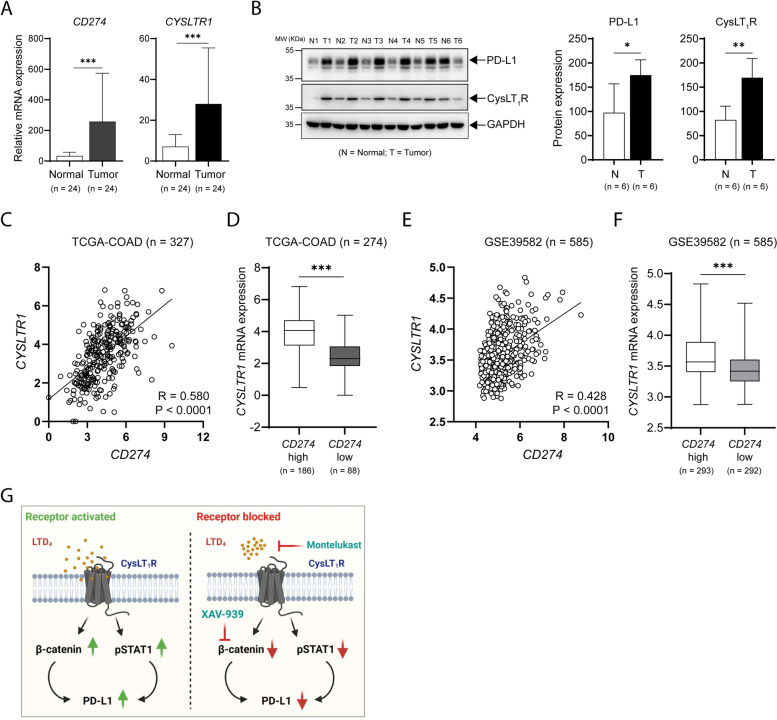
Immunotherapy targeting programmed death-ligand 1 (PD-L1) or PD-1 in solid tumors has been shown to be clinically beneficial. However, in colorectal cancer (CRC), only a subset of patients benefit from PD-1/PD-L1 treatment. Previously, we showed that high cysteinyl leukotriene receptor 1 (CysLT1R) levels are associated with poor prognosis in CRC patients. Recently, we have revealed the role of the tumor promoter CysLT1R in drug resistance and stemness in colon cancer (CC) cells. Here, we show the role of the CysLT1R/Wnt/β-catenin signaling axis in the regulation of PD-L1 using both in vitro and in vivo preclinical model systems. Interestingly, we found that both endogenous and IFNγ-induced PD-L1 expression in CC cells is mediated through upregulation of CysLT1R, which enhances Wnt/β-catenin signaling. Therapeutic targeting of CysLT1R with its antagonist montelukast (Mo), as well as CRISPR/Cas9-mediated or doxycycline-inducible functional absence of CysLT1R, negatively regulated PD-L1 expression in CC cells. Interestingly, an anti-PD-L1 neutralizing antibody exhibited stronger effects together with the CysLT1R antagonist in cells (Apcmut or CTNNB1mut) with either endogenous or IFNγ-induced PD-L1 expression. Additionally, mice treated with Mo showed depletion of PD-L1 mRNA and protein. Moreover, in CC cells with combined treatment of a Wnt inhibitor and an anti-PD-L1 antibody was effective only in β-catenin-dependent (APCmut) context. Finally, analysis of public dataset showed positive correlations between the PD-L1 and CysLT1R mRNA levels. These results elucidate a previously underappreciated CysLT1R/Wnt/β-catenin signaling pathway in the context of PD-L1 inhibition in CC, which might be considered for improving the efficacy of anti-PD-L1 therapy in CC patients. Video Abstract.

Keywords: Colon cancer; Cysteinyl leukotriene receptor; PD-L1; Wnt/β-catenin.


Conflict of interest statement

The authors declare no competing interests.

Figures

Fig. 1
Fig. 1
Treatment with the CysLT1R-specific antagonist Montelukast (Mo) reduces endogenous as well as IFNγ-induced PD-L1 expression in CC cells. A Western blots showing the expression of the indicated proteins in RKO CC cells stimulated with LTD4 (80 nM) with or without pretreatment with Mo (10 µM, 30 min). The blots are representative of three replicates, and the results are shown in the densitometry graphs. B Western blots showing alterations in the expression of the indicated proteins in HT-29 cells after IFNγ (50 ng/mL, 24 h) stimulation. The blots are representative of three replicates, and the results are shown in the densitometry graphs. In all the western blot panels, GAPDH served as the loading control. Mean ± SEM. *P < 0.05, ***P < 0.001, two-tailed unpaired t test. MW, relative molecular weight expressed in kilodaltons (kDa)
Fig. 2
Fig. 2
CysLT1R regulates PD-L1 expression in CC cells. A Western blots showing the expression of the indicated proteins in RKO cells transfected with CRISPR/Cas9-Ctrl or CRISPR/Cas9-CYSLTR1. The blots are representative of three replicates, and the results are shown in the densitometry graph. Western blots showing the expression of the indicated proteins in B HT-29, and C SW480 cells transfected with CRISPR/Cas9-Ctrl or CRISPR/Cas9-CYSLTR1 with or without IFNγ stimulation. Densitometric comparison was made between unstimulated and IFNγ-stimulated cells. The blots are representative of three replicates, and the results for HT-29 and SW480 cells are shown in the densitometry graphs. Immunofluorescence images showing PD-L1 expression following treatment of D SW480 cells transfected with CRISPR/Cas9-Ctrl or CRISPR/Cas9-CYSLTR1 prior to IFNγ stimulation. Bars, 10 μm. The right panel contains images showing the grayscale representation of PD-L1 expression in the different groups. E Western blot showing the relative expression of the indicated proteins in HCT116 cells with doxycycline (Dox)-inducible conditional knockdown of CYSLTR1. The blots are representative of three replicates, and the results are shown in the densitometry graphs. F Immunofluorescence images showing the expression of PD-L1 in HCT116 cells with doxycycline-inducible conditional knockdown of CYSLTR1 with or without IFNγ stimulation. The magnified images are grayscale images (inset) of PD-L1 in the region of interest marked with the yellow dotted line. Bars, 10 μm or 2 µm as indicated in the images. In all the western blot panels, GAPDH served as the loading control. MW, relative molecular weight expressed in kilodaltons (kDa). Mean ± SEM. *P < 0.05, ***P < 0.001, two-tailed unpaired t test
Fig. 3
Fig. 3
Antagonizing CysLT1R affects PD-L1 expression in different mouse xenograft models. Immunofluorescence images showing the expression of β-catenin (green) and PD-L1 (red) in A HT-29 and B HCT116 xenografts in mice treated with DMSO or Montelukast (Mo). Representative graphs showing the MFI (Mean fluorescence intensity) of PD-L1 (n = 4 mice per group in each xenograft condition). The scale bars are indicated in the images. The white dotted line marks the border of the xenograft section. Western blots of C HT-29 cell xenografts and D HCT116 cell xenografts. The blots show the expression of the indicated proteins of interest. Representative densitometric analysis results are shown in the graphs for HT-29 and HCT116 cells. In all the western blot panels, GAPDH served as the loading control. MW, relative molecular weight expressed in kilodaltons (kDa). The MFI in all confocal images was calculated with ImageJ software (NIH, USA). Mean ± SEM, *P < 0.05, ***P < 0.001, two-tailed unpaired t test
Fig. 4
Fig. 4
The CysLT1R-specific antagonist Mo shows combinatorial effects with an anti-PD-L1 neutralizing antibody. A Western blots showing the expression of the indicated proteins in RKO CC cells treated with Montelukast (Mo, 10 µM) or Atezolizumab (20 ng/mL) alone or together. The blots are representative of three replicates, and the results are shown in the densitometry graphs. B Immunofluorescence images showing PD-L1 expression in RKO cells. Cells were stimulated with Mo (10 µM) for 30 min or Atezolizumab (20 ng/mL) for 24 h alone or in combination with pretreatment with Mo (10 µM, 30 min) followed by Atezolizumab ( 20 ng/mL) for 24 h. The left panel shows the merged confocal images in each group with nuclear staining (DAPI, blue), PD-L1 staining (pseudocolored, green), and cytoskeleton staining (phalloidin, red), and the right column (insets) shows PD-L1 expression alone (grayscale) magnified from the region of interest marked by the yellow dotted line. The scale bars are indicated in the micrographs. C Western blots showing the expression of the indicated proteins in IFNγ-stimulated (50 ng/mL, 24 h) HT-29 cells subsequently treated with Mo or Atezolizumab alone or together (Mo + Atezolizumab). The blots are representative of three replicates, and the results are shown in the densitometry graphs. Immunofluorescence images showing the protein levels of D PD-L1 and E active β-catenin in IFNγ-stimulated SW480 cells subsequently treated with Atezolizumab alone or together with Montelukast (Mo + Atezolizumab). Bars, 10 µm. In all western blot panels, GAPDH served as the loading control. MW, relative molecular weight expressed in kilodaltons (kDa). Mean ± SEM. *P < 0.05, ***P < 0.001, two-tailed unpaired t test
Fig. 5
Fig. 5
Directly antagonizing the Wnt/β-catenin axis negatively impacts PD-L1 expression. A Western blots showing the expression of the indicated proteins in HT-29 CC cells with or without prestimulation (IFNγ 50 ng/mL, 24 h). IFNγ-stimulated cells were further exposed to XAV-939 (Wnt inhibitor, 10 µM) or Atezolizumab alone or both together. The blots are representative of three replicates, and the results are shown in the densitometry graphs. B Immunofluorescence images showing the active β-catenin level in IFNγ-stimulated SW480 cells subsequently treated with XAV-939 (XAV) or Atezolizumab alone or in combination (XAV + Atezolizumab). Bars, 10 μm or 2 µm, as indicated in the images. The magnified images are grayscale images (inset) of active β-catenin in the region of interest marked with the white dotted line. In all the western blot panels, GAPDH served as the loading control. MW, relative molecular weight expressed in kilodaltons (kDa). Mean ± SEM. *P < 0.05, ***P < 0.001, two-tailed unpaired t test
Fig. 6
Fig. 6
PD-L1 expression positively correlates with CysLT1R and β-catenin expression. A Bar graphs showing the relative mRNA expression levels of the indicated transcripts in matched normal and tumor tissues of CC patients (n = 24). B Western blots showing the expression of the indicated proteins in matched normal and tumor tissues of CC patients (n = 6). MW, relative molecular weight expressed in kilodaltons (kDa). Pearson correlation plots showing the positive correlation between the transcript levels of CYSLTR1 and CD274 in C TCGA-COAD cohort (n = 327) and E GSE39582 cohort (n = 585) of CC patients. Graphs showing CYSLTR1 mRNA expression in CC patients with high or low CD274 mRNA expression in the D TCGA-COAD cohort (n = 274) and F GSE39582 cohort of CC patients (n = 585). G Schematic summary showing alterations in the expression of the indicated proteins when CysLT1 is activated or blocked. The number of patients in each subgroup is shown in the figure. Mean ± SEM. *P < 0.05, ***P < 0.001, Mann‒Whitney U test

Similar articles

Cited by

References

    1. Siegel RL, Miller KD, Goding Sauer A, Fedewa SA, Butterly LF, Anderson JC, et al. Colorectal cancer statistics, 2020. CA Cancer J Clin. 2020;70:145–164. doi: 10.3322/caac.21601. - DOI - PubMed
    1. Siegel RL, Miller KD, Jemal A. Cancer statistics, 2020. CA Cancer J Clin. 2020;70:7–30. doi: 10.3322/caac.21590. - DOI - PubMed
    1. Zou W, Wolchok JD, Chen L. PD-L1 (B7-H1) and PD-1 pathway blockade for cancer therapy: Mechanisms, response biomarkers, and combinations. Sci Transl Med. 2016;8:328rv324. - PMC - PubMed
    1. Brahmer JR, Tykodi SS, Chow LQ, Hwu WJ, Topalian SL, Hwu P, et al. Safety and activity of anti-PD-L1 antibody in patients with advanced cancer. N Engl J Med. 2012;366:2455–2465. doi: 10.1056/NEJMoa1200694. - DOI - PMC - PubMed
    1. Topalian SL, Hodi FS, Brahmer JR, Gettinger SN, Smith DC, McDermott DF, et al. Safety, activity, and immune correlates of anti-PD-1 antibody in cancer. N Engl J Med. 2012;366:2443–2454. doi: 10.1056/NEJMoa1200690. - DOI - PMC - PubMed

Publication types