. 2023 Jun 14;21(1):134.
doi: 10.1186/s12964-023-01138-9.

Inhibiting HIF-1 signaling alleviates HTRA1-induced RPE senescence in retinal degeneration

Affiliations

Inhibiting HIF-1 signaling alleviates HTRA1-induced RPE senescence in retinal degeneration

Wenchang Xu et al. Cell Commun Signal. .

Abstract

Background: Age-related macular degeneration (AMD), characterized by the degeneration of retinal pigment epithelium (RPE) and photoreceptors, is the leading cause of irreversible vision impairment among the elderly. RPE senescence is an important contributor to AMD and has become a potential target for AMD therapy. HTRA1 is one of the most significant susceptibility genes in AMD, however, the correlation between HTRA1 and RPE senescence hasn't been investigated in the pathogenesis of AMD.

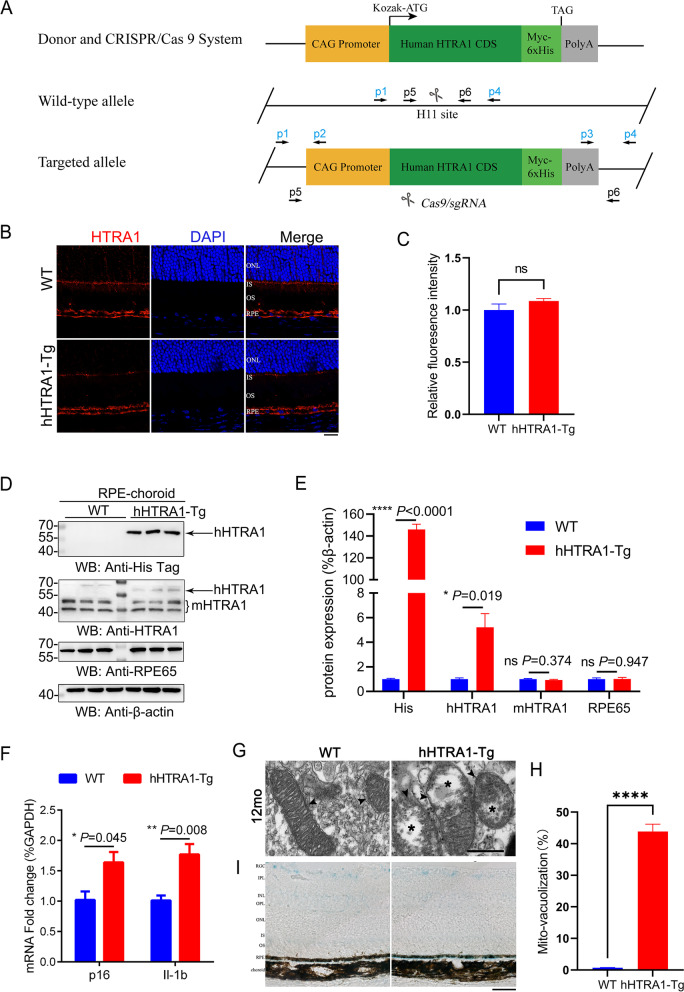
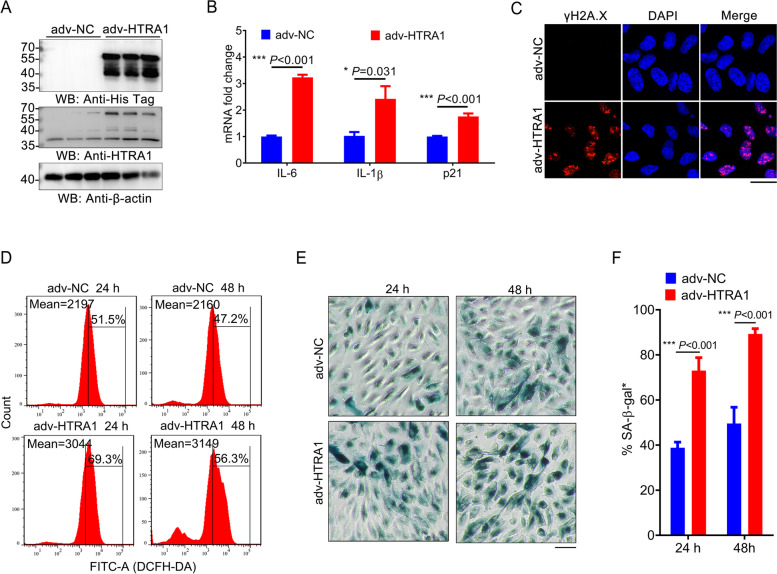
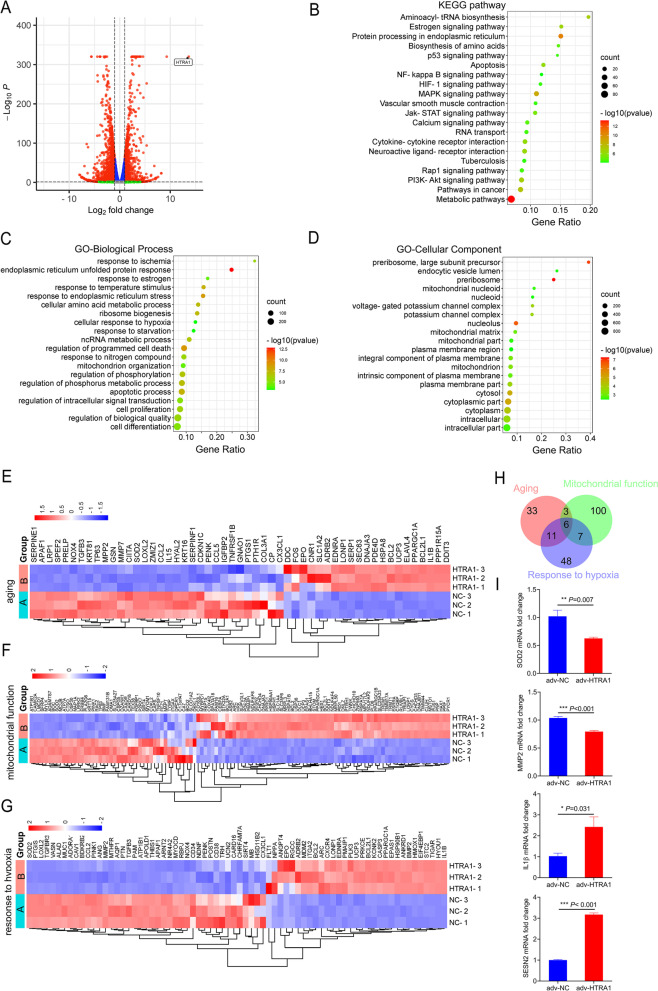
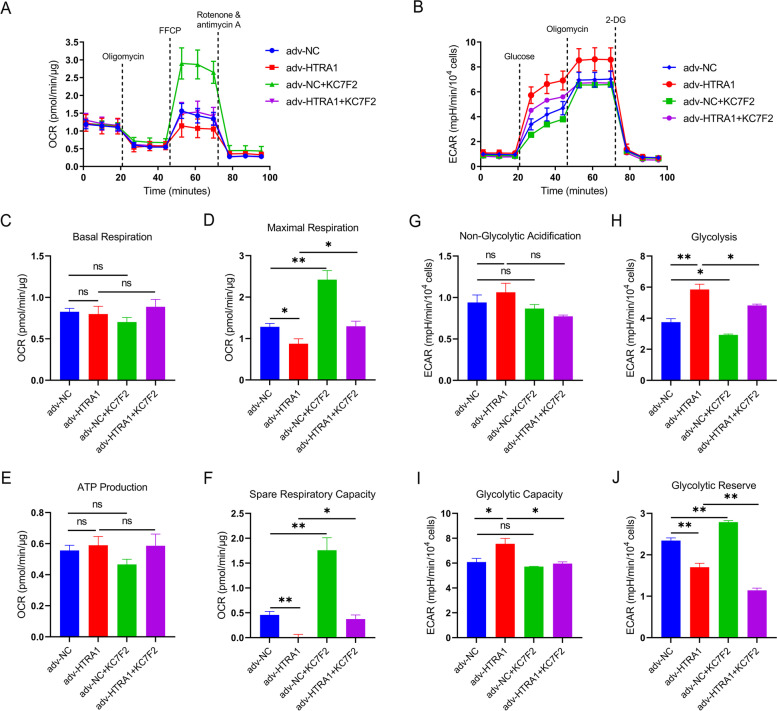
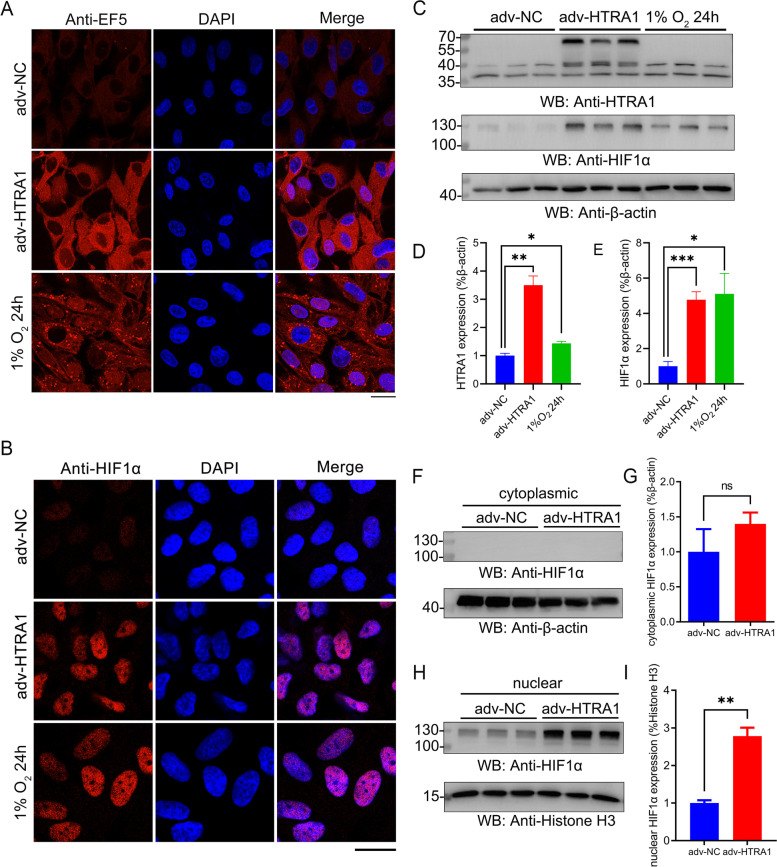
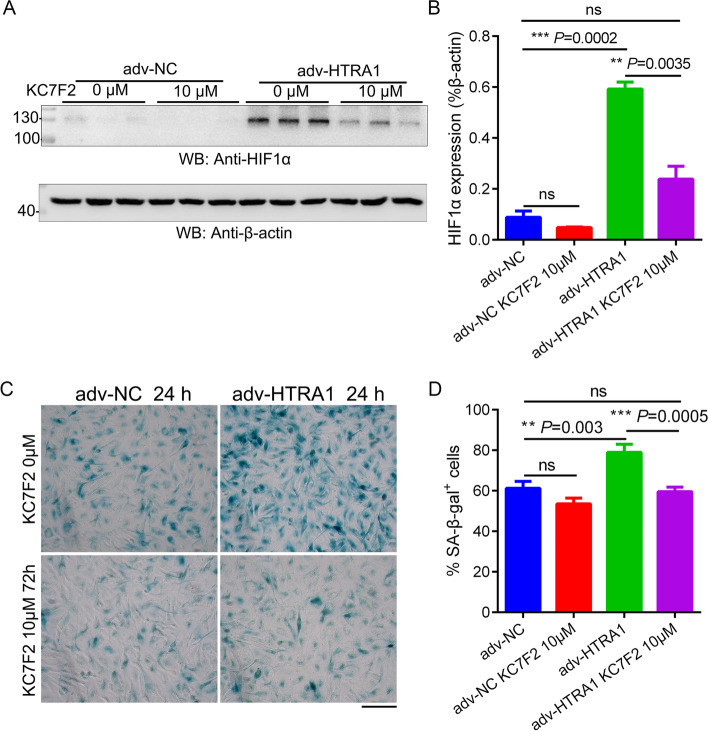
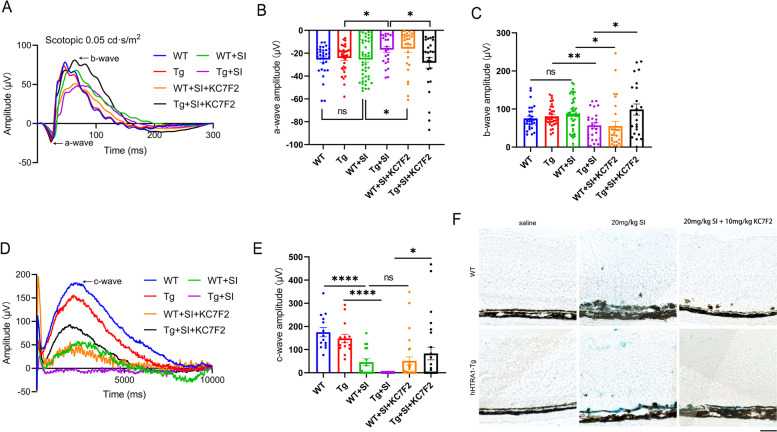
Methods: Western blotting and immunohistochemistry were used to detect HTRA1 expression in WT and transgenic mice overexpressing human HTRA1 (hHTRA1-Tg mice). RT-qPCR was used to detect the SASP in hHTRA1-Tg mice and ARPE-19 cells infected with HTRA1. TEM, SA-β-gal was used to detect the mitochondria and senescence in RPE. Retinal degeneration of mice was investigated by fundus photography, FFA, SD-OCT and ERG. The RNA-Seq dataset of ARPE-19 cells treated with adv-HTRA1 versus adv-NC were analyzed. Mitochondrial respiration and glycolytic capacity in ARPE-19 cells were measured using OCR and ECAR. Hypoxia of ARPE-19 cells was detected using EF5 Hypoxia Detection Kit. KC7F2 was used to reduce the HIF1α expression both in vitro and in vivo.

Results: In our study, we found that RPE senescence was facilitated in hHTRA1-Tg mice. And hHTRA1-Tg mice became more susceptible to NaIO3 in the development of oxidative stress-induced retinal degeneration. Similarly, overexpression of HTRA1 in ARPE-19 cells accelerated cellular senescence. Our RNA-seq revealed an overlap between HTRA1-induced differentially expressed genes associated with aging and those involved in mitochondrial function and hypoxia response in ARPE-19 cells. HTRA1 overexpression in ARPE-19 cells impaired mitochondrial function and augmented glycolytic capacity. Importantly, upregulation of HTRA1 remarkably activated HIF-1 signaling, shown as promoting HIF1α expression which mainly located in the nucleus. HIF1α translation inhibitor KC7F2 significantly prevented HTRA1-induced cellular senescence in ARPE-19 cells, as well as improved the visual function in hHTRA1-Tg mice treated with NaIO3.

Conclusions: Our study showed elevated HTRA1 contributes to the pathogenesis of AMD by promoting cellular senescence in RPE through damaging mitochondrial function and activating HIF-1 signaling. It also pointed out that inhibition of HIF-1 signaling might serve as a potential therapeutic strategy for AMD. Video Abstract.

Keywords: Age-related macular degeneration; Cell senescence; HIF1α; HTRA1; Hypoxia; Retinal pigment epithelium.


Conflict of interest statement

The authors declare no competing interests.

Figures

Fig. 1
Fig. 1
HTRA1 overexpression aggravated RPE senescence in mice. A The strategy for creating transgenic mice with human HTRA1 knock-in (hHTRA1-Tg). B Immunofluorescent analysis of retinal HTRA1 expression in 6- to 8-week-old WT and hHTRA1-Tg mice (the scale bar is 20 μm) (n = 3). ONL, outer nuclear layer; IS, photoreceptor inner segment; OS, photoreceptor outer segment; RPE, retinal pigment epithelium. C Statistical analysis of relative fluorescence intensity in B. D Western blot analysis of HTRA1 and RPE65 expression in RPE-choroid of 6- to 8-week-old WT and hHTRA1-Tg mice. E Statistical analysis of the relative expression of HTRA1 and RPE65 in each group of D. F RT-qPCR analysis of p16 and Il-1β expression in RPE-choroid of 6- to 8-week-old WT and hHTRA1-Tg mice. G TEM images of mitochondria in RPE (the scale bar is 500 nm, n = 3). Arrowheads indicated normal mitochondria and asterisks indicated vacuolated changes in mitochondria. H Statistical analysis of mitochondrial vacuolization in RPE. I Retinal SA-β-gal staining in 12-month-old WT and hHTRA1-Tg mice (the scale bar is 50 μm, n = 3). RGC, retinal ganglion cell; IPL, inner plexiform layer; INL, inner nuclear layer; OPL, outer plexiform layer; ONL, outer nuclear layer; IS, photoreceptor inner segment; OS, photoreceptor outer segment; RPE, retinal pigment epithelium
Fig. 2
Fig. 2
hHTRA1-Tg mice became more susceptible to NaIO3 in the development of retinal degeneration. A Representative fundus image, FFA and OCT of WT and hHTRA1-Tg mice with an intraperitoneal injection of 20 mg/kg NaIO3 or similar volume of physiological saline. The left set showed the mice without obvious retinal degeneration and the right showed the mice with retinal degeneration. B The histogram showed the number of WT and hHTRA1-Tg mice with or without retinal degeneration after being treated with 20 mg/kg NaIO3 (82 WT mice was detected, 27 out of 31 female mice and 21 out of 51 male mice showed retinal degeneration. 61 Tg mice was detected, 25 out of 30 female mice and 25 out of 31 male mice showed retinal degeneration). C Statistical analysis of the whole retinal thickness. D Representative a-wave and b-wave ERG traces of 6- to 10-week-old hHTRA1-Tg (n = 10) and WT mice (n = 22) on the fourth day after intraperitoneal injection of 20 mg/kg NaIO3. Flash intensity was 0.05 cd·s/m2. E Statistical analysis of a-wave amplitudes for WT and hHTRA1-Tg mice (P = 0.038). F Statistical analysis of b-wave amplitudes for WT and hHTRA1-Tg mice (P = 0.001). G Representative c-wave ERG traces of 6- to 10-week-old hHTRA1-Tg (n = 9) and WT mice (n = 8) on the fourth day after intraperitoneal injection of 20 mg/kg NaIO3. H Statistical analysis of c-wave amplitudes for WT and hHTRA1-Tg mice (P = 0.003). I Western blot analysis of RPE65 expression in RPE-choroid of WT and hHTRA1-Tg mice. J Western blot analysis of RPE65 expression in RPE-choroid of WT and hHTRA1-Tg mice treated with 20 mg/kg NaIO3. K. Statistical analysis of the relative expression of RPE65 in each group of I, J
Fig. 3
Fig. 3
HTRA1 overexpression aggravated cellular senescence of ARPE-19 cells. A Western blot analysis of HTRA1 overexpression in ARPE-19 cells treated with adv-NC or adv-HTRA1 for 24 h. B RT-qPCR analysis of IL-1β, IL-6 and p21 expression in ARPE-19 cells treated with adv-NC or adv-HTRA1 for 24 h. C Immunofluorescent analysis of DNA damage by detecting the expression of γH2A.X in ARPE-19 cells treated with adv-NC or adv-HTRA1 for 24 h (the scale bar is 20 μm, n = 3). D Flow cytometry detection of ROS in ARPE-19 cells treated with adv-NC or adv-HTRA1 for 24 or 48 h. E SA-β-gal staining of ARPE-19 cells treated with adv-NC or adv-HTRA1 for 24 or 48 h (the scale bar is 50 μm). F Statistical analysis of the positive staining cells in each group in E
Fig. 4
Fig. 4
HTRA1 overexpression profoundly affected mitochondrial function and hypoxia-related signaling pathways in ARPE-19 cells. A Volcano plot representation of differentially expressed genes (DEGs) (log2 |fold change|> 1, log10 adjusted p-values < 0.05) in ARPE-19 cells treated with adv-HTRA1 versus adv-NC. B Bubble chart of KEGG pathway enrichment for up-regulated genes. C-D Bubble chart of GO enrichment for up-regulated genes, the distributions are summarized in two categories: biological process C and cellular component D. The color of the bubble means the significance of the corresponding pathway and the size of the bubble means the number of DEGs in this pathway. E-G Heatmap of 53 altered aging-related genes, 116 altered genes involved in mitochondrial function and 72 altered genes in response to hypoxia. H Venn diagram of the differentially expressed genes (DEGs) involved in aging (red), mitochondrial function (green) and response to hypoxia (blue), respectively. I RT-qPCR analysis of 4 differentially expressed genes (SOD2, MMP2, IL-1β and SESN2) from RNA-seq data
Fig. 5
Fig. 5
HTRA1 overexpression triggered the transition of cellular energy metabolism from oxidative phosphorylation to glycolysis in ARPE-19 cells. A Measurement of oxygen consumption rate (OCR) in ARPE-19 cells infected with adv-NC, adv-HTRA1, adv-NC + 10 µM KC7F2 or adv-HTRA1 + 10 µM KC7F2 respectively. Dotted lines indicated the time points of adding oligomycin, carbonyl cyanite-4 (trifluoromethoxy) phenylhydrazone (FCCP), and Rotenone/Antimycin A. C-F Statistical analysis of basal respiration (C), maximal respiration (D), ATP production (E) and spare respiratory capacity (F). B Measurement of extracellular acidification rate (ECAR) in ARPE-19 cells infected with adv-NC, adv-HTRA1, adv-NC + 10 µM KC7F2 or adv-HTRA1 + 10 µM KC7F2 respectively. Dotted lines indicated the time points of adding glucose, oligomycin and 2-DG. G-J Statistical analysis of non-glycolytic acidification (G), glycolysis (H), glycolytic capacity (I) and glycolytic reserve (J)
Fig. 6
Fig. 6
HTRA1 induced hypoxia in ARPE-19 cells. A Immunofluorescent analysis of EF5 expression in ARPE-19 cells treated with adv-NC or adv-HTRA1 for 24 h. Cells treated with 1% O2 for 24 h were used as a positive control (n = 3). B Immunofluorescent analysis of HIF1α expression in ARPE-19 cells treated with adv-NC or adv-HTRA1 for 24 h. Cells treated with 1% O2 for 24 h were used as a positive control (n = 3). C Western blot analysis of HTRA1 and HIF1α expression in ARPE-19 cells treated with adv-NC or adv-HTRA1 for 24 h. Cells treated with 1% O2 for 24 h were used as a positive control. D Statistical analysis of the relative expression of HTRA1. E Statistical analysis of the relative expression of HIF1α. F Western blot analysis of HIF1α expression of cytoplasmic protein extracted from ARPE-19 cells treated with adv-NC or adv-HTRA1 for 24 h. G Statistical analysis of the relative expression of HIF1α in cytoplasm. H Western blot analysis of HIF1α expression of nuclear protein extracted from ARPE-19 cells treated with adv-NC or adv-HTRA1 for 24 h. I Statistical analysis of the relative expression of HIF1α in nucleus
Fig. 7
Fig. 7
HIF1α translation inhibitor KC7F2 could halt HTRA1-enhanced cellular senescence. A Western blot analysis of HIF1α expression in ARPE-19 cells treated with adv-NC or adv-HTRA1 in the presence of HIF1α inhibitor KC7F2. B Statistical analysis of the relative expression of HIF1α. C SA-β-gal staining of ARPE-19 cells treated with adv-NC or adv-HTRA1 in the presence of HIF1α inhibitor KC7F2 (the scale bar is 50 μm, n = 3). D Statistical analysis of the positive staining cells in each group of C
Fig. 8
Fig. 8
The retinal degeneration induced by NaIO3 could be improved using HIF1α translation inhibitor KC7F2 in hHTRA1-Tg mice. A Representative a-wave and b-wave ERG traces of 6- to 10-week-old WT and hHTRA1-Tg mice on the fourth day after intraperitoneal injection of 20mg/kg NaIO3 with or without KC7F2 treatment. WT (n = 16), Tg (n = 17), WT+SI (n = 22), Tg+SI (n = 12), WT+SI+KC7F2 (n = 14), Tg+SI+KC7F2 (n = 13). Flash intensity was 0.05 cd·s/m2. B Statistical analysis of a-wave amplitudes of the 6 groups. C Statistical analysis of b-wave amplitudes of the 6 groups. D Representative c-wave ERG traces of the 6 groups. WT (n = 7), Tg (n = 7), WT+SI (n = 8), Tg+SI (n = 9), WT+SI+KC7F2 (n = 14), Tg+SI+KC7F2 (n = 13). Flash intensity was 150 cd·s/m2. E Statistical analysis of c-wave amplitudes of the 6 groups. F Retinal SA-β-gal staining in 6- to 10-week-old WT and hHTRA1-Tg mice on the fourth day after intraperitoneal injection of 20mg/kg NaIO3 with or without KC7F2 treatment (the scale bar is 50μm, n = 6)

References

    1. Mitchell P, et al. Age-related macular degeneration. Lancet. 2018;392(10153):1147–59. doi: 10.1016/S0140-6736(18)31550-2. - DOI - PubMed
    1. Apte RS. Age-related Macular Degeneration. N Engl J Med. 2021;385(6):539–47. doi: 10.1056/NEJMcp2102061. - DOI - PMC - PubMed
    1. Fritsche LG, et al. A large genome-wide association study of age-related macular degeneration highlights contributions of rare and common variants. Nat Genet. 2016;48(2):134–43. doi: 10.1038/ng.3448. - DOI - PMC - PubMed
    1. Eigenbrot C, et al. Structural and functional analysis of HtrA1 and its subdomains. Structure. 2012;20(6):1040–50. doi: 10.1016/j.str.2012.03.021. - DOI - PubMed
    1. Grassmann F, et al. Recombinant haplotypes narrow the ARMS2/HTRA1 Association Signal for Age-Related Macular Degeneration. Genetics. 2017;205(2):919–24. doi: 10.1534/genetics.116.195966. - DOI - PMC - PubMed

Publication types