. 2023 Aug;12(15):16310-16322.
doi: 10.1002/cam4.6247. Epub 2023 Jun 14.

Glucose metabolism and function of CD4+ Tregs are regulated by the TLR8/mTOR signal in an environment of SKOV3 cell growth

Affiliations

Glucose metabolism and function of CD4+ Tregs are regulated by the TLR8/mTOR signal in an environment of SKOV3 cell growth

Ming Wu et al. Cancer Med. 2023 Aug.

Abstract

Purpose: To investigate the role of mammalian target of rapamycin (mTOR) signal in Toll-like receptor (TLR) 8-mediated regulation of glucose metabolism and its effect on reversing immunosuppression in CD4+ regulatory T-cells (Tregs) in ovarian cancer (OC).

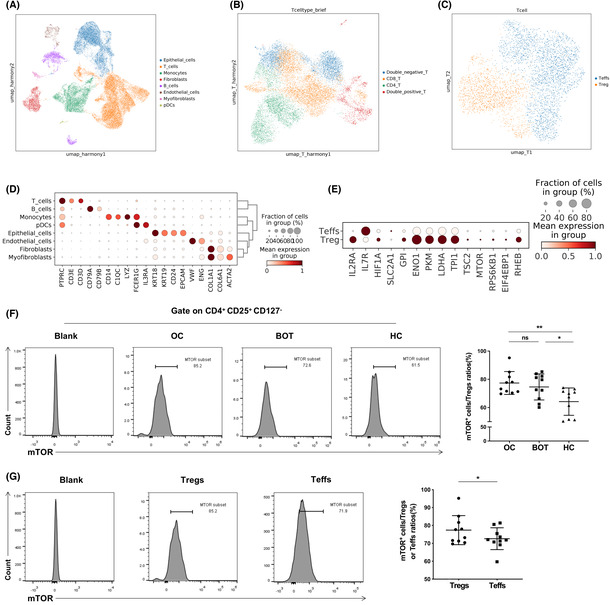
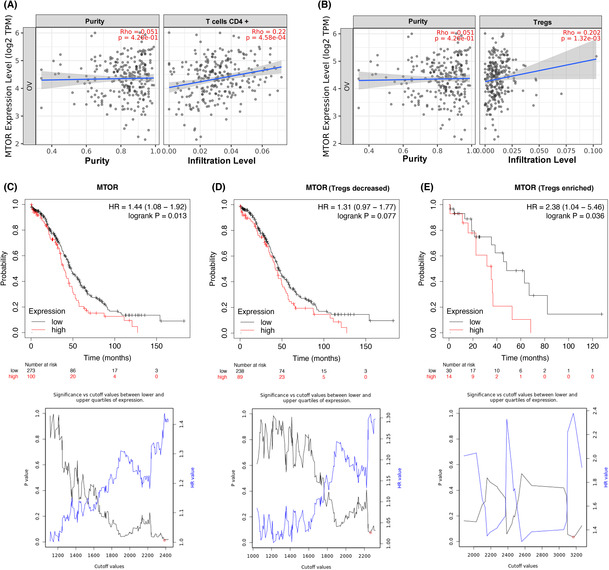
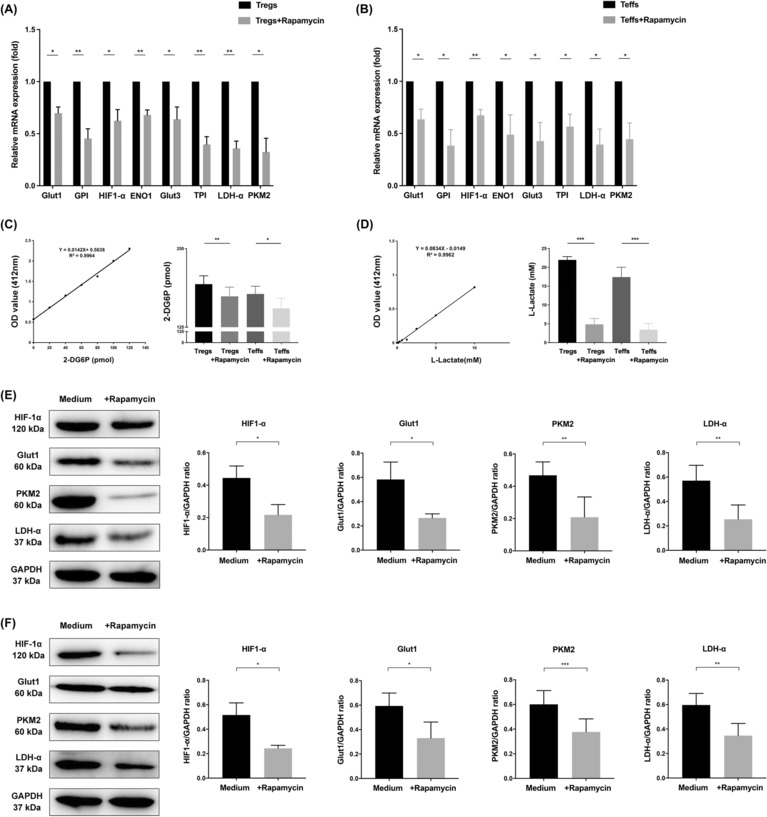
Methods: Fluorescence-activated cell sorting was used to detect the expression levels of mTOR+ and 4E-BP1+ cells in CD4+ Tregs. The prognosis and immune infiltration analysis of mTOR mRNA in OC were performed using the TIMER and Kaplan-Meier plotter database. Furthermore, real-time polymerase chain reaction (RT-PCR) and western blot (WB) were used to detect expression levels of glucose metabolism-related genes and proteins in CD4+ Tregs. Glucose uptake and glycolysis levels were detected by colorimetry, while the effects of CD4+ Tregs on the proliferation of CD4+ T-effector cells (Teffs) were evaluated by carboxyfluorescein diacetate succinimidyl ester (CFSE).

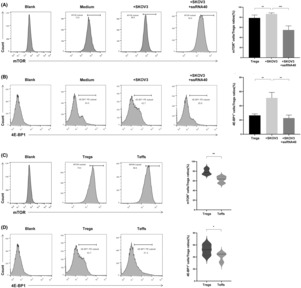
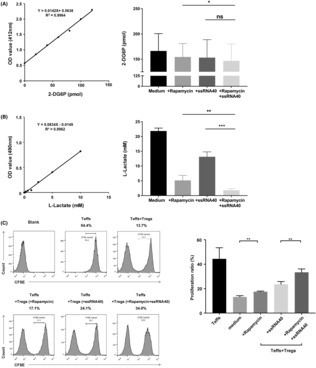
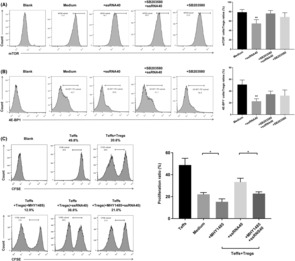
Results: mTOR expression in CD4+ Tregs was significantly higher in patients with OC compared with controls and in CD4+ Tregs than in CD4+ Teffs in OC. Additionally, the expression level of mTOR mRNA was related to prognosis and immune infiltration levels in patients with OC. Blocking the mTOR signal resulted in downregulation of glucose metabolism in CD4+ Tregs. Simultaneous inhibition of the mTOR signal while activation of the TLR8 signal had a coordinated inhibitory effect on glucose metabolism and the immunosuppressive function of CD4+ Tregs. Furthermore, the mTOR signal played an essential role in TLR8-mediated reversal of immunosuppressive function in CD4+ Tregs.

Conclusion: These findings imply that activation of the TLR8 signal inhibits glucose metabolism in CD4+ Tregs by downregulating mTOR signaling, thereby reversing the immunosuppressive function of these cells in an OC cell growth environment.

Keywords: Toll-like receptor 8; glucose metabolism; mammalian target of rapamycin; ovarian cancer; regulatory T-cells.


Conflict of interest statement

The authors declare that they have no conflict of interest.

Figures

FIGURE 1
FIGURE 1
Expression level of mTOR in CD4+ Tregs and Teffs. (A–C) The UMAP plot demonstrates the main cell types in ovarian cancer tissues according to the composition of the marker genes. (D, E) Dot plots showing the expression levels of specific marker genes in each cell type based on results of single‐cell sequencing. The size of dots indicates the proportion of cells expressing the particular marker gene. The spectrum of color represents the mean expression levels of the marker genes. (F) The expression level of mTOR factor in CD4+ Tregs of human ovarian cancer, benign ovarian cancer and healthy control peripheral blood, as detected via flow cytometry (n = 10). Left images are the representative flow cytometry analysis and plots are gate on CD4+CD25+CD127. Right bar diagram summarizes the expression ratios as the mean ± SEM; *p < 0.05, **p < 0.01. (G) Analysis of mTOR factor in CD4+ Tregs and Teffs of OC and plots are gate on CD4+CD25+CD127 or CD4+CD25CD127+ via flow cytometry (n = 10). Left images are the representative flow cytometric analysis and right bar diagram shows the proportions of mTOR in CD4+ Tregs and Teffs. Data are displayed as mean ± SEM; *p < 0.05.
FIGURE 2
FIGURE 2
Immune infiltration and prognosis of mTOR gene expression in patients with ovarian cancer. (A,B) The expression level of mTOR mRNA was positively correlated with CD4+ T‐cells and Tregs infiltration level after purity adjustment in ovarian cancer tissues according to TIMER database (n = 303). (C) The relationship between mTOR mRNA and overall survival in patients with ovarian cancer (n = 374). (D, E) The relationship between mTOR mRNA and overall survival in ovarian cancer patients with different Tregs infiltration status (n = 374).
FIGURE 3
FIGURE 3
Expression levels of mTOR and 4E‐BP1 factors in CD4+ Tregs and Teffs (n = 6). (A, B) The expression levels of mTOR and 4E‐BP1 factors in CD4+ Tregs in different groups. Left images are the representative flow cytometric analysis. Right bar diagram shows the proportions of mTOR and 4E‐BP1in CD4+ Tregs and Teffs. Data are displayed as mean ± SEM; **p < 0.01, ***p < 0.001. (C, D) The expression levels of mTOR and 4E‐BP1 factors in CD4+ Tregs and Teffs in the SKOV3 growth environment. Left images are the representative flow cytometric analysis, and right bar diagram summarizes the expression ratios as the mean ± SEM, *p < 0.05, **p < 0.01.
FIGURE 4
FIGURE 4
mTOR signaling pathway can regulate glucose metabolism level of CD4+ Tregs. (A, B) Expression levels of genes related to glucose metabolism (Glut1, GPI, HIF‐1α, Eno1, Glut3, TPI, LDH‐α, PKM2) in CD4+ Tregs and Teffs detected via quantitative real‐time PCR. Expression levels of each gene were normalized to β‐actin expression level and adjusted to the levels in CD4+ Tregs and Teffs not treated with rapamycin (served as 1). Data shown are mean ± SEM; *p < 0.05, **p < 0.01. (C) The levels of glucose uptake of CD4+ Tregs and CD4+ Teffs via colorimetry (n = 3). The left image is standard curve of glucose uptake, and the right is the 2‐DG6P level converted from the OD value according to the standard curve. Data shown are mean ± SEM; *p < 0.05, **p < 0.01. (D) The levels of glycolysis of CD4+ Tregs and CD4+ Teffs via colorimetry (n = 8). The left image is standard curve of glycolysis, and the right is the L‐Lactate level converted from the OD value according to the standard curve. Data shown are mean ± SEM; ***p < 0.001. (E,F) Expression levels of proteins related to glucose metabolism (Glut1, HIF‐1α, LDH‐α, PKM2) in CD4+ Tregs and Teffs detected by western blot. Five panels on the left showed the western blot analysis results. The panel on the right showed the protein expressions analyzed quantitatively and compared with GAPDH expression with a densitometer. Results shown in the histogram are mean ± SEM, *p < 0.05, **p < 0.01, ***p < 0.001. [Correction added on July 27, 2023 after first online publication. The figure 4E has been updated in this version.]
FIGURE 5
FIGURE 5
Inhibition of mTOR signal and activation of TLR8 signal has a synergistic inhibitory effect on the glucose metabolism and immune function of CD4+ Tregs. (A) The level of glucose uptake of CD4+ Tregs via colorimetry (n = 12). The left image is standard curve of glucose uptake, and the right is the 2‐DG6P level converted from the OD value according to the standard curve. Data shown are mean ± SEM; ns p > 0.05, *p < 0.05. (B) The level of glycolysis of CD4+ Tregs via colorimetry (n = 6). The left image is standard curve of glycolysis, and the right image is the L‐Lactate level converted from the OD value according to the standard curve. Data shown are mean ± SEM; **p < 0.01, ***p < 0.001. (C) The proliferation level of CD4+ Teffs co‐cultured with different groups of CD4+ Tregs. Left images were the representative flow cytometric analysis of CD4+ Teffs in different groups. Right bar diagram showed the proliferation level of CD4+ Teffs and results shown in the histogram are mean ± SEM; **p < 0.01.
FIGURE 6
FIGURE 6
mTOR signaling pathway play an important role in regulating TLR8‐mediated reversal of CD4+ Tregs immunosuppressive. (A, B) The expression levels of mTOR and 4E‐BP1 in CD4+ Tregs treated with SB203580 or ssRNA40 in SKOV3 growth environment. Left images are the representative flow cytometric analysis. Right bar diagram shows the proportions of mTOR and 4E‐BP1in CD4+ Tregs and Teffs. Data are displayed as mean ± SEM; **p < 0.01. (C) The proliferation level of CD4+ Teffs co‐cultured with different groups of CD4+ Tregs. Left images are the representative flow cytometric analysis of CD4+ Teffs in different groups. Right bar diagram shows the proliferation ratio of CD4+ Teffs. Data were displayed as mean ± SEM, *p < 0.05.

Similar articles

Cited by

References

    1. Siegel RL, Miller KD, Fuchs HE, Jemal A. Cancer statistics, 2022. CA Cancer J Clin. 2022;72(1):7‐33. doi:10.3322/caac.21708 - DOI - PubMed
    1. Armstrong DK, Alvarez RD, Backes FJ, et al. NCCN guidelines® insights: ovarian cancer, version 3.2022. J Natl Compr Canc Netw. 2022;20(9):972‐980. doi:10.6004/jnccn.2022.0047 - DOI - PubMed
    1. Gajewski TF, Corrales L, Williams J, Horton B, Sivan A, Spranger S. Cancer immunotherapy targets based on understanding the T cell‐inflamed versus non‐T cell‐inflamed tumor microenvironment. Adv Exp Med Biol. 2017;1036:19‐31. doi:10.1007/978-3-319-67577-0_2 - DOI - PMC - PubMed
    1. Crunkhorn S. Cancer immunotherapy: targeting regulatory T cells. Nat Rev Drug Discov. 2017;16(11):754. doi:10.1038/nrd.2017.206 - DOI - PubMed
    1. Zeng G, Jin L, Ying Q, et al. Regulatory T cells in cancer immunotherapy: basic research outcomes and clinical directions. Cancer Manag Res. 2020;12:10411‐10421. doi:10.2147/CMAR.S265828 - DOI - PMC - PubMed

Publication types