. 2024 Mar 1;109(3):725-739.
doi: 10.3324/haematol.2022.282255.

Aberrant MNX1 expression associated with t(7;12)(q36;p13) pediatric acute myeloid leukemia induces the disease through altering histone methylation

Affiliations

Aberrant MNX1 expression associated with t(7;12)(q36;p13) pediatric acute myeloid leukemia induces the disease through altering histone methylation

Ahmed Waraky et al. Haematologica. .

Abstract

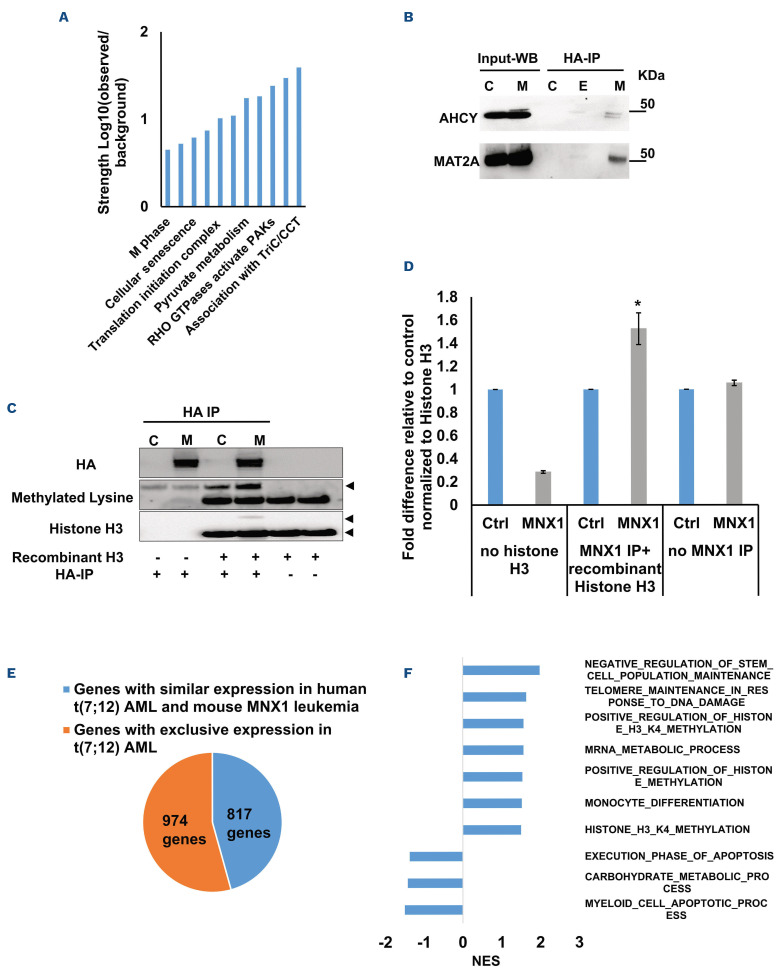
Certain subtypes of acute myeloid leukemia (AML) in children have inferior outcome, such as AML with translocation t(7;12)(q36;p13) leading to an MNX1::ETV6 fusion along with high expression of MNX1. We have identified the transforming event in this AML and possible ways of treatment. Retroviral expression of MNX1 was able to induce AML in mice, with similar gene expression and pathway enrichment to t(7;12) AML patient data. Importantly, this leukemia was only induced in immune incompetent mice using fetal but not adult hematopoietic stem and progenitor cells. The restriction in transforming capacity to cells from fetal liver is in alignment with t(7;12)(q36;p13) AML being mostly seen in infants. Expression of MNX1 led to increased histone 3 lysine 4 mono-, di- and trimethylation, reduction in H3K27me3, accompanied with changes in genome-wide chromatin accessibility and genome expression, likely mediated through MNX1 interaction with the methionine cycle and methyltransferases. MNX1 expression increased DNA damage, depletion of the Lin-/Sca1+/c-Kit+ population and skewing toward the myeloid lineage. These effects, together with leukemia development, were prevented by pre-treatment with the S-adenosylmethionine analog Sinefungin. In conclusion, we have shown the importance of MNX1 in development of AML with t(7;12), supporting a rationale for targeting MNX1 and downstream pathways.


Figures

Figure 1.
Figure 1.
MNX1 induces acute myeloid leukemia in immunocompromised mice. (A) Kaplan-Meier survival curve of immunocompromised NOD.Cg-KitW-41J Tyr+ Prkdcscid Il2rgtm1Wjl/ThomJ (NBSGW) mice transplanted with fetal liver hematopoietic stem and progenitor cells after retrovirus transduction (r-FL-HSPC) with either ectopic expression of MNX1 (green), ETV6 (purple), MNX1::ETV6 fusion (red), or empty vector control (Ctrl) (blue). Results from the transplanted mice (control N=11, MNX1: N=12, ETV6 and MNX1::ETV6 N=4) were analyzed using the log-rank test: ***P≤0.01; ns: not significant. (B) Mice were euthanized when showing sign of disease or at the end of the experiment, and analyzed for spleen weight (g), white blood cell (WBC) count, and hemoglobin concentration (Hb). (C) Quantification of flow cytometry analysis of bone marrow (BM) cells from (NBSGW) mice with c-Kit expression showing all events. Green fluorescence protein (GFP) / yellow fluorescence protein (YFP) were used as indicative for MNX1 expression. (D, left) Representative images of Hematoxylin & Eosin (H&E)-stained formaldehyde fixed liver and spleen sections from Ctrl and MNX1 mice. (D, right) Representative images of Giemsa-stained peripheral blood smears from Ctrl and MNX1 mice. (E) Kaplan-Meier survival curves of NBSGW mice transplanted with adult bone marrow (ABM) cells with either ectopic expression of MNX1, ETV6, MNX1::ETV6 fusion or Ctrl after sub-lethal radiation (0.9 Gy) with no rescue BM. Results of Ctrl and transfected mice (Ctrl N= 5, MNX1 N=8, ETV6 and MNX1::ETV6 N=3) were analyzed using the log-rank test (ns: not significant). Data represent mean ± Standard Deviation of at least three experiments. Two-sided student t test: **P≤0.01; *P≤0.05; ns: not significant at P>0.05. Fusion: MNX1::ETV6 fusion; LSK: Lin-Sca-1+c-Kit+; NSG: NOD.Cg-KitW-41J Tyr+ Prkdcscid Il2rgtm1Wjl/ThomJ (NBSGW).
Figure 2.
Figure 2.
MNX1 alters differentiation and proliferation of fetal liver hematopoietic stem and progenitor cells. (A and B) Quantification of the flow cytometry analysis of in vitro retroviral transduced fetal liver hematopoietic stem and progenitor cells (r-FL-HSPC) cells transduced with ectopic expression of MNX1, ETV6, MNX1::ETV6 fusion or empty vector control (Ctrl) with the indicated antibodies presented as percentage of population. (C) Number of colony forming unit colonies after transduction of FL-HSPC with replating for five consecutive weeks. (D) MTT proliferation assay of transduced in vitro r-FL cells. (E) Gene set enrichment analysis (GSEA) using the Gene Ontology (GO) biological pathways gene set showing normalized enrichment score (NES) (nominal P value [NOM]: P<0.05) for pathways from leukemia BM cells with MNX1 ectopic expression in comparison with FL-HSPC with Ctrl. Data represent mean ± Standard Deviation of at least three experiments. Two-sided student t test: **P<0.01; *P<0.05. Fusion: MNX1::ETV6 fusion; LSK: Lin~Sca-1+c-Kit+.
Figure 3.
Figure 3.
MNX1 induces DNA damage. (A) Immunofluorescence of in vitro retroviral transduced fetal liver hematopoietic stem and progenitor cells (r-FL-HSPC) stained with γH2AX –FITC antibody (green) and counterstained with DAPI (blue). (B) Quantification of the number of γH2AX foci/cell. At least 50 cells were counted. (C) Quantification of cell cycle distribution from flow cytometry analysis represented as fold difference relative to empty vector control (Ctrl). (D) Representative dot plots from the flow cytometry analysis of r-FL and adult bone marrow (ABM)-HSPC (r-ABM) after double staining with Annexin/V and DAPI for apoptotic analysis. (E) Quantification of the flow cytometry analysis represented as fold difference relative to Ctrl. Data represent mean ± Standard Deviation of at least three experiments. **Two-sided student t test: P≤0.01; *P≤0.05. Fusion: MNX1::ETV6 fusion; e.A: early apoptosis; l-.A: late apoptosis.
Figure 4.
Figure 4.
MNX1 alters histone methylation. (A) ImageJ quantification of western blot analysis of H3K4me1, H3K4me2, H3K4me3, and H3K27me3 as fold difference relative to loading control. (B) Heatmap of differentially bound H3K27me3 from bone marrow (BM) of leukemic mice (MNX1) versus control fetal liver hematopoietic stem and progenitor cells (FL-HSPC) transduced with empty vector (Ctrl) as determined by ACT-Seq and annotation of different enriched regions for H3K27me3 ACT-Seq. Results were considered at the log fold-change cut-off (logFC) of > |1| and false discovery rate (FDR) of <0.05. (C) Heatmap of differentially accessible regions from BM of leukemic mice (MNX1) versus control FL-HSPC transduced with Ctrl as determined by ATAC-Seq and annotation of different enriched regions for ATAC-Seq. Results were considered at the log fold-change cut-off (logFC) of > |1| and false discovery rate (FDR) of <0.05. (D) Scatter plot showing the correlation between differentially expressed genes from RNA-Seq expression analysis and genes with differentially accessible regions from ATAC-Seq analysis. Results were considered at the log fold-change cut-off (logFC) of > |1| and FDR of <0.05. AML: acute myeloid leukemia.
Figure 5.
Figure 5.
MNX1 associates with proteins from the methionine cycle and show similar gene expression and pathway enrichment with human t(7;12) acute myeloid leukemia. (A) Pathway enrichment analysis for the identified proteins after co-immunoprecipitation experiments (Co-IP) and mass spectrometry using STRING with reactome data set, showing strength of the pathway as Log10 observed proteins/background in the respective pathway. (B) Binding of AHCY and MAT2A was detected by immunoprecipitation (IP) of MNX1 using HA-antibody followed by western blot (WB) using AHCY and MAT2A antibodies. ETV6 with HA tag was used as a negative control. Total protein input used as loading control (Ctrl). (C) Recombinant Histone H3.1and H3.3 were subjected to an in vitro methyltransferase reaction using MNX1 complex pulled down with HA antibody from FL-HSPC transduced with MNX1 (M), in comparison with fetal liver hematopoietic stem and progenitor cells (FL-HSPC) with empty vector control (Ctrl), in the presence of S-adenosylmethionine (SAM) and dithiothreitol (DTT). The reactions were terminated by boiling in SDS sample buffer. Separation of samples in 12% SDS-PAGE was followed by immunoblotting (IB) with mono-, di- and trimethyl-lysines antibody. Reblotting was made for detection of HA and total Histone H3. As indicated, negative controls were obtained by omitting Histone H3, or the pulled down immune complex. (D) Quantification of the in vitro methyltransferase reaction. Data represent mean ± Standard Deviation of at least three experiments. Two-sided student t test: **P≤0.01; *P≤0.05. (E) Graph showing differentially expressed genes with same or opposite regulation when comparing gene expression data from t(7;12) acute myeloid leukemia (AML) patients from the TARGET database and RNA-seq data from bone marrow (BM) from mice with MNX1-induced leukemia. Differentially expressed genes were selected based on a LogFC ±1 and false discovery rate ≤ 0.05. Gene set enrichment analysis (GSEA) using the Gene Ontology (GO) biological pathways, showing normalized enrichment score (NES) for common pathways between t(7;12) AML patients and the MNX1-induced leukemia in mice with nominal P value (NOM) P≤0.05.
Figure 6.
Figure 6.
Sinefungin rescued MNX1-induced phenotype. (A) Protein expression levels of H3K4me3, H3k27me3, H3K4me1 and H3K4me2 in in vitro retroviral induced fetal liver hematopoietic stem and progenitor cells (r-FL-HSPC) with either MNX1 overexpression or empty vector (Ctrl) after treatment with vehicle or 5 μM sinefungin (Ctrl+S, MNX1+S) as determined by western blotting. Actin served as loading control. (B) Quantification of the western blot analysis in Online Supplementary Figure S9A. Quantification of the number of γH2AX foci/cell. At least 50 cells were counted. Data represented as fold difference relative to control. (C and D) Quantification of flow cytometry analysis of the cells with the indicated antibodies. Data represented as fold difference relative to control. Data represent mean ± Standard Deviation of at least three experiments. Two-sided Student t test between MNX1 and MNX1+S: **P≤0.01; *P≤0.05. (E) Kaplan-Meier survival curves of (NBSGW) mice transplanted with FL cells after retrovirus transduction with either ectopic expression of MNX1 or Ctrl after treatment with vehicle or 5 μM sinefungin (MNX1+S, Ctrl+S). Results of MNX1 (N=7) and sinefungin-treated MNX1 cells (MNX1+S) (N=6) were analyzed using the log-rank test: ***P≤0.01. (F) LogFC heat map of down-regulated (blue) and up-regulated (red) differentially expressed genes of FL cells with MNX1 ectopic expression (MNX) in comparison with FL cells with Ctrl, with 5 μM sinefungin (Ctrl+S, MNX+S) or without treatment (Ctrl, MNX1), showing clustering and similarity between the samples. Results were considered at the log fold-change cut-off (LogFC) ≥ ǀ1.5ǀ and false discovery rate ≤ 0.05.

Comment in

Similar articles

Cited by

References

    1. Lagunas-Rangel FA, Chavez-Valencia V, Gomez-Guijosa MA, Cortes-Penagos C. Acute myeloid leukemia-genetic alterations and their clinical prognosis. Int J Hematol Oncol Stem Cell Res. 2017;11(4):328-339. - PMC - PubMed
    1. von Bergh AR, van Drunen E, van Wering ER, et al. . High incidence of t(7;12) (q36;p13) in infant AML but not in infant ALL, with a dismal outcome and ectopic expression of HLXB9. Genes Chromosomes Cancer. 2006;45(8):731-739. - PubMed
    1. Bolouri H, Farrar JE, Triche T Jr, et al. . The molecular landscape of pediatric acute myeloid leukemia reveals recurrent structural alterations and age-specific mutational interactions. Nat Med. 2018;24(1):103-112. - PMC - PubMed
    1. Espersen ADL, Noren-Nystrom U, Abrahamsson J, et al. . Acute myeloid leukemia (AML) with t(7;12)(q36;p13) is associated with infancy and trisomy 19: Data from Nordic Society for Pediatric Hematology and Oncology (NOPHO-AML) and review of the literature. Genes Chromosomes Cancer. 2018;57(7):359-365. - PubMed
    1. Beverloo HB, Panagopoulos I, Isaksson M, et al. . Fusion of the homeobox gene HLXB9 and the ETV6 gene in infant acute myeloid leukemias with the t(7;12) (q36;p13). Cancer Res. 2001;61(14):5374-5377. - PubMed

Publication types