. 2023 Jun 15;133(12):e167417.
doi: 10.1172/JCI167417.

Brain microglia serve as a persistent HIV reservoir despite durable antiretroviral therapy

Affiliations

Brain microglia serve as a persistent HIV reservoir despite durable antiretroviral therapy

Yuyang Tang et al. J Clin Invest. .

Abstract

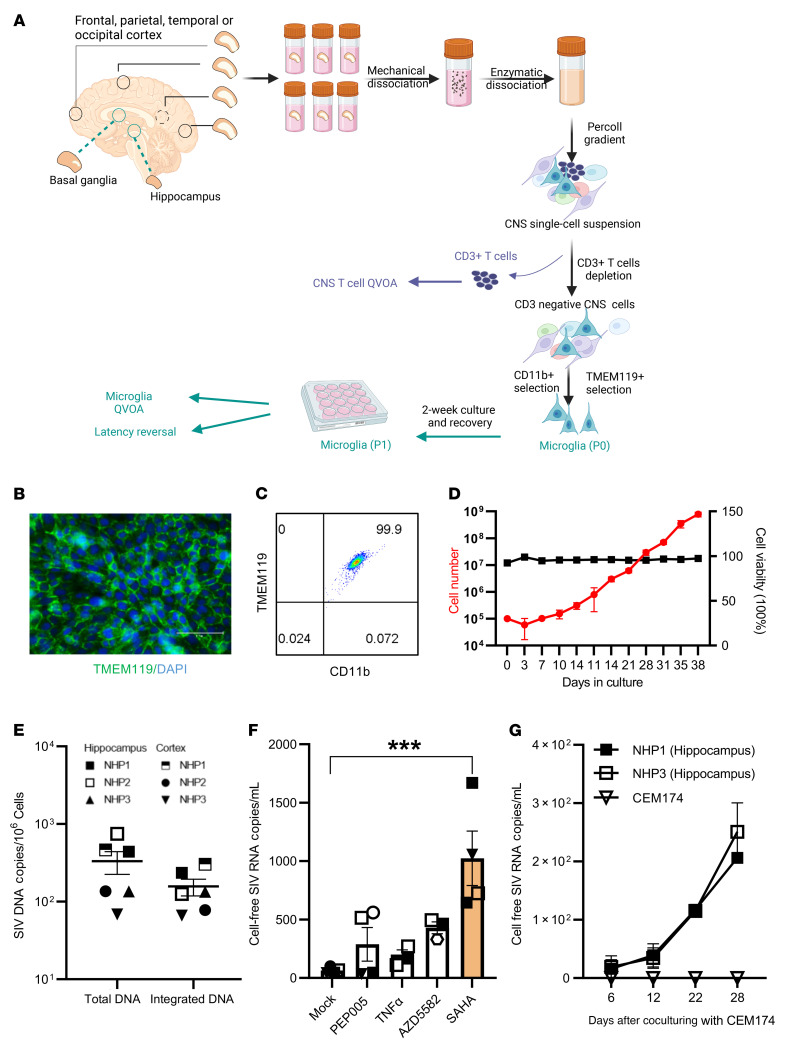
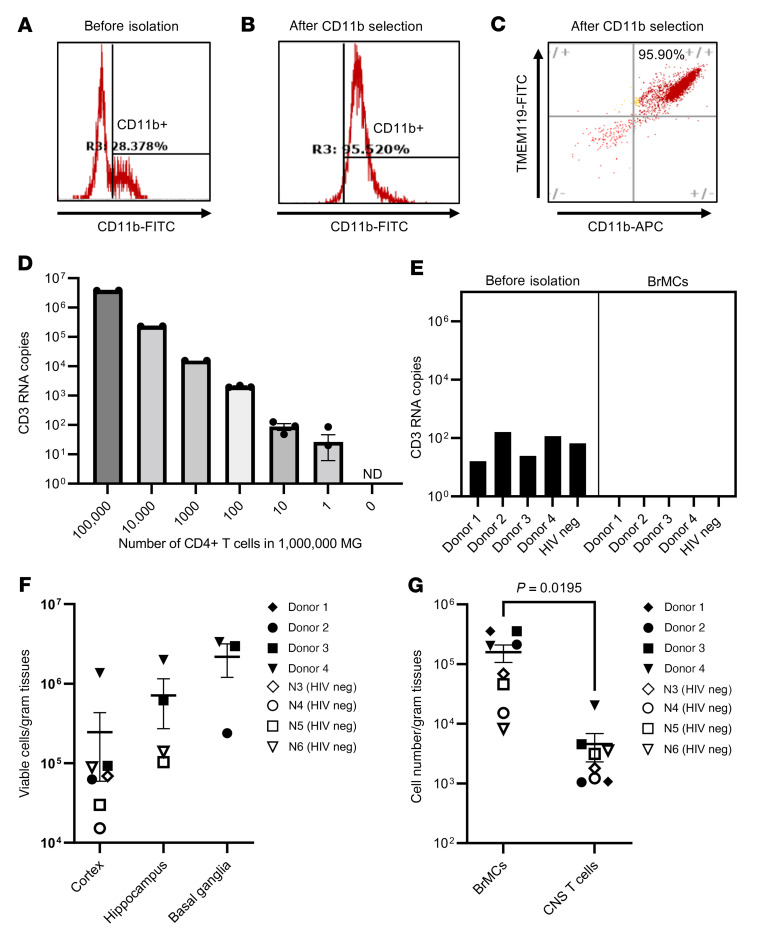
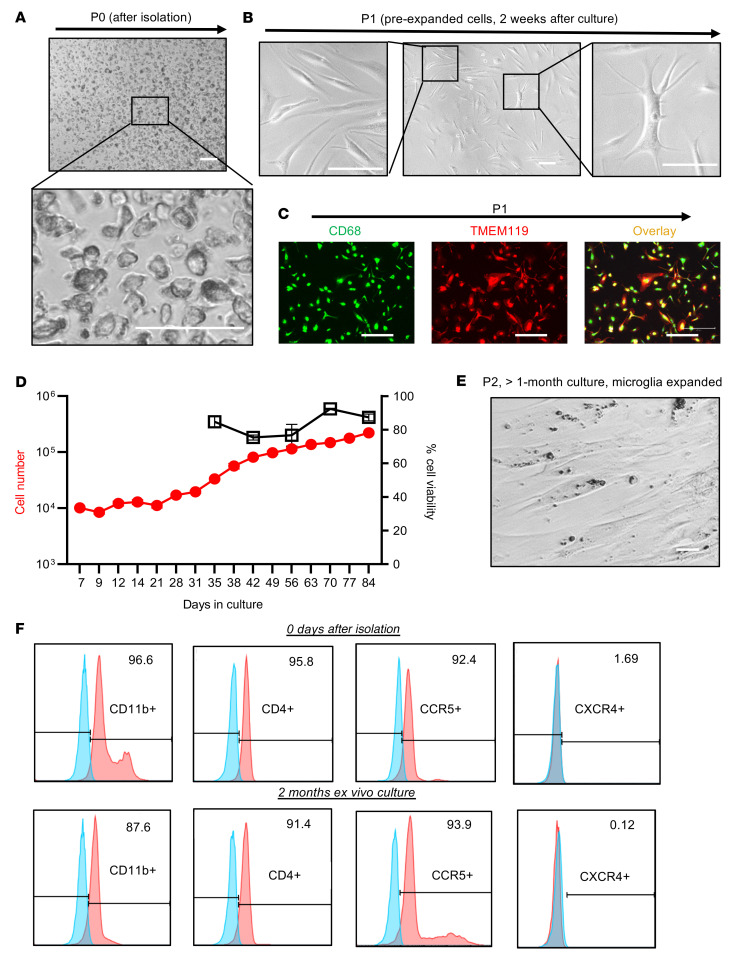
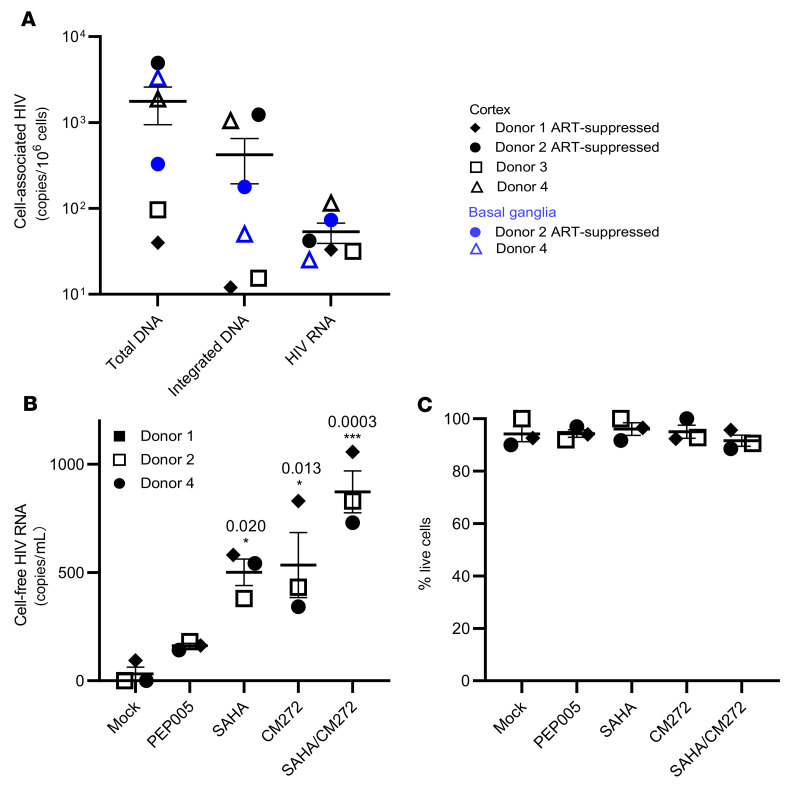
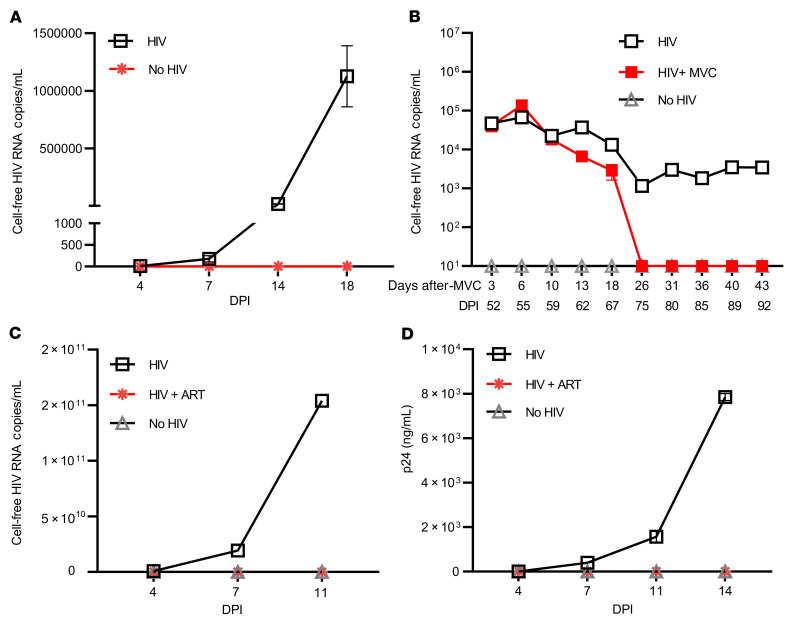
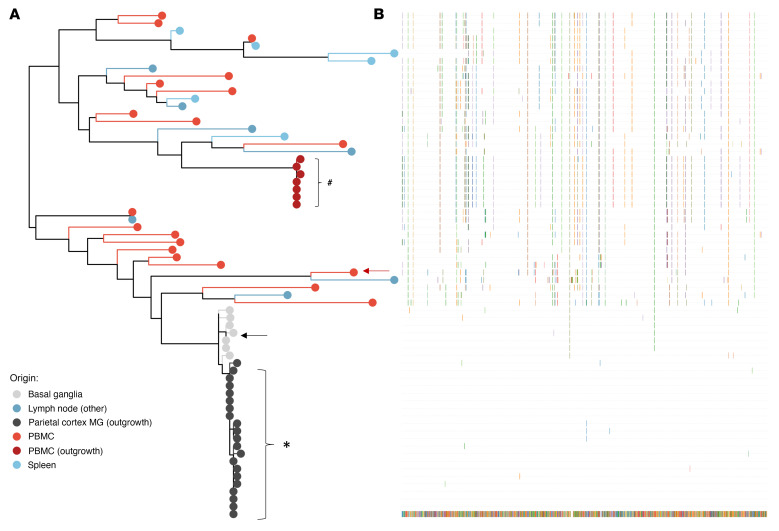
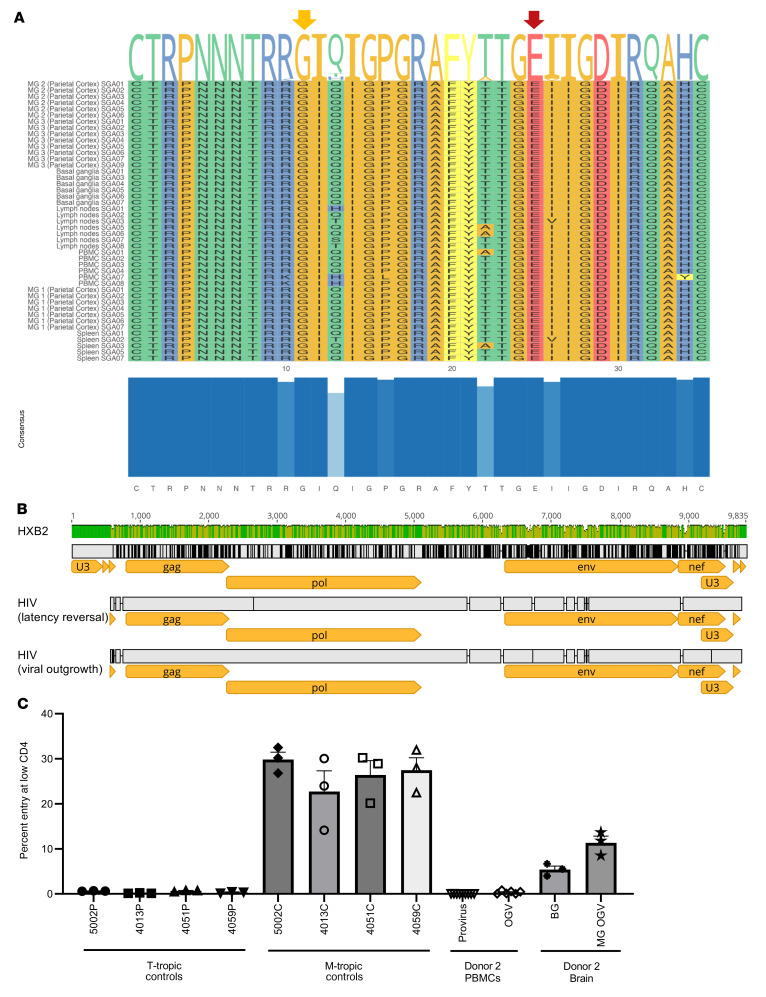
Brain microglia (MG) may serve as a human immunodeficiency virus 1 (HIV) reservoir and ignite rebound viremia following cessation of antiretroviral therapy (ART), but they have yet to be proven to harbor replication-competent HIV. Here, we isolated brain myeloid cells (BrMCs) from nonhuman primates and rapid autopsy of people with HIV (PWH) on ART and sought evidence of persistent viral infection. BrMCs predominantly displayed microglial markers, in which up to 99.9% of the BrMCs were TMEM119+ MG. Total and integrated SIV or HIV DNA was detectable in the MG, with low levels of cell-associated viral RNA. Provirus in MG was highly sensitive to epigenetic inhibition. Outgrowth virus from parietal cortex MG in an individual with HIV productively infected both MG and PBMCs. This inducible, replication-competent virus and virus from basal ganglia proviral DNA were closely related but highly divergent from variants in peripheral compartments. Phenotyping studies characterized brain-derived virus as macrophage tropic based on the ability of the virus to infect cells expressing low levels of CD4. The lack of genetic diversity in virus from the brain suggests that this macrophage-tropic lineage quickly colonized brain regions. These data demonstrate that MG harbor replication-competent HIV and serve as a persistent reservoir in the brain.

Keywords: AIDS/HIV; Drug therapy.


Conflict of interest statement

Conflict of interest: The authors have declared that no conflict of interest exists.

Figures

Figure 1
Figure 1. Isolation and characterization of BrMCs and MG from ART-suppressed NHPs and PWH.
(A) Brain tissue pieces were collected from the indicated brain regions and dissociated by mechanical disruption and enzymatic digestion. A CNS single-cell suspension was generated after Percoll separation. CD3+ T cells were positively selected and used for a CNS T cell QVOA. BrMCs and MG were isolated from the CD3 fractions by CD11b+ selection and by TMEM119+ selection, respectively. For human brains, CD11b+ selection was performed to isolate BrMCs. BrMCs or MG at P0 (collected immediately after isolation) were used for purity and phenotype analysis and for RT-qPCR to measure proviral DNA and cell-associated RNA. BrMCs or MG at P1 were cultured 1–2 weeks ex vivo to allow the cells to recover and attach. P1 cells were used for the LRA study and the QVOA. (B) MG isolated from ART-suppressed, SIV-infected rhesus macaques were defined by TMEM119 staining (P1 MG) (scale bar: 100 μm) and (C) anti-TMEM119/anti-CD11b flow cytometry (P0 MG). (D) NHP MG proliferated ex vivo. (E) Total and integrated SIV DNA was detectable in isolated P0 MG (n = 3). (F) SIV RNA was induced in isolated P1 MG 7 days after stimulation by the HDACi SAHA (500 nM), but was poorly induced by the canonical NF-κB agonist PEP005 (12 nM), the noncanonical NF-κB agonist AZD5582 (100 nM), or TNF-α (50 ng/mL). ***P < 0.001 compared with mock treatment, by 1-way ANOVA (n = 3). (G) SIV RNA was recovered from the supernatant of NHP P1 MG cocultured with CEM174 (n = 3). Data are presented as the mean ± SEM.
Figure 2
Figure 2. Isolation of highly pure and viable MG from fresh postmortem brain tissues of PWH on ART.
Representative FACS plots show the CD11b+ cells in a CNS single-cell suspension from the parietal cortex of donor 2 before (A) and after (B) CD11b selection. (C) Greater than 95% of CD11b+ BrMCs were TMEM119+ MG after enrichment. (D) Standard for a highly sensitive CD3 ddPCR assay with a detection limit of 1 CD4+ cell per 1,000,000 MG. ND, not detectable. (E) CD3 RNA was undetectable in 1 × 10⁶ isolated MG, but was detectable before isolation (n = 5). (F) MG yields in different brain regions of donor brains with or without HIV (n = 7). (G) The number of isolated MG was much higher than CNS T cells isolated from the same source of tissues from donors with or without HIV. P = 0.0195, by paired Student’s t test (n = 7). Data are presented as the mean ± SEM. neg, negative.
Figure 3
Figure 3. Characterization of MG from fresh postmortem brain tissues from PWH on ART.
(AC) Representative images show the morphology and/or phenotype of MG at the P0 (A) or P1 (B) stage during culture. The isolated P1 MG remaining expressed the BrMC marker CD68 (green) and the MG-specific marker TMEM119 (red), which largely overlapped with each other (yellow) (C). Scale bars: 100 μm (A and B) and 400 μm (C). (D) Human MG proliferated ex vivo (n = 3). (E) Image shows proliferation of P2 MG (after >1 month of ex vivo culturing). Scale bar: 100 μm. (F) MG at both P0 and P2 stages expressed the myeloid cell pan-marker CD11b, the HIV receptor CD4, and its coreceptor CCR5, whereas the CXCR4 coreceptor was undetectable. Unlabeled controls are shown in blue.
Figure 4
Figure 4. The frequency of HIV DNA and RNA in MG isolated from PWH and latency reversal after induction by epigenetic and nonepigenetic regulators.
(A) Total HIV DNA, integrated HIV DNA, and cell-associated RNA were detectable in MG isolated from cortex and/or basal ganglia of HIV+ donors. Each symbol represents an average of 3 RT-qPCR measurements in MG (n = 4). (B) The response of human MG to LRAs. Cell-free HIV gag RNA in the cortical MG culture supernatant was measured on day 7 after LRA treatment. The HDACi SAHA (250 nM) and the methytransferase inhibitor CM272 (50 nM), alone or in combination, markedly induced HIV RNA release. *P < 0.05 and ***P < 0.001, by 1-way ANOVA (n = 3). (C) Cellular viability was measured by trypan blue exclusion (n = 3).
Figure 5
Figure 5. HIV was outgrown from brain-derived MG.
(A) Cell-free HIV RNA (gag) in the culture supernatants was measured in the SAHA- and CM272-treated MG cultures (105 cells/well) isolated from the parietal cortex of donor 2 (n = 3). (B) Outgrowth HIV was tracked over time by measuring viral RNA release in the culture supernatant of SAHA- and CM272-treated MG wells (from the indicated brain region of donor 2) after addition of CD8-depleted PHA PBMC blasts (n = 3). (C) MG QVOA and de novo infection by human brain MG–derived HIV. After MG were isolated from the brain of PWH, cells were plated in the 24-well plates with limited dilutions and cultured for 14 days in the presence of ART, allowing the cells to settle down and attach to the surface. The latent HIV was activated with SAHA and CM272 for another 7 days, and then the LRAs were washed out. For the MG QVOA, LRA-treated MG were cultured with CD8-depleted, HIV PBMC PHA blasts or MOLT-4/CCR5 cells. Viral outgrowth was measured on day 21 and was further confirmed on day 28. De novo HIV infection was used to assess MG-derived, replication-competent HIV via inoculation of virus from LRA-stimulated MG culture into MG or PBMC blasts isolated from HIV donors. HIV replication was assayed by HIV RNA and p24 released into culture supernatants. ART consisted of raltegravir plus darunavir plus nevirapine. (D and E) The IUPM of MG and CNS T cells was calculated by standard viral outgrowth assay (measuring HIV p24 antigen release in the wells) (D) and by RT-ddPCR to measure viral RNA+ wells (E) (n = 4).
Figure 6
Figure 6. Outgrowth HIV reestablished its infection in both myeloid cells and PBMC PHA blasts.
Supernatant HIV from day 7 after CM272- and SAHA-stimulated reinfected MG culture (as shown in Figure 4A) (A and B) or CD8-depleted PBMC PHA blasts isolated from HIV donors (C and D). The same sources of target MG cultures or PHA blasts without addition of HIV (No HIV) were used as negative infection controls. HIV production was measured by HIV RT-ddPCR (AC) or HIV p24 ELISA (D). HIV infection in MG was suppressed by the CCR5 inhibitor MVC (B), while ART (raltegravir/darunavir/nevirapine) treatment blocked HIV infection in PBMC PHA blasts (C and D) (n = 3). DPI, days post infection.
Figure 7
Figure 7. Viral sequence analysis of MG outgrowth HIV from donor 2.
(A) Maximum likelihood phylogeny of the intact FL envelope sequences. Maximum likelihood phylogeny reconstruction was performed by IQtree (77). Tree topology confirmed that the MG outgrowth viral population (isolated from parietal cortex, in black) was more closely related to viral sequences from brain tissues (basal ganglia, gray) but distinctly related to viral sequences in the PBMCs (red) as well as lymphoid organs (spleen and lymph nodes, blue). The plot was generated with ggtree R package (78). Arrows indicate the envs that were cloned from proviral DNA and examined in the phenotyping assays. Additional clones were generated from the MG and PBMC outgrowth cultures. The clone from the MG outgrowth culture was identical to the MG OGV sequences, and the clone from the PBMC outgrowth culture was identical to 4 PBMC OGV sequences. #Sequences from OGV. (B) Viral sequences were aligned to MG-OGV.
Figure 8
Figure 8. Phenotyping of brain MG outgrowth HIV from donor 2.
(A) Amino acid variations of the V3 regions from parietal cortex MG, basal ganglia, and PBMCs. The amino acid positions 11 and 25 (arrows) were conserved in all sequences predicted to be CCR5-tropic using geno2pheno (47), a conservative 10% false-positive rate threshold for coreceptor CXCR4 usage based on the recommendation from the European Consensus Group on clinical management of HIV tropism testing. The plot was created by the ggmsa R package (79). Amino acid variations are presented at the top of the sequence alignment, and the V3 consensus is depicted at the bottom. Only 4 positions (10, 13, 22, and 34) differed across all V3 sequences. (B) Near-FL HIV genomes were recovered from MG derived from donor 2 after latency reversal (day 7), and supernatants of PBMCs infected with the MG-induced HIV (day 14). (C) HIV tropism was determined by the ability of luciferase reporter viruses to enter Affinofile cells expressing a low density of CD4 relative to their ability to enter Affinofile cells expressing high levels of CD4 (2, 49, 51). Reporter pseudoviruses were generated using envs cloned from MG and PBMC outgrowth cultures and proviral DNA in PBMCs and basal ganglia tissue, all from donor 2 (cloned envs shown in Figure 7A). Entry phenotypes were then compared with well-characterized T- and M-tropic controls cloned directly from patient samples (2, 49).

References

    1. Norris GT, Kipnis J. Immune cells and CNS physiology: microglia and beyond. J Exp Med. 2019;216(1):60–70. doi: 10.1084/jem.20180199. - DOI - PMC - PubMed
    1. Schnell G, et al. HIV-1 replication in the central nervous system occurs in two distinct cell types. PLoS Pathog. 2011;7(10):e1002286. doi: 10.1371/journal.ppat.1002286. - DOI - PMC - PubMed
    1. Joseph SB, et al. Human immunodeficiency virus type 1 RNA detected in the central nervous system (CNS) after years of suppressive antiretroviral therapy can originate from a replicating CNS reservoir or clonally expanded cells. Clin Infect Dis. 2019;69(8):1345–1352. doi: 10.1093/cid/ciy1066. - DOI - PMC - PubMed
    1. Spudich S, et al. Persistent HIV-infected cells in cerebrospinal fluid are associated with poorer neurocognitive performance. J Clin Invest. 2019;129(8):3339–3346. doi: 10.1172/JCI127413. - DOI - PMC - PubMed
    1. Farhadian SF, et al. Single-cell RNA sequencing reveals microglia-like cells in cerebrospinal fluid during virologically suppressed HIV. JCI Insight. 2018;3(18):121718. doi: 10.1172/jci.insight.121718. - DOI - PMC - PubMed

Publication types