. 2023 Jun 15;133(12):e165510.
doi: 10.1172/JCI165510.

RAB27B controls palmitoylation-dependent NRAS trafficking and signaling in myeloid leukemia

Affiliations

RAB27B controls palmitoylation-dependent NRAS trafficking and signaling in myeloid leukemia

Jian-Gang Ren et al. J Clin Invest. .

Abstract

RAS mutations are among the most prevalent oncogenic drivers in cancers. RAS proteins propagate signals only when associated with cellular membranes as a consequence of lipid modifications that impact their trafficking. Here, we discovered that RAB27B, a RAB family small GTPase, controlled NRAS palmitoylation and trafficking to the plasma membrane, a localization required for activation. Our proteomic studies revealed RAB27B upregulation in CBL- or JAK2-mutated myeloid malignancies, and its expression correlated with poor prognosis in acute myeloid leukemias (AMLs). RAB27B depletion inhibited the growth of CBL-deficient or NRAS-mutant cell lines. Strikingly, Rab27b deficiency in mice abrogated mutant but not WT NRAS-mediated progenitor cell growth, ERK signaling, and NRAS palmitoylation. Further, Rab27b deficiency significantly reduced myelomonocytic leukemia development in vivo. Mechanistically, RAB27B interacted with ZDHHC9, a palmitoyl acyltransferase that modifies NRAS. By regulating palmitoylation, RAB27B controlled c-RAF/MEK/ERK signaling and affected leukemia development. Importantly, RAB27B depletion in primary human AMLs inhibited oncogenic NRAS signaling and leukemic growth. We further revealed a significant correlation between RAB27B expression and sensitivity to MEK inhibitors in AMLs. Thus, our studies presented a link between RAB proteins and fundamental aspects of RAS posttranslational modification and trafficking, highlighting future therapeutic strategies for RAS-driven cancers.

Keywords: Cancer; Cell Biology; Hematology; Signal transduction.


Figures

Figure 1
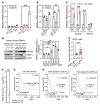
Figure 1. RAB27B is markedly upregulated upon CBL loss or inactivation.
(A) Volcano plots comparing total protein levels between CBL/CBL-B double depleted (DKO+D) versus control (Ctrl) TF-1 cells, and between TF-1 cells overexpressing CBLC381A E3-dead mutant versus CBLWT. Mean fold changes and P values were calculated from 3 independent quantitative proteomics experiments. (BD) WB analysis to examine RAB27B and RAB27A protein levels and halflives (n = 3) in DKO+D compared with Ctrl cells, as shown in TF-1 (B and C) and U937 (D) cells. CHX: cycloheximide that inhibits nascent protein synthesis. Quantification of RAB27B half-lives is shown in the right panels of C and D. (E and F) WB analysis to examine RAB27B and RAB27A protein level and degradation (n = 3) in TF-1 cells after single or double knockout (DKO) of CBL and CBL-B. Quantification of RAB27B half-lives is shown in the right panel of F. (G and H) TF-1 cells stably expressing CBLC381A mutant, CBLWT or empty vector (EV) were established. (G) WB analysis to examine RAB27B protein halflife (n = 3). Quantification of RAB27B half-lives is shown in the right panel. (H) RAB27B protein level in the presence of DMSO, MG132 (MG, 10 μM) or Chloroquine (CL, 5 μM). pSTAT5 is used as a control for proteasomal degradation inhibited by MG132. Data for the halflife studies are represented as mean ± SD, and determined by 2-way ANOVA. *P < 0.05; **P < 0.01; ***P < 0.001.
Figure 2
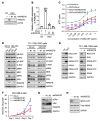
Figure 2. CBL depletion or inactivation enhances RAB27B gene transcription, and RAB27B expression correlates with poor survival in AML.
(A) qRT-PCR to examine RAB27B and RAB27A mRNA levels in single or double knockout (DKO) of CBL and CBL-B compared with Ctrl TF-1 cells. (B) qRT-PCR to examine RAB27B and RAB27A mRNA levels in TF-1 cells stably expressing CBLC381A mutant or CBLWT compared with empty vector (EV). (C) qRT-PCR to examine RAB27B nascent and mature RNA level in TF-1 DKO cells compared with Ctrl cells. Two different pairs of primers were used to detect premRNA (designated as pre 1 and pre 2, depending on the primer set). Mature messenger RNA is labeled as mRNA. (D) RAB27B protein (left) and mRNA (right) levels in primary human PBMCs from healthy donors (C1–C3, n = 3) and patients with JAK2V617F+ MPN (n = 4) are shown. (E) RAB27B mRNA levels in BM CD34+ cells from healthy donors (n = 15) and patients with JAK2V617F+ MPN (n = 43) plotted using the expression data from GSE103176 (28). Each symbol indicates individual subject. (F) RAB27B expression level in patients with AML and healthy controls (GEPIA Cancer Database). (G and H) Kaplan-Meier plot of overall survival for patients with AML with low or high expression of RAB27B. UALCAN (G) top 25% or bottom 75% (low/medium) expression of RAB27B; CTGA database from BloodSpot (H) top 50% or bottom 50% expression of RAB27B. P values determined by log-rank t test are shown. In all relevant panels, data are represented as mean ± SD. 1-way ANOVA was used in panels A, B and D; Student’s 2-tailed t tests were used in Figure C and E; *P < 0.05; **P < 0.01; ***P < 0.001.
Figure 3
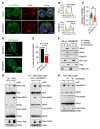
Figure 3. RAB27B regulates NRAS activity and signaling.
(AE) RAB27B was stably depleted via lentiviral-shRNA–mediated knockdown (KD) in TF-1 DKO cells, with shRNA against Luciferase (shLuc) used as a control. (A and B) KD efficiency of shRNA-RAB27B constructs was determined by WB (A) and qRT- PCR (B). (C) Cells were cultured in triplicates in different concentrations of human GM-CSF. Cell growth after 3 days in culture was determined by MTT absorbance. (D) TF-1 Ctrl or DKO cells (left), and TF-1 DKO cells with or without RAB27B depletion (right), were cultured in media containing serum only or serum and GM-CSF. Cell lysates were subjected to WB analysis with indicated antibodies to examine RAF/MEK/ERK activation. (E) TF-1 cells as described in (D) were cultured in media containing serum only. RAS GTPase activities were measured by RAS GTP pulldowns using RAF-1 RBD agarose beads, followed by WB with indicated antibodies. GTP-bound RAS represents active RAS. Input lysates were subjected to WB analysis with indicated antibodies as controls. (FH) RAB27B was stably depleted via lentiviral-shRNA mediated KD in OCI-AML3 cells, with shLuc used as a control. (F) Cells were plated at equal cell numbers and cell growth was determined by counting of live cells. (G) ERK activation was determined by WB. (H) NRAS activity was determined by RAF-1 RBD agarose bead pulldown followed by WB using anti-NRAS antibodies. Input lysates were subjected to WB analysis with the indicated antibodies as controls. In all relevant panels, data are represented as mean ± SD, and 2-way ANOVA was used for comparing cell growth; *P < 0.05; **P < 0.01; ***P < 0.001.
Figure 4
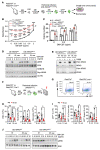
Figure 4. RAB27B is critical for NRAS plasma membrane localization and palmitoylation.
(AC) RAB27B silencing reduces NRAS localization in the PM in TF-1 DKO cells. TF-1 DKO cells with or without shRNA-mediated depletion of RAB27B were stably expressed GFP-NRAS via retroviral infection. (A) Representative immunofluorescent confocal images of GFP-NRAS (green) with the PM marker wheat germ agglutinin (WGA; red) and nucleus stain (DAPI; blue). Note that the intracellular WGA is endocytosed WGA. Scale bar: 10 μm. (B) A line was drawn across confocal images of cells as shown in A, and the signals for GFP-NRAS and WGA along the line are plotted. (C) Mander’s coefficient of GFP and WGA signals (mean ± SD), as shown in B. **P < 0.01, Student’s 2-tailed t test. (D and E) RAB27B silencing reduces NRAS localization in the PM in SK-MEL-147 cells. (D) Representative live-cell fluorescent images of GFP-NRAS in SK-MEL-147 cells transfected with siRNA to RAB27B (siRAB27B) or a nontargeting control (siControl). Scale bar: 20 μm. (E) Quantification of percentage of cells with PM–localized GFP-NRAS, as shown in D. Numbers over bars indicate number of cells with PM localization over the total number of GFP-NRAS cells. P < 0.002, determined by Fisher’s exact test. (F) TF-1 DKO cells with or without shRNA-mediated depletion of RAB27B were subjected to subcellular fractionation followed by WB analysis with the indicated antibodies. (G) TF-1 Ctrl or DKO cells (left), and TF-1 DKO cells with or without shRNA-mediated RAB27B depletion (right), were cultured in media supplemented with serum only. Palmitoylation status of endogenous RAS proteins was assessed using the APE assay. HAM, hydroxylamine; Palm, palmitoylated. (H) Palmitoylation status of endogenous RAS proteins in OCI-AML3 cells with or without RAB27B depletion was assessed using the APE assay.
Figure 5
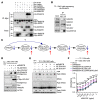
Figure 5. Rab27b deficiency in mice abrogates NRASQ61R -mediated signaling, cell growth, and myeloid leukemia development in vivo.
(AE) LSK cells from Rab27bfl/fl and Rab27bfl/fl;Crevav mice were infected with retroviruses expressing either WT or Q61R-mutant NRAS, and, subsequently, GFP+ cells were purified by FACS. (A) Schematic illustration of experimental design. (B) Cells were cultured in triplicates in different concentrations of mouse GM-CSF and cell growth after 3 days in culture as determined by MTT absorbance is shown. (C) Infected HSPCs were plated in triplicates in a graded concentration of mouse GM-CSF. 7–10 days later, colony numbers were counted. (B and C) Data are represented as mean ± SD. P values are determined by 2-way ANOVA. *P < 0.05; **P < 0.01; ***P < 0.001; #P < 0.05; ##P < 0.01; ###P < 0.001. For panel B, the asterisks indicate comparison to the ff+NRASWT group; the number signs indicate comparison to the ff+NRASQ61R group. (D) Infected HSPCs were stimulated with different doses of mouse GM-CSF and subjected to WB analysis. (E) Palmitoylation status of RAS was assessed using the APE assay. HAM, hydroxylamine; Palm, palmitoylated. (FJ) LSK cells from Rab27bfl/fl and Rab27bfl/fl;Crevav mice were infected with retroviruses expressing Q61R mutant or WT NRAS, and subsequently transplanted into lethally irradiated recipient mice. (F) Schematic illustration of the NRASQ61R transplant experimental scheme. (G) Flow cytometric plots showing the NRASQ61R infection rates at the time of transplantation. (H) CBC analysis of recipient mice 6 and 10 weeks after transplantation. (I) Quantification of GFP+ donor CD45+ and myeloid cell percentages in the peripheral blood as well as GFP+ percentage in donor cells from each group at 6 and 10 weeks after transplantation. (H and I) Each symbol represents an individual mouse; bars indicate mean frequencies; error bars indicate SD. *P < 0.05; **P < 0.01; ***P < 0.001. 2-tailed t test. (J) Total BM cells from the transplanted mice were starved and stimulated with a graded dose of GM-CSF, and subsequently subjected to WB analysis.
Figure 6
Figure 6. Rab27b deficiency in mice abrogates oncogenic NRASG12D-mediated myeloid leukemia development in vivo.
LSK cells from Rab27bfl/fl and Rab27bfl/fl;Crevav mice were infected with retroviruses expressing G12D mutant or WT NRAS, and subsequently transplanted into lethally irradiated recipient mice. (A) Schematic illustration of the NRASG12D transplant experimental scheme. (B) Representative flow cytometric plots of the bone marrow and spleen of the transplanted mice. GFP+ cells were gated for myeloid (Mac/Gr1) and T cell (CD4/CD8) lineages. (C) Representative histological analysis (H&E staining) of the bone and spleen of the transplanted mice are shown. Scale bar: 20 μm. (D) Kaplan–Meier survival curves of the transplanted mice. P value between ff+NRASG12D and ff;vav+NrasG12D groups is calculated by log-rank t test.
Figure 7
Figure 7. RAB27B depletion reduces clonogenic growth and NRAS/ERK signaling of primary NRASmut AMLs.
(AC) Primary NRASmut (n = 3) and NRASWT (n = 3) AML cells were infected with lentiviruses expressing shRNA against luciferase (shLuc) or RAB27B (shRAB27B). Infected cells were purified by flow cytometric sorting and subjected to colony-forming assays and biochemical assays. (A) Relative colony numbers of primary human AMLs upon RAB27B depletion compared to that of shLuc controls. P values were determined by 2-tailed Student’s t test, *P < 0.05; **P < 0.01. (B) Primary human AMLs with or without RAB27B depletion were subjected to WB analysis with the indicated antibodies. (C) Palmitoylation status of endogenous RAS proteins was assessed using the APE assay. HAM, hydroxylamine. Palm: palmitoylated. (D) RAB27B expression levels in AMLs from patients in the BeatAML database are plotted with AUC to different MEK inhibitors. Linear regression trend line, P value and R2 value were generated using GraphPad Prism 8.0.
Figure 8
Figure 8. RAB27B binds to ZDHHC9 and regulates NRAS palmitoylation via ZDHHC9.
(A) 293T cells were transfected with constructs to express tagged RAB27B, NRAS and ZDHHC9 as indicated. Cells were then subjected to IP followed by WB using the indicated antibodies. (B) TF-1 DKO cells stably expressing HA-ZDHHC9 were subjected to coIP with anti-HA antibodies followed by WB analysis using the indicated antibodies to examine its interaction with endogenous proteins. (C) Schematic illustration of the hypothesis depicting how RAB27B regulates NRAS signaling (blue arrows) and how to restore NRAS signaling disrupted due to RAB27B loss (red arrows). (DF) RAB27B-depleted TF-1 DKO cells stably expressing HA-ZDHHC9 or Myc-GOLGA7 were subjected to examination of palmitoylation status and cell growth. (D) WB to examine the efficiency of RAB27B KD or ZDHHC9 and GOLGA7 overexpression in TF-1 Ctrl and DKO cells. (E) APE assay to examine palmitoylation of endogenous RAS proteins. OE, overexpression; HAM, hydroxylamine; Palm, palmitoylated. (F) Cells were cultured in triplicate in different concentrations of human GM-CSF and cell growth after 3 days in culture was determined by MTT absorbance. Data are represented as mean ± SD. **P < 0.01; ***P < 0.001 compared with the shRAB27B group, determined by 2-way ANOVA.

Comment in

References

    1. Sargin B, et al. Flt3-dependent transformation by inactivating c-Cbl mutations in AML. Blood. 2007;110(3):1004–1012. doi: 10.1182/blood-2007-01-066076. - DOI - PubMed
    1. Masson K, et al. Direct binding of Cbl to Tyr568 and Tyr936 of the stem cell factor receptor/c-Kit is required for ligand-induced ubiquitination, internalization and degradation. Biochem J. 2006;399(1):59–67. doi: 10.1042/BJ20060464. - DOI - PMC - PubMed
    1. Bulut GB, et al. Cbl ubiquitination of p85 is essential for Epo-induced EpoR endocytosis. Blood. 2013;122(24):3964–3972. doi: 10.1182/blood-2013-05-506212. - DOI - PMC - PubMed
    1. Marklin M, et al. C-Cbl regulates c-MPL receptor trafficking and its internalization. J Cell Mol Med. 2020;24(21):12491–12503. doi: 10.1111/jcmm.15785. - DOI - PMC - PubMed
    1. Visser Smit GD, et al. Cbl controls EGFR fate by regulating early endosome fusion. Sci Signal. 2009;2(102):ra86. - PMC - PubMed

Publication types

Substances