. 2023 Oct 1;164(10):2196-2215.
doi: 10.1097/j.pain.0000000000002934. Epub 2023 Jun 6.

Deep RNA-seq of male and female murine sensory neuron subtypes after nerve injury

Affiliations

Deep RNA-seq of male and female murine sensory neuron subtypes after nerve injury

Allison M Barry et al. Pain. .

Abstract

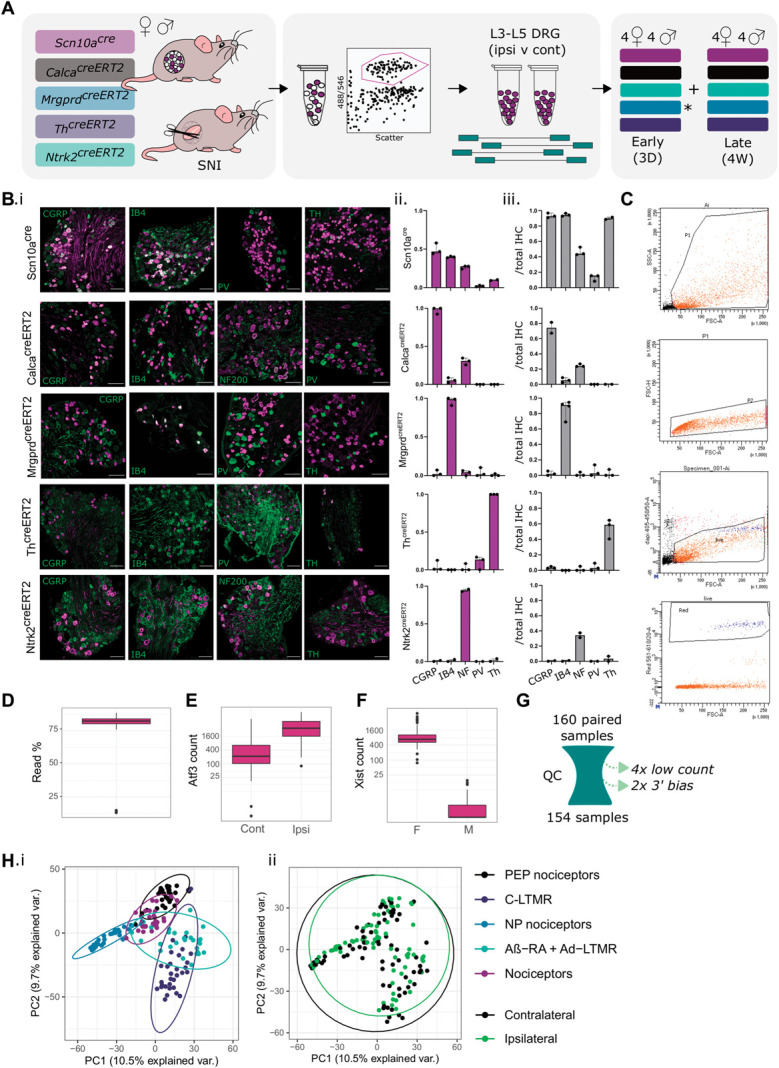
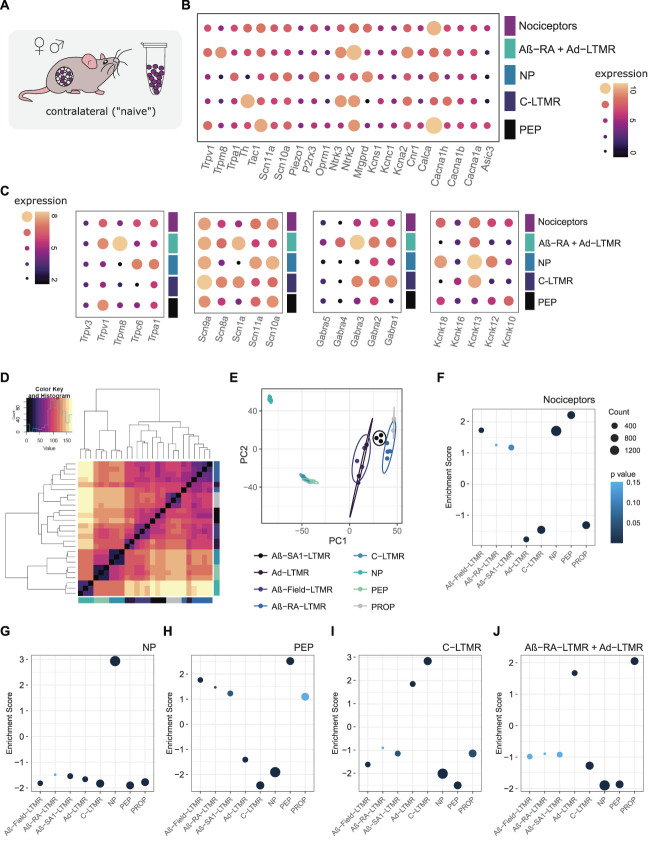
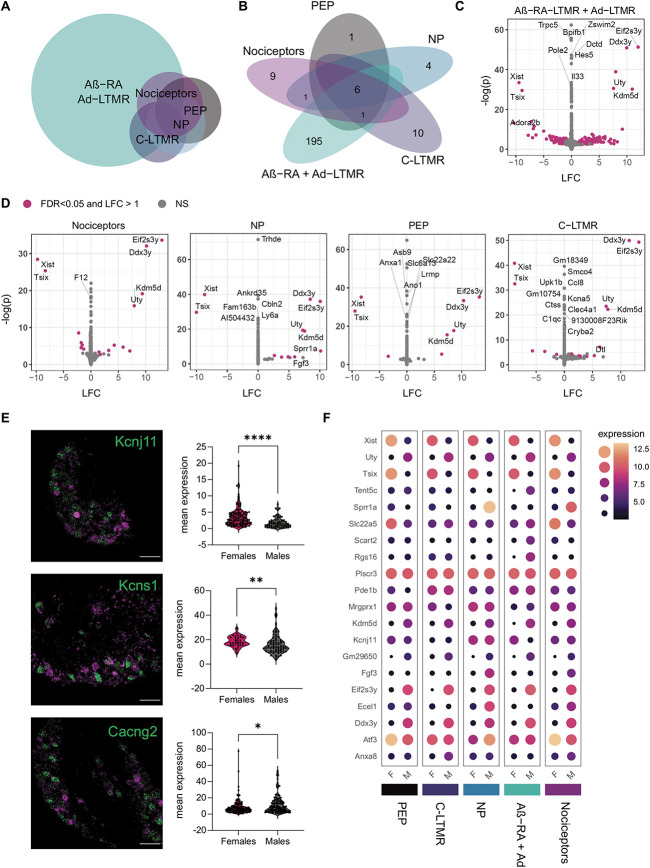
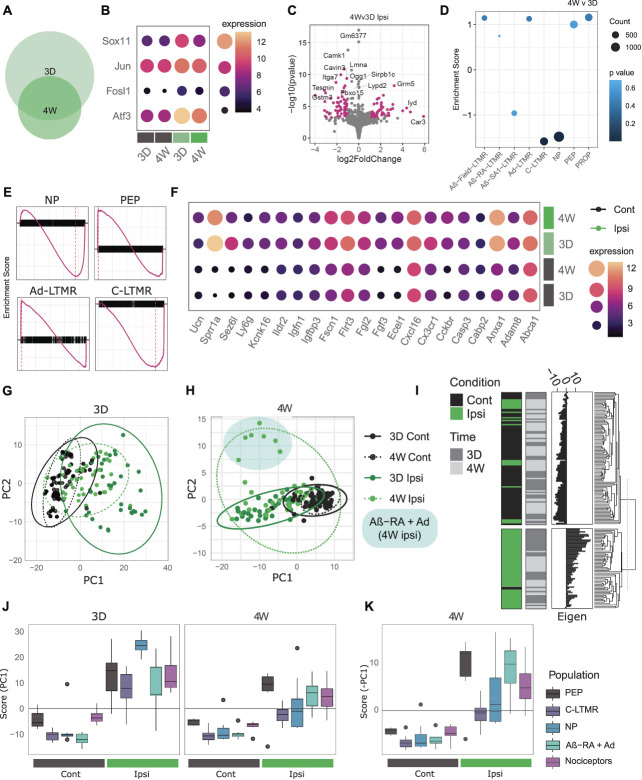
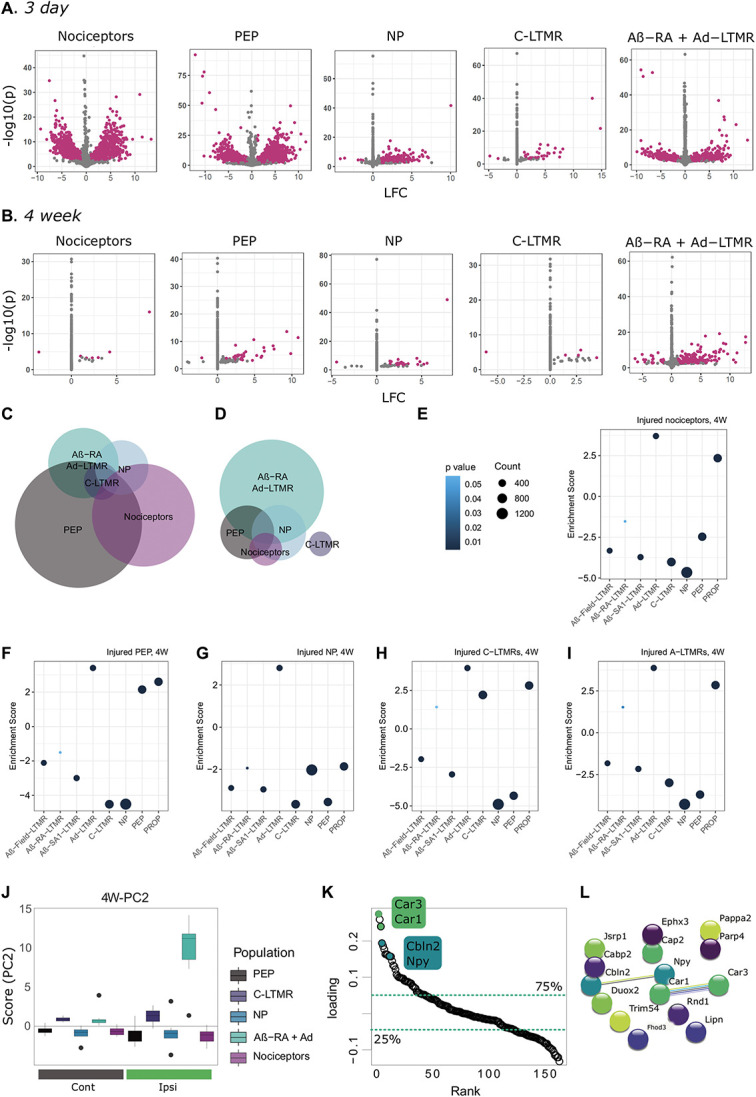
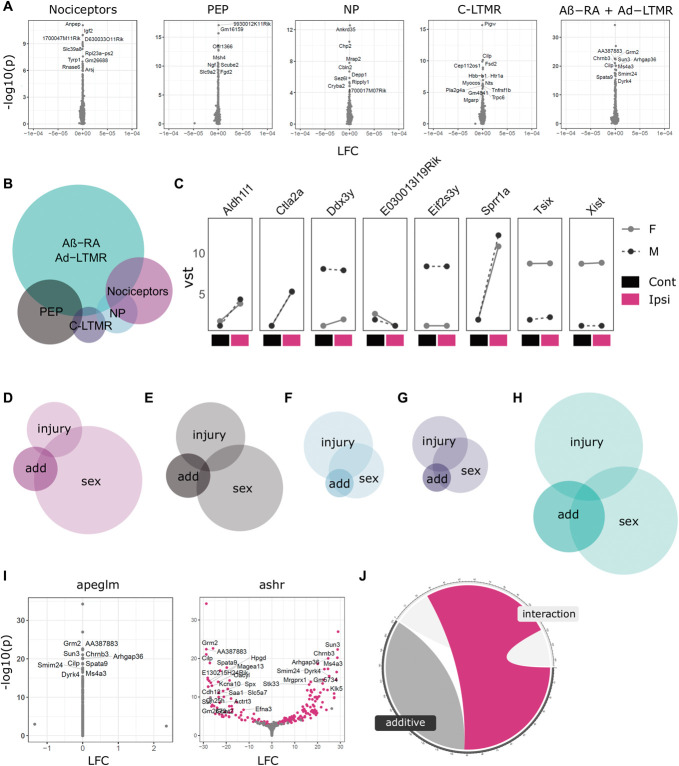
Dorsal root ganglia (DRG) neurons have been well described for their role in driving both acute and chronic pain. Although nerve injury is known to cause transcriptional dysregulation, how this differs across neuronal subtypes and the impact of sex is unclear. Here, we study the deep transcriptional profiles of multiple murine DRG populations in early and late pain states while considering sex. We have exploited currently available transgenics to label numerous subpopulations for fluorescent-activated cell sorting and subsequent transcriptomic analysis. Using bulk tissue samples, we are able to circumvent the issues of low transcript coverage and drop-outs seen with single-cell data sets. This increases our power to detect novel and even subtle changes in gene expression within neuronal subtypes and discuss sexual dimorphism at the neuronal subtype level. We have curated this resource into an accessible database for other researchers ( https://livedataoxford.shinyapps.io/drg-directory/ ). We see both stereotyped and unique subtype signatures in injured states after nerve injury at both an early and late timepoint. Although all populations contribute to a general injury signature, subtype enrichment changes can also be seen. Within populations, there is not a strong intersection of sex and injury, but previously unknown sex differences in naïve states-particularly in Aβ-RA + Aδ-low threshold mechanoreceptors-still contribute to differences in injured neurons.


Conflict of interest statement

The authors declare no conflicts of interest relevant to this article. More broadly, D. L. Bennett has acted as a consultant on behalf of Oxford Innovation for Amgen, Biointervene, Bristows, LatigoBio, GSK, Ionis, Lilly, Olipass, Orion, Regeneron, and Theranexus over the past 2 years. He has received research funding from Lilly and AstraZeneca. He has received an industrial partnership grant from the BBSRC and AstraZeneca.

Sponsorships or competing interests that may be relevant to content are disclosed at the end of this article.

Figures

Figure 1.
Figure 1.
Experimental overview for mouse subtype RNA-seq of 5 neuronal subtypes after nerve injury. (A) Overview schematic, highlighting 5 transgenic mouse lines used to label and sort “bulk” subtype samples for downstream sequencing. Males and females were collected 3 days (3D) and 4 weeks (4W) after spared nerve injury (SNI). (B) Transgenic validation of Scn10acre, CalcacreERT2, MrgprdcreERT2, ThcreERT2, and Ntrk2creERT2 lines. (B.i) Example IHC. (B.ii) IHC overlap with reporter line. (B.iii) Reporter overlap with IHC. (C) Samples FACS gating (Mrgprd+ cells, gating for scatter, live/dead, and tdTomato), with addition details in Supplemental Figure 1, available at http://links.lww.com/PAIN/B823. (D) Percentage of uniquely mapped reads by sample. (E) Atf3 raw count data. (F) Xist raw count data. (G) Schematic of QC. 154 samples passed. (H) PCA biplot by subtype (i) and injury status (ii). Plots uncorrected for batch are shown in Supplemental Figure 2, available at http://links.lww.com/PAIN/B823. C-LTMR, C low-threshold mechanoreceptor; DRG, dorsal root ganglia; IB4, isolectin B4; PCA, principal component analysis; PEP, peptidergic; PV, parvalbumin; QC, quality control.
Figure 2.
Figure 2.
RNA-seq validation against previously published work, combining male + female samples. (A) Contralateral tissue was compared with previously published naïve data sets. (B) Hallmark gene expression across contralateral samples. Expression plotted as VST transformed count data. (C) Ion channel expression across contralateral samples. (D and E) Zheng et al. 2019 naïve subpopulation clustering (mixed sex). (F–J) Subtype enrichment against gene sets derived from Zheng et al. 2019 (see methods for details, gene sets provided in Supplemental Digital Content, Table 3, available at http://links.lww.com/PAIN/B826). (F) Nociceptors, (G) peptidergic nociceptors, (H) nonpeptidergic nociceptors, (I) C-LTMRs, and (J) Aβ-RA + Aδ-LTMRs. Plotted as normalized enrichment scores, coloured by P-value. Full lists of scores and P-values are available in Supplemental Digital Content, Table 2, available at http://links.lww.com/PAIN/B825. C-LTMRs, C low-threshold mechanoreceptors; NP, nonpeptidergic; PEP, peptidergic; PROP, proprioceptors; VST, variance stabilizing transformation.
Figure 3.
Figure 3.
Few sex differences are seen in uninjured neuronal subtypes, with the majority in Ntrk2+ LTMRs. (A) Euler plot for sexually dimorphic genes. (B) Number of sexually dimorphic genes within each subpopulation examined (FDR < 0.05, LFC > 1). (C and D) Contralateral samples show differential gene expression across sexes (male vs female, ie, LFC > 0 = upregulated in males). (E) In situ validation of gene candidates regulated in Aβ-RA + Aδ-LTMRs (n = 3 mice, Mann–Whitney test. Data points represent individual cells). Top to bottom: Kcnj11 (P < 0.0001), Kcns1 (P = 0.0054), and Cacng2 (P = 0.0242) (green) with Ntrk2 (magenta). Cacng2 RNA-seq suggests upregulation in females (opposite). (F) Dot plots highlighting key DEGs, plotted as median transformed counts. DEGs, differentially expressed genes; LFC, log2 fold changes; LTMRs, low=threshold mechanoreceptors; NP, nonpeptidergic; PEP, peptidergic.
Figure 4.
Figure 4.
General injury mapping shows stereotyped changes and subtype differences across time points. (A) Euler plot showing differentially expressed genes after SNI at 3 days (3D) and 4 weeks (4W) for combined subtypes. (B) Key injury markers are upregulated across ipsilateral samples at both time points, plotted as median VST expression across groups. (C) Injured samples (ipsi) show differential gene expression across time points (4W vs 3D). (D and E) GSEA analysis of subtype enrichment between 4W and 3D ipsilateral samples. NP and C-LTMR signatures are significantly reduced at 4 weeks, with values listed in Supplemental Digital Content, Table 12, available at http://links.lww.com/PAIN/B835. (E) Enrichment plots for key subtypes, by the enrichment score for ranked genes (black). (F) Example of differentially expressed genes (DEGs) shared across time points, plotted as median VST expression across groups. (G and H) Supervised PCA biplot for DEGs at 3 days (G) and 4 weeks (H). (I) Dendrogram split by k-means of 2, highlighting positive and negative injury scores from 3D DEGs largely correlate to the sample condition. (J and K) PC1 correlation across subtypes and time. Boxplot whiskers show 1.5 IQR. (J) 3D signature: All 5 subtypes show a significant difference between ipsilateral and contralateral samples at both time points (Kruskal–Wallis rank sum, followed by pairwise Wilcoxon with BH correction against a grouping factor [population, condition, and timepoint]). Only NP and C-LTMR ipsilateral samples are different between 4 weeks and 3 days (FDR = 0.00185 and 0.00995, respectively), reflecting their return towards baseline. (K) 4W signature: All 5 subtypes show a significant difference between ipsilateral and contralateral samples, plotted as score for visualization with (J). Cont, contralateral; Ipsi, ipsilateral; IQR, interquartile range; LTMR, low-threshold mechanoreceptors; NP, nonpeptidergic; PCA, principal component analysis; PEP, peptidergic; SNI, spared nerve injury; VST, variance stabilizing transformation.
Figure 5.
Figure 5.
Subtype injury mapping shows stereotyped changes and subtype differences across time points. (A–D) Differential gene expression across time points and subtypes. Volcano plots for 3-day (A) and 4-week (B) subtypes, with DEGs highlighted in magenta. Euler plots showing DEG overlap at 3D (C) and 4W (D). (E–I) GSEA analyses against previously published data reveals a lack of clear subpopulation signatures in injured nociceptors and NP nociceptors by 4 weeks (scores listed in Supplemental Digital Content, Table 18, available at http://links.lww.com/PAIN/B841). All subtypes show a significant enrichment for Aδ-LTMRs, which was not seen in naïve nociceptor populations. Naïve data are shown in Figures 2J,L: Subtype-specific signatures extracted from 4W SPCA presented in Figure 4 shows specificity for Ntrk2-injured neurons. (J) PC2 correlation across subtypes 4 weeks after SNI. Boxplot whiskers show 1.5 IQR. (K) Ranked loadings (PC2) for all DEGs at 4 weeks after injury. Dashed lines highlight quartiles. L. STRING database interactions for top 15 DEGs (ranked by loadings). DEGs, differentially expressed genes; IQR, interquartile range; LFC, log2 fold changes; LTMR, low-threshold mechanoreceptors; NP, nonpeptidergic; PEP, peptidergic; PROP, proprioceptors; SNI, spared nerve injury; SPCA, supervised principal component analysis.
Figure 6.
Figure 6.
Sexual dimorphism in neuronal subtype injury responses. (A) Transcriptomic analyses in primary afferents reveal no clear interaction of sex and injury 4 weeks after SNI. (B) Euler plot of DEGs using an additive model contrasting sex and injury differences. (C) Line plots of DEGs shared across at least 2 subtypes. (D–H) Across subtypes, DEGs from this additive modelling (“add”) appear to be driven partly by sex differences in basal expression levels (“sex”), as well as some overlap with genes generally regulated in injury (“injury”). (D) General nociceptors. (E) PEP nociceptors. (F) NP nociceptors. (G) C-LTMRs. (H) Aβ-RA + Aδ-LTMRs. (I) Example volcano plots for the interaction of sex and injury for Aβ-RA + Aδ-LTMRs, with apeglm and ashr shrinkage. (J) 42% of regulated genes are shared across our interaction and additive models (magenta) which are not regulated with apeglm. Cont, contralateral; DEGs, differentially expressed genes; Ipsi, ipsilateral; LFC, log2 fold changes; LTMR, low-threshold mechanoreceptors; NP, nonpeptidergic; PEP, peptidergic; SNI, spared nerve injury.

Comment in

References

    1. Acosta C, Djouhri L, Watkins R, Berry C, Bromage K, Lawson SN. TREK2 expressed selectively in IB4-binding C-fiber nociceptors hyperpolarizes their membrane potentials and limits spontaneous pain. J Neurosci 2014;34:1494–509. - PMC - PubMed
    1. Anders S, Pyl PT, Huber W. HTSeq–a Python framework to work with high-throughput sequencing data. Bioinformatics 2015;31:166–9. - PMC - PubMed
    1. Andrews S. FastQC: a quality control tool for high throughput sequence data. 2010. Available at: http://www.bioinformatics.babraham.ac.uk/projects/fastqc/. Accessed November 15, 2021.
    1. Attal N, Perrot S, Fermanian J, Bouhassira D. The neuropathic components of chronic low back pain: a prospective multicenter study using the DN4 questionnaire. J Pain 2011;12:1080–7. - PubMed
    1. Bailey AL, Ribeiro-Da-Silva A. Transient loss of terminals from non-peptidergic nociceptive fibers in the substantia gelatinosa of spinal cord following chronic constriction injury of the sciatic nerve. Neuroscience 2006;138:675–90. - PubMed

Publication types