Stretch Evolution of Electronic Coupling of the Thiophenyl Anchoring Group with Gold in Mechanically Controllable Break Junctions
- PMID: 37318265
- PMCID: PMC10291638
- DOI: 10.1021/acs.jpclett.3c00370
Stretch Evolution of Electronic Coupling of the Thiophenyl Anchoring Group with Gold in Mechanically Controllable Break Junctions
Abstract
The current-voltage characteristics of a single-molecule junction are determined by the electronic coupling Γ between the electronic states of the electrodes and the dominant transport channel(s) of the molecule. Γ is profoundly affected by the choice of the anchoring groups and their binding positions on the tip facets and the tip-tip separation. In this work, mechanically controllable break junction experiments on the N,N'-bis(5-ethynylbenzenethiol-salicylidene)ethylenediamine are presented, in particular, the stretch evolution of Γ with increasing tip-tip separation. The stretch evolution of Γ is characterized by recurring local maxima and can be related to the deformation of the molecule and sliding of the anchoring groups above the tip facets and along the tip edges. A dynamic simulation approach is implemented to model the stretch evolution of Γ, which captures the experimentally observed features remarkably well and establishes a link to the microscopic structure of the single-molecule junction.
Conflict of interest statement
The authors declare no competing financial interest.
Figures


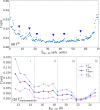
 ) evaluated using the SLM applied to the
transmission function T(E), which
are calculated for 1000 thermodynamically most relevant configurations
for individual tip–tip separation (Stip–tip). (a) ΓE - the data points with peaks are marked
using dark blue arrows. (b)
  ,
,  , and
, and  reveal a falling trend for Stip–tip interval (11.51 Å < Stip–tip < 21.72 Å) and a rising trend for Stip–tip > 21.72 Å. Peaks are
visible
for
  at Stip–tip: 13.08, 17.79, and 21.72 Å, respectively. The four subdivisions
I, II, III, and IV define the regions with the dominant anchoring
position pairs: edge–edge, tip–edge, tip–edge
+ tip–tip, and tip–tip, respectively. Refer to the dominant
anchoring positions in Figure 3(a).
 ) - four distinct Stip–tip regions are discernible. For Stip–tip < 13.87 Å, the dominating mean
anchoring positions of the sulfur atoms on the Au(111) facets (
 ) are either edge–edge or tip–edge.
For Stip–tip between 14.65 and
18.58 Å, the tip-edge
  dominates over edge–edge
  . The contribution of edge–edge
  diminishes for Stip–tip > 19.36 Å with the emergence of tip–tip
  . For Stip–tip between 19.36 and 20.9 Å, the tip-edge
  dominate. For Stip–tip > 21.72 Å, the
  are solely tip–tip. (b) Theoretically
determined stretch evolution of the mean curvature (
 ) - an overall falling trend is discernible.
Trough-like features are visible at Stip–tip: 13.87, 17.79, and 20.9 Å, respectively. A distinct sharp peak
is visible at Stip–tip: 21.72 Å.
(c) Theoretically determined stretch evolution of the mean anchoring
angle (
 ) - An overall rising trend until saturation
is discernible. Peaks are visible at Stip–tip: 15.44 and 18.58 Å.

Similar articles
-
Current-voltage characteristics of single-molecule diarylethene junctions measured with adjustable gold electrodes in solution.Beilstein J Nanotechnol. 2012;3:798-808. doi: 10.3762/bjnano.3.89. Epub 2012 Nov 26. Beilstein J Nanotechnol. 2012. PMID: 23365792 Free PMC article.
-
Probing the local environment of a single OPE3 molecule using inelastic tunneling electron spectroscopy.Beilstein J Nanotechnol. 2015 Dec 24;6:2477-2484. doi: 10.3762/bjnano.6.257. eCollection 2015. Beilstein J Nanotechnol. 2015. PMID: 26885460 Free PMC article.
-
Electrical properties and mechanical stability of anchoring groups for single-molecule electronics.Beilstein J Nanotechnol. 2015 Jul 17;6:1558-67. doi: 10.3762/bjnano.6.159. eCollection 2015. Beilstein J Nanotechnol. 2015. PMID: 26425407 Free PMC article.
-
Advance of Mechanically Controllable Break Junction for Molecular Electronics.Top Curr Chem (Cham). 2017 Jun;375(3):61. doi: 10.1007/s41061-017-0149-0. Epub 2017 May 24. Top Curr Chem (Cham). 2017. PMID: 28540580 Review.
-
Supramolecular Systems and Chemical Reactions in Single-Molecule Break Junctions.Top Curr Chem (Cham). 2017 Apr;375(2):42. doi: 10.1007/s41061-017-0123-x. Epub 2017 Mar 23. Top Curr Chem (Cham). 2017. PMID: 28337670 Review.
Cited by
-
Resolving molecular frontier orbitals in molecular junctions with kHz resolution.Chem Sci. 2024 Sep 23;15(42):17328-36. doi: 10.1039/d4sc05285d. Online ahead of print. Chem Sci. 2024. PMID: 39360008 Free PMC article.
-
Tuning the Spin Interaction in Nonplanar Organic Diradicals through Mechanical Manipulation.ACS Nano. 2024 Oct 1;18(39):26514-26521. doi: 10.1021/acsnano.4c01963. Epub 2024 Sep 20. ACS Nano. 2024. PMID: 39304184 Free PMC article.
References
-
- Cuevas J. C.; Scheer E.. Molecular electronics: an introduction to theory and experiment; World Scientific Series in Nanoscience and Nanotechnology; 1; World Scientific, New Jersey, 2010.
LinkOut - more resources
Full Text Sources
Miscellaneous

