. 2023 Aug 7;155(8):e202213166.
doi: 10.1085/jgp.202213166. Epub 2023 Jun 15.

Interactions between selectivity filter and pore helix control filter gating in the MthK channel

Affiliations

Interactions between selectivity filter and pore helix control filter gating in the MthK channel

Wojciech Kopec et al. J Gen Physiol. .

Abstract

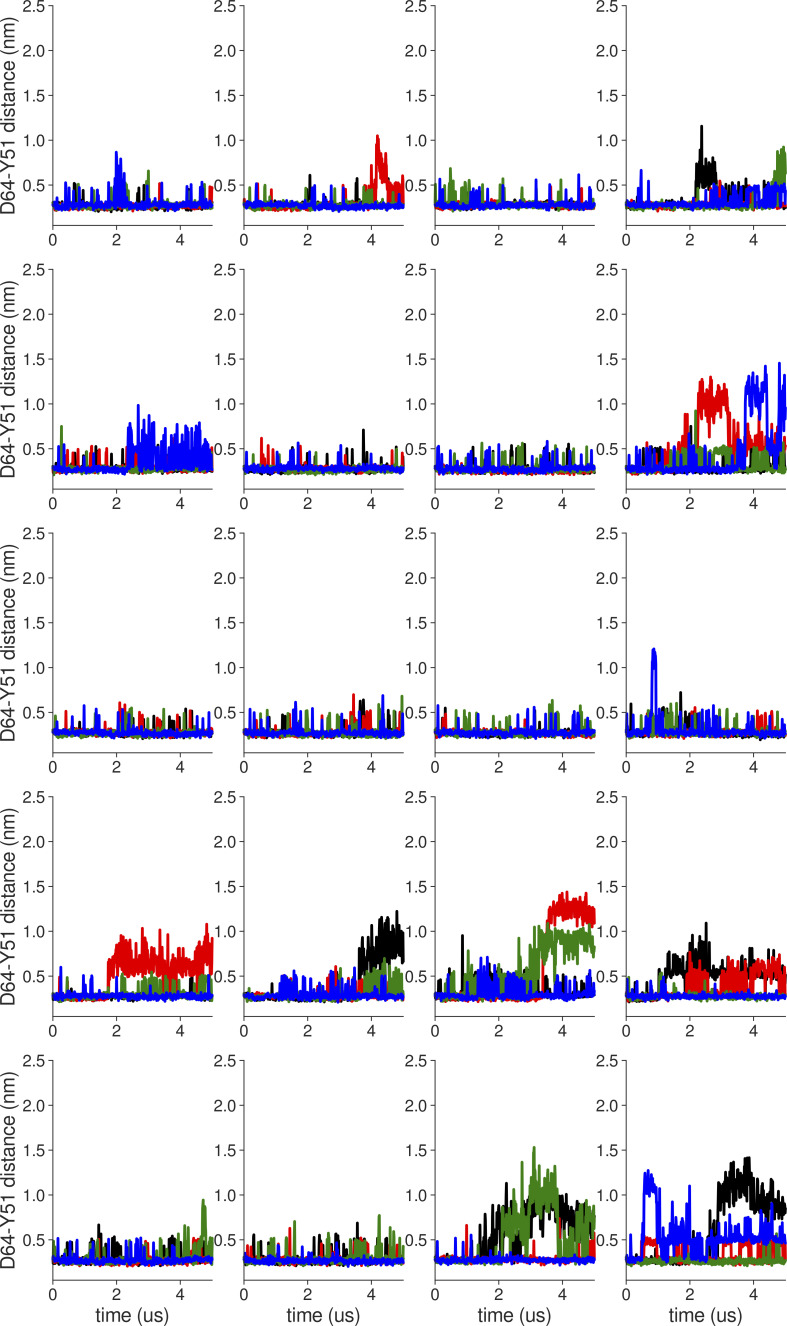
K+ channel activity can be limited by C-type inactivation, which is likely initiated in part by dissociation of K+ ions from the selectivity filter and modulated by the side chains that surround it. While crystallographic and computational studies have linked inactivation to a "collapsed" selectivity filter conformation in the KcsA channel, the structural basis for selectivity filter gating in other K+ channels is less clear. Here, we combined electrophysiological recordings with molecular dynamics simulations, to study selectivity filter gating in the model potassium channel MthK and its V55E mutant (analogous to KcsA E71) in the pore-helix. We found that MthK V55E has a lower open probability than the WT channel, due to decreased stability of the open state, as well as a lower unitary conductance. Simulations account for both of these variables on the atomistic scale, showing that ion permeation in V55E is altered by two distinct orientations of the E55 side chain. In the "vertical" orientation, in which E55 forms a hydrogen bond with D64 (as in KcsA WT channels), the filter displays reduced conductance compared to MthK WT. In contrast, in the "horizontal" orientation, K+ conductance is closer to that of MthK WT; although selectivity filter stability is lowered, resulting in more frequent inactivation. Surprisingly, inactivation in MthK WT and V55E is associated with a widening of the selectivity filter, unlike what is observed for KcsA and reminisces recent structures of inactivated channels, suggesting a conserved inactivation pathway across the potassium channel family.


Conflict of interest statement

Disclosures: The authors declare no competing interests exist.

Figures

Figure 1.
Figure 1.
Basic architecture of a K+ channel. (a) Crystal structure of MthK in an open state (PDB ID 3LDC, only two diagonally opposite subunits of a tetramer are shown), with highlighted important elements—the selectivity filter in its conducting conformation consists of four main K+ binding sites S1–S4 and additional binding sites S0 and Scav. The central cavity, typically filled with water molecules, is located below the filter and above the activation gate. (b) All-atom system used in MD simulations. The channel is shown in grey, lipids (POPC) in orange, water as red-white spheres, K+ ions as purple spheres, and chloride ions as green spheres. Transmembrane voltage of 300 mV was used in simulations, resulting in an outward permeation of K+ ions through the channel as indicated by the arrow. (c–e) Closer view on an interaction network behind the selectivity filter. In WT MthK, D64 makes hydrogen bonds (green springs) with Y51 and two crystallographic water molecules (c). In KcsA (PDB ID 1K4C; d) a residue corresponding to Y51 is W67. Additionally protonated glutamate (E71, V55 in MthK) takes part in the same interaction network, with only one water molecule. The model of MthK V55E (e) is based on MthK WT, with V55 replaced with protonated E71 from KcsA and one water molecule.
Figure 2.
Figure 2.
Effects of V55E mutation on MthK channel gating. (a) Representative single-channel current through MthK WT and V55E channels over a range of voltages. For these recordings, solutions at both sides of the membrane contained 200 mM KCl. “O” and “C” indicate open and closed channel current levels, respectively. Strong depolarization (200 mV) leads to decreased open probability (Po) for WT channels, and V55E channels consistently display briefer openings than WT at all tested voltages. (b) Current through MthK WT channels with 5 mM external K+. This bilayer contained two active channels, indicated by open levels “O1” and “O2.” Lower external [K+] enhances inactivation at mildly depolarized voltages. (c) Po vs. voltage for WT channels with 200 mM (black circles, n = 5 bilayers) or 5 mM external K+ (open circles, n = 3 bilayers), compared with V55E with 200 mM external K+ (n = 5 bilayers). (d) MthK WT channel open times were voltage dependent, with a maximal mean open time of 1,200 ± 120 ms at 60 mV; in contrast V55E were much briefer, with the mean open time not exceeding 6.7 ± 0.2 ms over a 400-mV range. (e) WT and V55E closed times were similar over a wide range of voltages, consistent with the idea that the major effect of the V55E mutation was to destabilize the open/conducting state relative to WT. [K+]ext = 200 mM (WT n = 5; V55E n = 5).
Figure 3.
Figure 3.
Effects of V55E mutation on MthK channel conductance. (a and b) Representative all-points histograms from a WT and a V55E channel, respectively, constructed from selected data segments at 100 and 200 mV. Peaks correspond to open and closed current levels. These were fitted with two Gaussian components (blue dashed lines), and the difference between the means yields an estimate of the current amplitude. Upper panels show histograms on a linear scale; the same histograms are shown on a logarithmic scale on the corresponding lower panels. (c) Unitary current vs. voltage for WT and V55E channels, determined from all-points histograms at voltages ranging from −200 to +200 mV. Data points represent means ± SEM (smaller points represent data from individual experiments). (d) Representative single-channel openings from WT and V55E channels at 100 mV (top) and 200 mV (lower). V55E openings with durations >1.074 ms are indicated by an asterisk. (e) Histograms of amplitudes of single-channel openings with durations >1.074 ms at 100 mV, each normalized to an area of 1.0 (WT, 81 openings; V55E, 963 openings). Mean unitary currents for these openings were: WT 9.6 ± 0.5 pA; V55E 5.8 ± 0.5 pA (mean ± SD). (f) Histograms as in e from openings at 200 mV (WT, 136 openings; V55E, 106 openings). Mean unitary currents for these openings were: WT 14.2 ± 0.9 pA; V55E 10.0 ± 1.3 pA (mean ± SD).
Figure 4.
Figure 4.
Outward currents in MthK V55E in MD simulations with the AMBER force field. (a) Starting structure of MthK V55E and the definition of distances used as opening coordinates (A88 CA–CA distance: activation gate; T59 CA–CA distance: S4 width). (b) Outward current through MthK WT (black traces) and MthK V55E (red traces) as a function of the activation gate opening. Blue vertical line marks the largest opening level seen experimentally. (c) Same as b but with the S4 width used as the opening coordinate. (d) Two rotameric states (orientations) of E55 observed in MD simulations. (e) Outward current in E55 vertical (brown traces) and E55 horizontal (light orange traces) simulation sets in comparison to current in V55E (red traces), as a function of the activation gate opening. (f) Same as e but with the S4 width used as the opening coordinate. (g) Frequency of the vertical rotameric state of E55 as a function of the activation gate opening. (h) Correlation between S4 width and the activation gate opening in E55 vertical and E55 horizontal in comparison to WT. Points for which the maximal current of ∼16 pA was recorded are indicated by a violet ring. (i) Negative logarithmic densities (“free energy profiles”) of K+ ions in the SF. Minima correspond to stable ion binding sites and maxima to free energy barriers between them. (j) Currents in all systems with the Y62 (forming S1 and S0 sites) CA–CA distance used as an opening coordinate. For all panels, error bars represent 95% confidence intervals.
Figure 5.
Figure 5.
Outward currents in MthK V55E in MD simulations with the CHARMM force field. (a) Outward current through MthK WT (black traces) and MthK V55E (red traces) as a function of the activation gate opening. Blue vertical line marks the largest opening level seen experimentally. (b) Same as a but with the S4 width used as the opening coordinate. (c) Frequency of the vertical rotameric state of E55 as a function of the activation gate opening. (d) Outward current in E55 vertical (brown traces) and E55 horizontal (light orange traces) in comparison to current V55E (red traces), as a function of the activation gate opening. (e) Same as d but with the S4 width used as the opening coordinate. (f) Correlation between S4 width and the activation gate opening in E55 vertical and E55 horizontal in comparison to WT. Points for which the maximal current of ∼20 pA was recorded are indicated by a violet cross. (g) Negative logarithmic densities (free energy profiles) of K ions in the SF. Minima correspond to stable ion binding sites and maxima to free energy barriers between them. (h) Current in all systems with the G63 (forming S0 site) CA–CA distance used as an opening coordinate. For all panels, error bars represent 95% confidence intervals.
Figure S1.
Figure S1.
Differences in energetics of the vertical vs. horizontal orientation of the E55 side chain in CHARMM and AMBER force fields. (a) E55 side chain in the vertical orientation, making a hydrogen bond with D64. Partial charges of atoms participating in the hydrogen bond are given in parentheses, first the value for CHARMM and second for AMBER. (b and c) Exemplary interaction energies between hydrogen bond donors (H & OE2 atoms) and acceptor (OD1 atom), in both CHARMM and AMBER, respectively. (d) E55 side chain in one of the horizontal orientations visited in the AMBER force field. Atoms participating in two dihedral angles involving the H atom from the protonated E55 side chain are listed. (e and f) Exemplary torsional energy in a trajectory of two dihedrals involving the H from the E55 side chain, in both CHARMM and AMBER, respectively.
Figure 6.
Figure 6.
Conformations of inactivated filters in different K+ channels. (a) Typical conducting SF conformation shown for reference (PDB ID 1K4C). (b) Inactivated (“constricted” or “pinched”) KcsA filter (PDB ID 1K4D). The filter narrows at the level of the first glycines (G77) and shows valine flipping at V76. (c) Inactivated (“dilated”) filter of Shaker W434F. D447 side chains flip toward the extracellular side, and the SF is widened/dilated at the level of the second glycines (G446). (d) Inactivated (dilated) filter of Kv1.2 W362F. Similar to c D375 side chains are flipped, and the SF is widened. (e and f) Two (1 and 2) inactivated conformations of Kv1.3. Again, D449 side chains are flipped, and the SF is dilated. (g–i) Examples of SF conformations observed in this work in long simulations of either MthK WT (g) or MthK V55E (h and i) at 300 mV. In all cases, flipping of aspartates (D64) is observed, together with widening at the level of the second glycines (G63). Valine (V60) flipping is also observed as well. (j–m) Cumulative inactivation events recorded in simulations with AMBER (j and l) and CHARMM (k and m) force fields at 300 and 150 mV, respectively. The events were identified based on distances between G63 CA atoms in oppositely oriented monomers.
Figure S2.
Figure S2.
Individual distance traces between D64 CG atom and Y51 HH atom in long MthK WT AMBER simulations at 300 mV. Each color refers to one of the channel monomers. Each panel shows traces from an independent, 5-μs long simulation. Distance values >1 nm indicate broken interactions.
Figure S3.
Figure S3.
Individual distance traces between D64 CG atom and Y51 HH atom in long MthK V55E AMBER simulations at 300 mV. Each color refers to one of the channel monomers. Each panel shows traces from an independent, 5-μs long simulation. Distance values >1 nm indicate broken interactions.
Figure S4.
Figure S4.
Individual distance traces between D64 CG atom and Y51 HH atom in long MthK WT CHARMM simulations at 300 mV. Each color refers to one of the channel monomers. Each panel shows traces from an independent, 5-μs long simulation. Distance values >1 nm indicate broken interactions.
Figure S5.
Figure S5.
Individual distance traces between D64 CG atom and Y51 HH atom in long MthK V55E CHARMM simulations at 300 mV. Each color refers to one of the channel monomers. Each panel shows traces from an independent, 5-μs long simulation. Distance values >1 nm indicate broken interactions.
Figure S6.
Figure S6.
Individual distance traces between D64 CG atom and Y51 HH atom in long MthK WT AMBER simulations at 150 mV. Each color refers to one of the channel monomers. Each panel shows traces from an independent, 5-μs long simulation. Distance values >1 nm indicate broken interactions.
Figure S7.
Figure S7.
Individual distance traces between D64 CG atom and Y51 HH atom in long MthK V55E AMBER simulations at 150 mV. Each color refers to one of the channel monomers. Each panel shows traces from an independent, 5-μs long simulation. Distance values >1 nm indicate broken interactions.
Figure S8.
Figure S8.
Individual distance traces between D64 CG atom and Y51 HH atom in long MthK WT CHARMM simulations at 150 mV. Each color refers to one of the channel monomers. Each panel shows traces from an independent, 5-μs long simulation. Distance values >1 nm indicate broken interactions.
Figure S9.
Figure S9.
Individual distance traces between D64 CG atom and Y51 HH atom in long MthK V55E CHARMM simulations at 150 mV. Each color refers to one of the channel monomers. Each panel shows traces from an independent, 5-μs long simulation. Distance values >1 nm indicate broken interactions.
Figure S10.
Figure S10.
Individual distance traces between G61 CA atoms between oppositely oriented monomers in long MthK WT AMBER simulations at 300 mV. Each panel shows traces from an independent, 5-μs long simulation.
Figure S11.
Figure S11.
Individual distance traces between G61 CA atoms between oppositely oriented monomers in long MthK V55E AMBER simulations at 300 mV. Each panel shows traces from an independent, 5-μs long simulation.
Figure S12.
Figure S12.
Individual distance traces between G61 CA atoms between oppositely oriented monomers in long MthK WT CHARMM simulations at 300 mV. Each panel shows traces from an independent, 5-μs long simulation.
Figure S13.
Figure S13.
Individual distance traces between G61 CA atoms between oppositely oriented monomers in long MthK V55E CHARMM simulations at 300 mV. Each panel shows traces from an independent, 5-μs long simulation.
Figure S14.
Figure S14.
Individual distance traces between G61 CA atoms between oppositely oriented monomers in long MthK WT AMBER simulations at 150 mV. Each panel shows traces from an independent, 5-μs long simulation.
Figure S15.
Figure S15.
Individual distance traces between G61 CA atoms between oppositely oriented monomers in long MthK V55E AMBER simulations at 150 mV. Each panel shows traces from an independent, 5-μs long simulation.
Figure S16.
Figure S16.
Individual distance traces between G61 CA atoms between oppositely oriented monomers in long MthK WT CHARMM simulations at 150 mV. Each panel shows traces from an independent, 5-μs long simulation.
Figure S17.
Figure S17.
Individual distance traces between G61 CA atoms between oppositely oriented monomers in long MthK V55E CHARMM simulations at 300 mV. Each panel shows traces from an independent, 5-μs long simulation.
Figure S18.
Figure S18.
Individual distance traces between G63 CA atoms between oppositely oriented monomers in long MthK WT AMBER simulations at 300 mV. Each panel shows traces from an independent, 5-μs long simulation.
Figure S19.
Figure S19.
Individual distance traces between G63 CA atoms between oppositely oriented monomers in long MthK V55E AMBER simulations at 300 mV. Each panel shows traces from an independent, 5-μs long simulation.
Figure S20.
Figure S20.
Individual distance traces between G63 CA atoms between oppositely oriented monomers in long MthK WT CHARMM simulations at 300 mV. Each panel shows traces from an independent, 5-μs long simulation.
Figure S21.
Figure S21.
Individual distance traces between G63 CA atoms between oppositely oriented monomers in long MthK V55E CHARMM simulations at 300 mV. Each panel shows traces from an independent, 5-μs long simulation.
Figure S22.
Figure S22.
Individual distance traces between G63 CA atoms between oppositely oriented monomers in long MthK WT AMBER simulations at 150 mV. Each panel shows traces from an independent, 5-μs long simulation.
Figure S23.
Figure S23.
Individual distance traces between G63 CA atoms between oppositely oriented monomers in long MthK V55E AMBER simulations at 150 mV. Each panel shows traces from an independent, 5-μs long simulation.
Figure S24.
Figure S24.
Individual distance traces between G63 CA atoms between oppositely oriented monomers in long MthK WT CHARMM simulations at 150 mV. Each panel shows traces from an independent, 5-μs long simulation.
Figure S25.
Figure S25.
Individual distance traces between G63 CA atoms between oppositely oriented monomers in long MthK V55E CHARMM simulations at 150 mV. Each panel shows traces from an independent, 5-μs long simulation.
Figure S26.
Figure S26.
Conformations of inactivated filters in MD simulations of MthK WT and MthK V55E at 150 mV. (a–c) Snapshots from simulations of MthK WT with the CHARMM force field. (d–f) Snapshots from simulations of MthK V55E with the CHARMM force field. (g–i) Snapshots from simulations of MthK V55E with the AMBER force field. Both aspartate (D64) sidechain flipping as well as valine (V60) and glycine (G61) carbonyl flipping can be observed when SFs lose K+ ions.
Figure S27.
Figure S27.
Average potassium occupancy of each ion binding site in the SF of MthK WT and V55E before the D64 flip. (a–d) MthK WT at 300 mV (a), MthK V55E at 300 mV (b), MthK WT at 150 mV (c), and MthK V55E at 150 mV (d).
Figure 7.
Figure 7.
Molecular events preceding the D64 flipping and filter inactivation in MD simulations of MthK WT and V55E channels. (a, c, and e) Visualizations of the SF surroundings just before the D64 flip, in MthK WT simulated with the CHARMM force field, in MthK V55E simulated with the CHARMM force field, and in MthK V55E simulated with the AMBER force field, respectively. No D64 flips nor inactivations occurred in MthK WT simulated with the AMBER force field, therefore it is not included. Water molecules inside the SF are shown in yellow. (b, d, and f) Probabilities of specific events in 50-ns simulation time before the D64 flip: additional water molecules (to the crystallographic waters) entering the space between V/E55 and D64 behind the SF (red curve), K+ ions occupying ion binding sites S0 and S1 (purple curve), water occupying inner ion binding sites (S1–S3) in the SF (yellow curve), and E55 side chain adopting the horizontal orientation (brown curve). For calculating probabilities, all trajectories in which a D64 flip occurred were aligned at the time of the first D64 flip (t = 0) and the probability was at each frame over all of these trajectories. Note that for red and brown curves, the probability is calculated for all four monomers, i.e., the value 1 would mean an event occurring in all four monomers simultaneously. Error bars represent the standard error.
Figure S28.
Figure S28.
Probabilities of molecular events in the last 50 ns of MD simulations of MthK WT with the AMBER force field.
Figure S29.
Figure S29.
Factors determining the dynamics of the D64 side chain in MthK WT in CHARMM and AMBER force fields. (a) Typical position of side chains before the aspartate flip. The D64 side chain interacts with the Y51 side chain via hydrogen bond. (b and c) Interaction energies (Coulomb and Lennard-Jones) between atoms involved in D64–Y51 hydrogen bond, in CHARMM and AMBER, respectively. (d) Snapshot after the aspartate flip, showing the D64 side chain pointing away from the protein. (e and f) Energies of the two dihedrals angles defined by heavy atoms from the D64 side chain, in CHARMM and AMBER, respectively.
Figure S30.
Figure S30.
The effects of the V55E mutation on factors determining the dynamics of the D64 side chain in CHARMM and AMBER force fields. (a) Typical position of D64, E55, and Y51 side chains in the CHARMM force field, before the aspartate flip. The E55 side chain is in the vertical orientation. (b) Effects of the V55E mutation on the average energy of the two dihedrals angles of the D64 side chain. Inset shows a typical time evolution of a high energy dihedral. (c) Average interaction energies between atoms forming the Y51–D64 hydrogen bond and E55–D64 hydrogen bond (red, in MthK V55E) or D64–water hydrogen bond (black, in MthK WT). (d) Typical position of D64, E55, and Y51 side chain the AMBER force field, before the aspartate flip. The E55 side chain is in the horizontal orientation, and there is an additional water molecule between D64 and E55 side chains. (e) Same as in b, but in the AMBER force field. (f) Same as in c, but in the AMBER force field. As the E55 side chain is typically in the horizontal orientation, and thus does not form a hydrogen bond with the D64 side chain, only interaction energies with water are included.
Figure S31.
Figure S31.
Nonequilibrium free energy calculations of E55 deprotonation. (a) System used in free energy calculations, showing a selected E55 glutamate (green box), a reference state tripeptide G-E2J-G and a lowered salt concentration of 150 mM. (b and c) End states for E55 in free energy simulations: in the State 0, E55 is protonated, and in the State 1 it is deprotonated. In both states, E55 is kept in its horizontal orientation. When E55 is deprotonated (State 1), the side chain of D64 can flip toward the extracellular space. (d and e) Distributions of work values in nonequilibrium transitions and the final estimates of ΔG obtained with pmx, in AMBER and CHARMM, respectively.
Figure S32.
Figure S32.
Comparison of the pore region between MthK and KcsA channels. (a) Sequence alignment for MthK and KcsA. (b) Visualization of the pore helix, selectivity filter and the loop following SF in MthK and KcsA. Residues are colored according to their chemical character: hydrophilic (green), hydrophobic (white), negatively charged (red), or positively charged (blue). The critical residues discussed in this work: Y51/W67, V55/E71, and D64/D80 (in MthK/KcsA) are shown as sticks. Water molecules are shown as red and white spheres.

Similar articles

Cited by

References

    1. Abraham, M.J., Murtola T., Schulz R., Páll S., Smith J.C., Hess B., and Lindahl E.. 2015. GROMACS: High performance molecular simulations through multi-level parallelism from laptops to supercomputers. SoftwareX. 1–2:19–25. 10.1016/j.softx.2015.06.001 - DOI
    1. Andersson, A.E.V., Kasimova M.A., and Delemotte L.. 2018. Exploring the viral channel KcvPBCV-1 function via computation. J. Membr. Biol. 251:419–430. 10.1007/s00232-018-0022-2 - DOI - PMC - PubMed
    1. Awoonor-Williams, E., and Rowley C.N.. 2016. Evaluation of methods for the calculation of the pKa of cysteine residues in proteins. J. Chem. Theor. Comput. 12:4662–4673. 10.1021/acs.jctc.6b00631 - DOI - PubMed
    1. Bastys, T., Gapsys V., Doncheva N.T., Kaiser R., de Groot B.L., and Kalinina O.V.. 2018. Consistent prediction of mutation effect on drug binding in HIV-1 protease using alchemical calculations. J. Chem. Theor. Comput. 14:3397–3408. 10.1021/acs.jctc.7b01109 - DOI - PubMed
    1. Baukrowitz, T., and Yellen G.. 1995. Modulation of K+ current by frequency and external [K+]: A tale of two inactivation mechanisms. Neuron. 15:951–960. 10.1016/0896-6273(95)90185-x - DOI - PubMed

Publication types

MeSH terms