. 2023 Jun 15;18(6):e0286965.
doi: 10.1371/journal.pone.0286965. eCollection 2023.

Investigating Mycobacterium tuberculosis sufR (rv1460) in vitro and ex vivo expression and immunogenicity

Affiliations

Investigating Mycobacterium tuberculosis sufR (rv1460) in vitro and ex vivo expression and immunogenicity

Lucinda Baatjies et al. PLoS One. .

Abstract

Iron is vital metal for Mycobacterium tuberculosis infection, survival, and persistence within its human host. The mobilization of sulphur (SUF) operon encodes the primary iron-sulphur (Fe-S) biogenesis system in M. tuberculosis and is induced during iron limitation and intracellular growth of M. tuberculosis, pointing to its importance during infection. To study sufR expression at single cell level during intracellular growth of M. tuberculosis a fluorescent reporter was generated by cloning a 123 bp sufR promoter region upstream of a promotorless mcherry gene in an integrating vector. Expression analysis and fluorescence measurements during in vitro culture revealed that the reporter was useful for measuring induction of the promoter but was unable to detect subsequent repression due to the stability of mCherry. During intracellular growth in THP-1 macrophages, increased fluorescence was observed in the strain harbouring the reporter relative to the control strain, however this induction was only observed in a small sub-set of the population. Since SufR levels are predicted to be elevated during infection we hypothesize that it is immunogenic and may induce an immune response in M. tuberculosis infected individuals. The immune response elicited by SufR for both whole blood assay (WBA, a short term 12-hr stimulation to characterise the production of cytokines/growth factors suggestive of an effector response) and lymphocyte proliferation assay (LPA, a longer term 7-day stimulation to see if SufR induces a memory type immune response) were low and did not show a strong immune response for the selected Luminex analytes (MCP-1, RANTES, IL-1b, IL-8, MIP-1b, IFN-g, IL-6 and MMP-9) measured in three clinical groups, namely active TB, QuantiFERON positive (QFN pos) and QFN negative (QFN neg) individuals.


Conflict of interest statement

The authors have declared that no competing interests exist.

Figures

Fig 1
Fig 1. Growth and fluorescent intensity monitored under standard culture conditions.
A) Growth curves of M. tuberculosis H37Rv_attB::pMV306 (wt control) and M. tuberculosis H37Rv_attB::pMV306_123mCherry (fluorescent reporter) strains measuring the OD600nm over the course of 22 days. Each point is the average and standard deviation of three biological replicates. B) MFI of M. tuberculosis H37Rv_attB::pMV306 (wt) and M. tuberculosis H37Rv_attB::pMV306_123mCherry (fluoresecent reporter) strains measuring the expression (MFI) of mCherry over time at day 4, day 10 and day 14. The relative fluorescence intensity of the two strains was measured in a BD FACSJazz at 510 nm using a 610/20 filter over time. The increase in fluorescence is a measure of the increase in sufR expression overtime. Each point is representative of three biological and technical replicates. The star indicates the significant difference and levels of significance between MFI of the different strains as determined by multiple unpaired t-test. p ≤ 0.05 *, p ≤ 0.01 **, p ≤ 0.001 *.
Fig 2
Fig 2. M. tuberculosis H37Rv control and fluorescent reporter strain uptake and survival within differentiated THP-1 macrophages.
THP-1 macrophages were infected with M. tuberculosis H37Rv_attB::pMV306 (wt control) and M. tuberculosis H37Rv_attB::pMV306_123mCherry (fluorescent reporter) at a MOI of 2:1 and 5:1 for 3 hrs. A) % Uptake is represented by the number of bacterial cells internalized determined by dividing CFU/ml count of the original cultures (MOI: 2:1 and 5:1) by the CFU/mL count of the bacterial culture at time 0 (3hrs after infection).Pertentage survival within differentiated THP-1 macrophages at a MOI of B) 2:1 and C) 5:1. THP-1 cells were lysed, and bacterial cells were harvested, and serial dilutions plated on solid media at 24, 48 and 72 hours post infection, to determine CFU/ml. Each point is representative of three biological and three technical replicates. No significant difference in the survival of the bacteria of the two strains as determined by multiple unpaired t-test.
Fig 3
Fig 3. sufR promoter activity during intracellular growth in THP-1 cells.
M. tuberculosis H37Rv THP-1 infection with a MOI of A) 2:1 and B) 5:1. M. tuberculosis H37Rv_attB::pMV306 (wt control) (black) and M. tuberculosis H37R_vattB::pMV306_123mCherry (fluorescent reporter)(blue) strains was used to infect THP-1 macrophage like cells, lysed at 0, 24, 48, and 72 hrs post-infection. M. smegmatis strain containing a plasmid expressing mCherry was used as positive control (red). The bacterial culture was harvested and fixed with 4% formaldehyde and run-on BD FACSjazz flow cytometer to measure the mCherry fluorescence (510 nm with 610/20 filter) which is a measure of sufR gene expression.
Fig 4
Fig 4. Luminex analysis of analyte concentrations in whole blood.
Whole blood from participants (active TB (n = 20), QFN pos (n = 9) and QFN neg (n = 17) groups) was left unstimulated or stimulated with SufR and BCG for 12 hrs or 7 days. Supernatant analytes (pg/ml) of (A) MCP-1, (B) RANTES, (C) IL-1b, (D) IL-8, (E) MIP-1b, (F) IFN-g, (G) IL-6 and (H) MMP-9 were measured. ANOVA test was performed to determine statistically significant differences between groups. Vertical bars denote 0.95 CI.
Fig 5
Fig 5. Flow cytometry phenotype screening of CD4+ T cell subsets in whole blood.
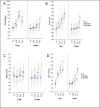
The graph shows the CD4+ T cell subsets in whole blood from active TB group (n = 20), QFN pos group (n = 9) and QFN neg group (n = 17) after 12 hours and 7 days of being unstimulated and stimulated with SufR, BCG and PHA. (A) CD4+IFN-g, (B) CD4+IL-2+, (C) CD4+IL-10+ and (D) CD4+TNF-a+. ANOVA test was performed to determine statistically significant differences between groups. Vertical bars denote 0.95 CI.

References

    1. Sakula A. Robert Koch: centenary of the discovery of the tubercle bacillus, 1882. Thorax. 1982;37: 246–251. doi: 10.1136/thx.37.4.246 - DOI - PMC - PubMed
    1. Cardona P-J. What We Have Learned and What We Have Missed in Tuberculosis Pathophysiology for a New Vaccine Design: Searching for the “Pink Swan.” Front Immunol. 2017;8. doi: 10.3389/fimmu.2017.00556 - DOI - PMC - PubMed
    1. Global tuberculosis report 2019. [cited 24 Jan 2023]. Available: https://www.who.int/publications-detail-redirect/9789241565714
    1. Global tuberculosis report 2022. [cited 6 Dec 2022]. Available: https://www.who.int/publications-detail-redirect/9789240061729
    1. Grewal R, Swanepoel C, Snyders C, Isaacs S, Abayomi E. Biomarker discovery for diagnosis and treatment of tuberculosis: a role for biobanking? Journal of Biorepository Science for Applied Medicine. 2015; 47. doi: 10.2147/BSAM.S64571 - DOI

Publication types