. 2023 Jun 16;380(6650):eade0027.
doi: 10.1126/science.ade0027. Epub 2023 Jun 16.

Induction of astrocytic Slc22a3 regulates sensory processing through histone serotonylation

Affiliations

Induction of astrocytic Slc22a3 regulates sensory processing through histone serotonylation

Debosmita Sardar et al. Science. .

Abstract

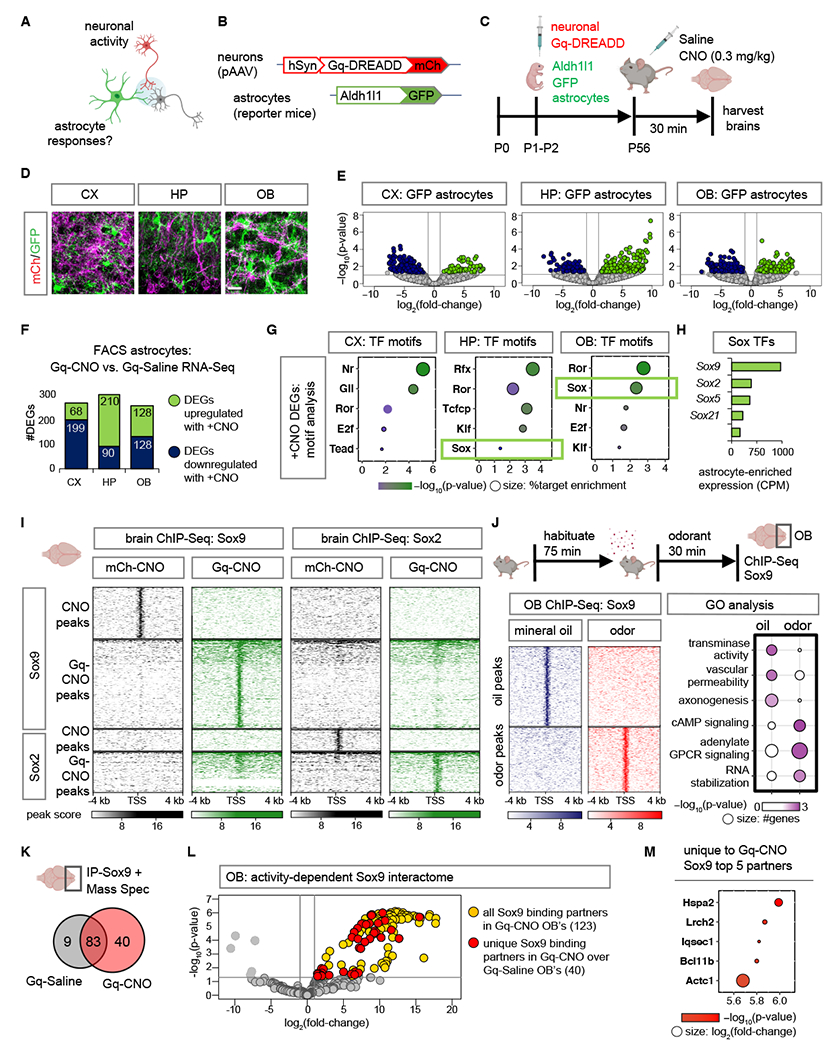
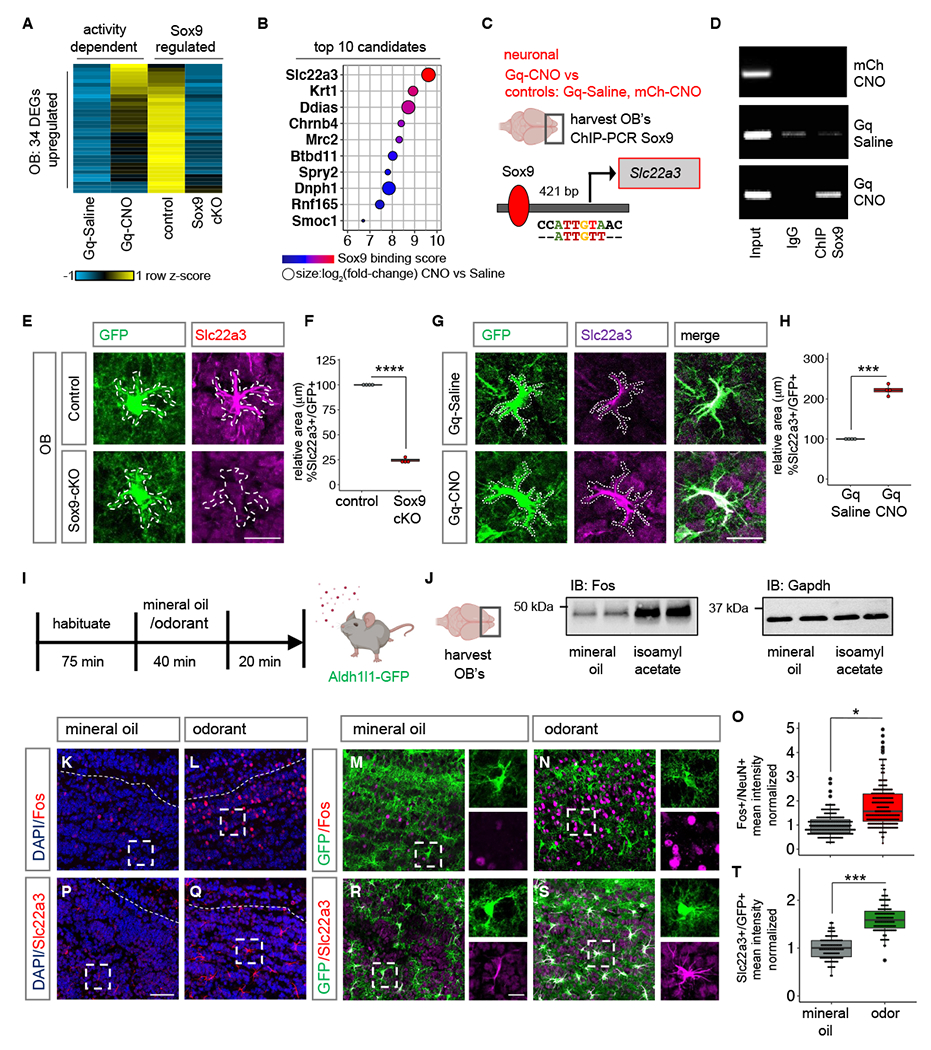
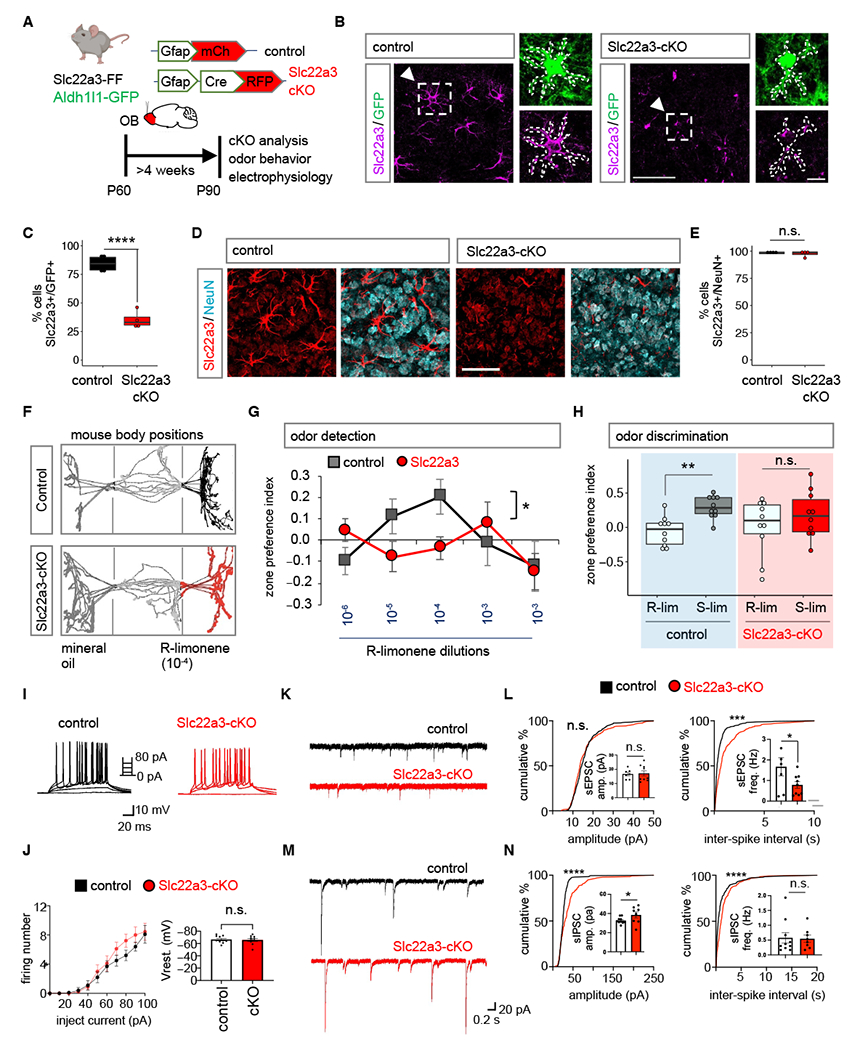
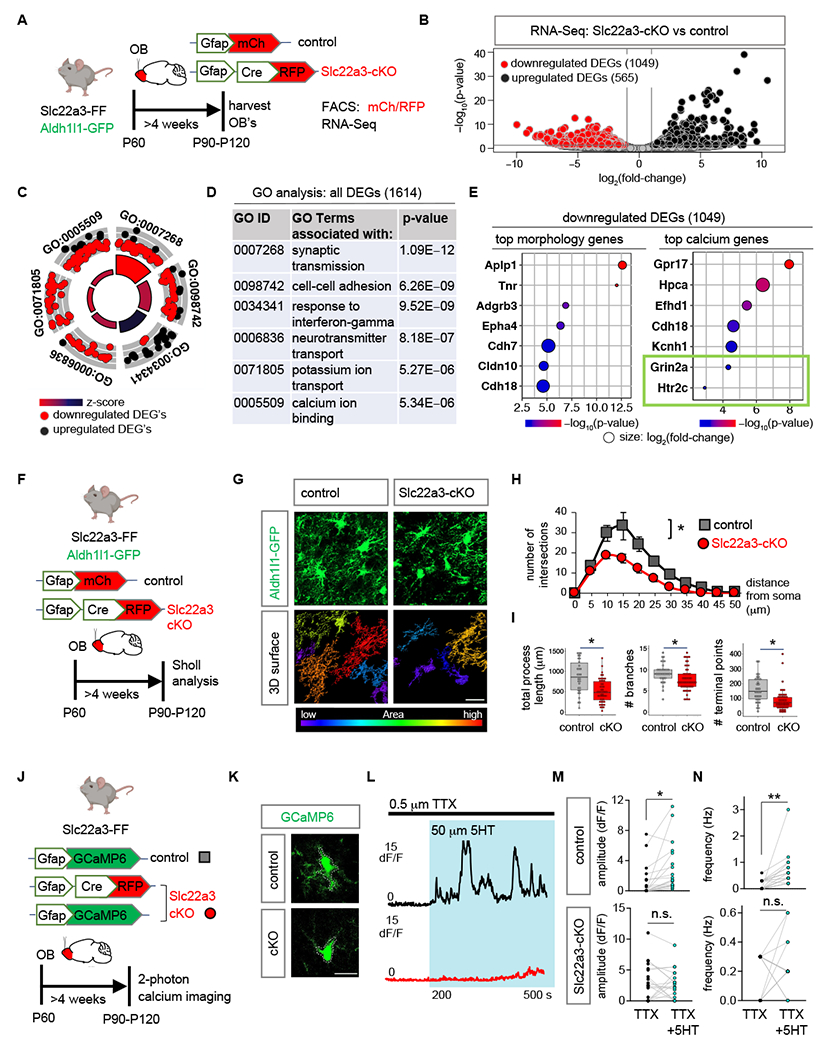
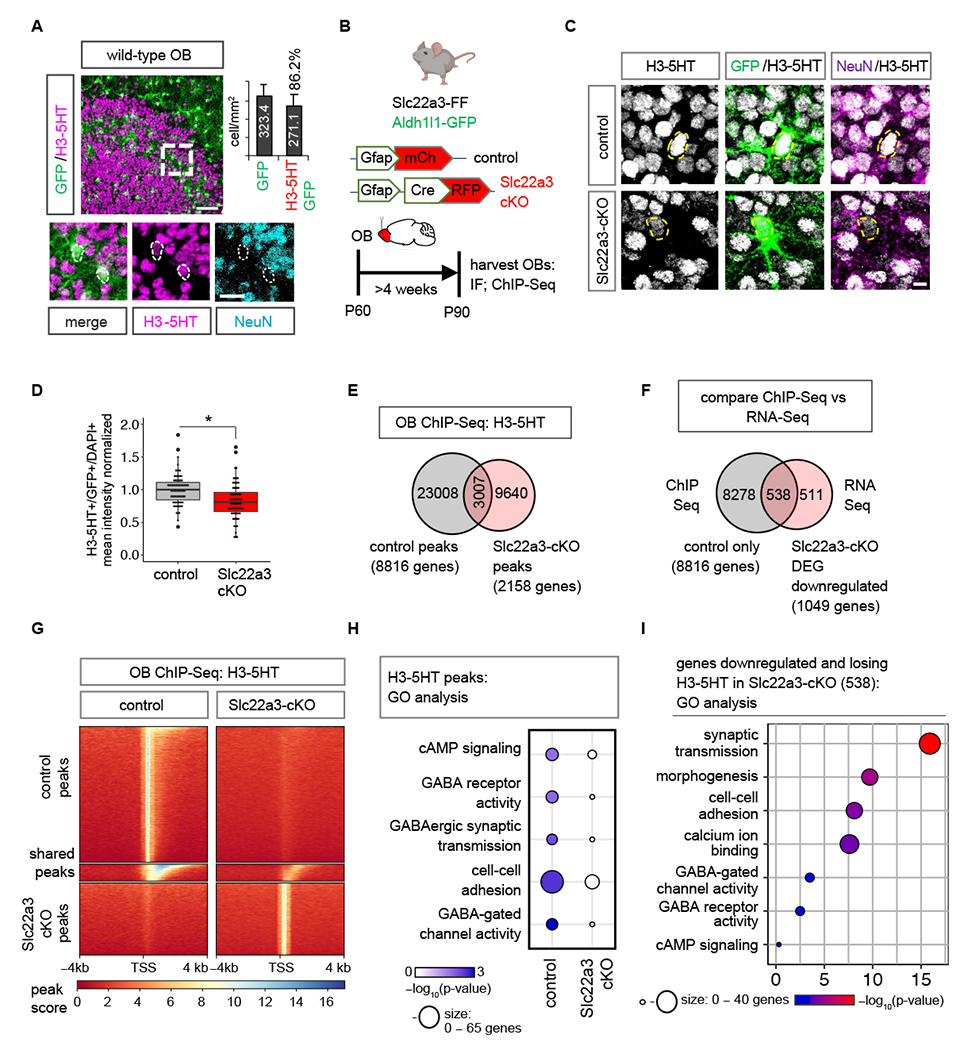
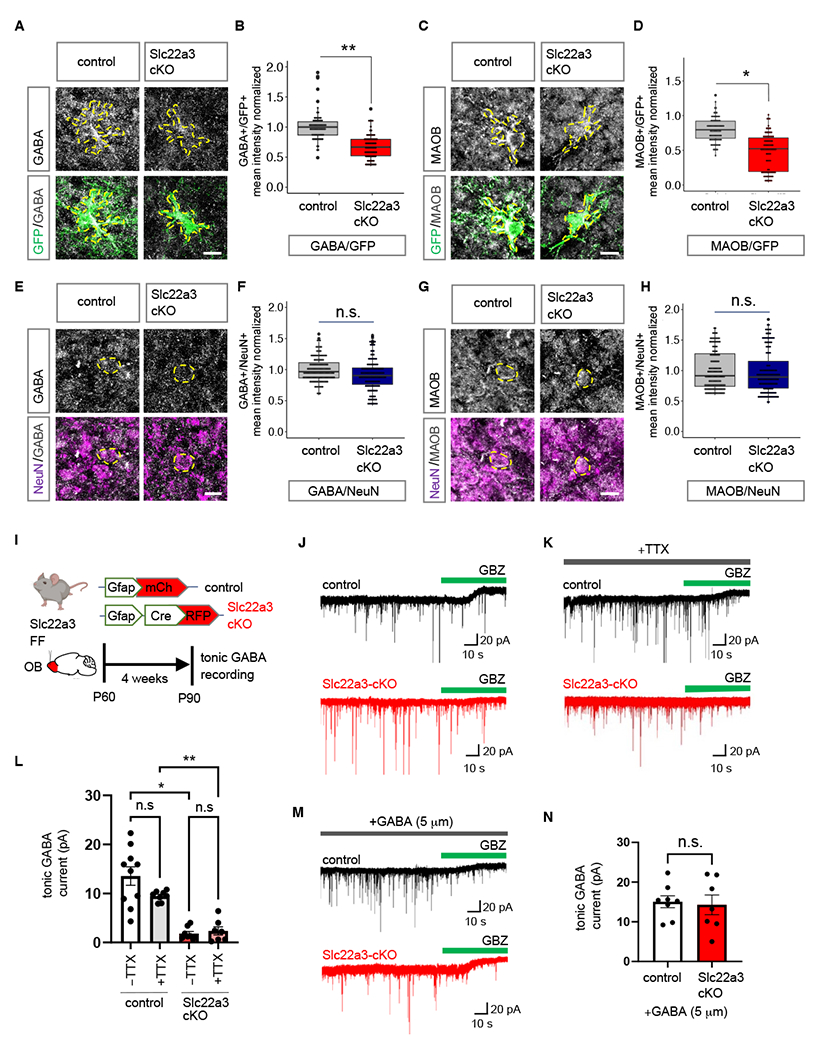
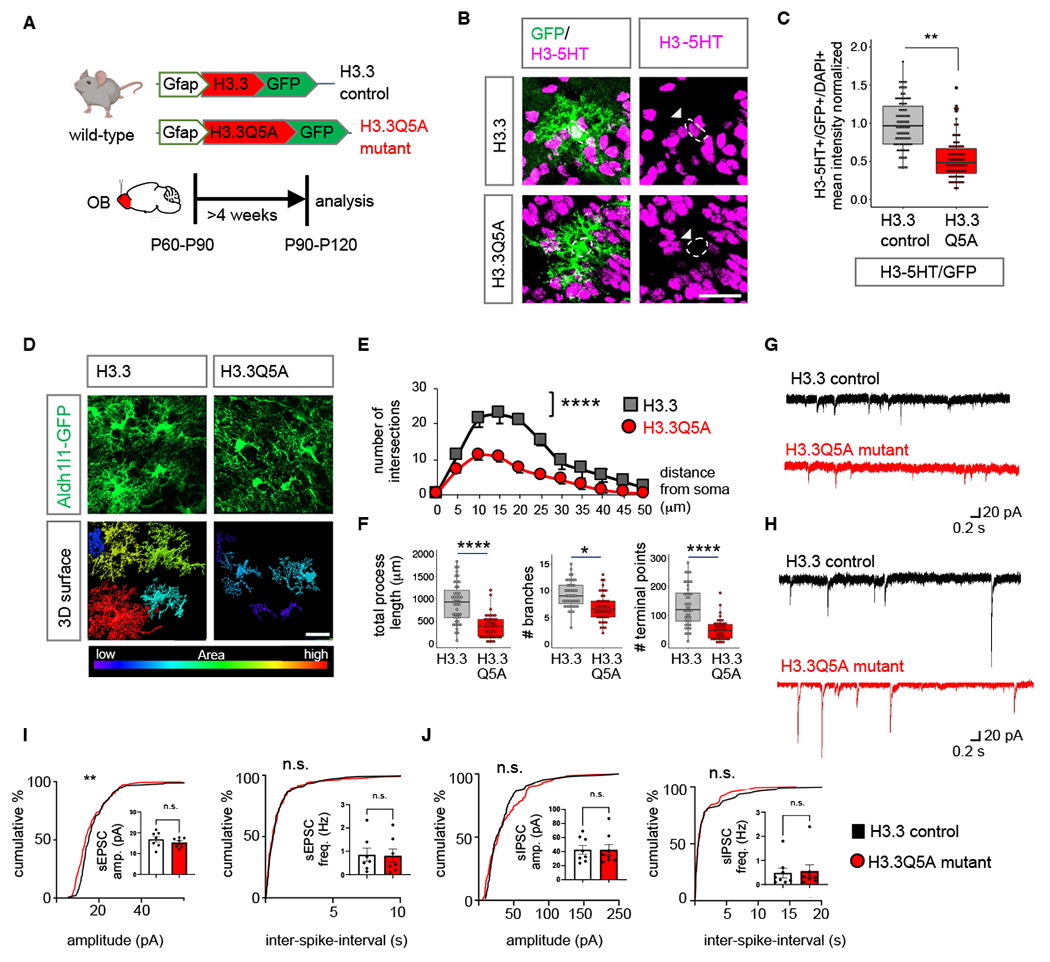
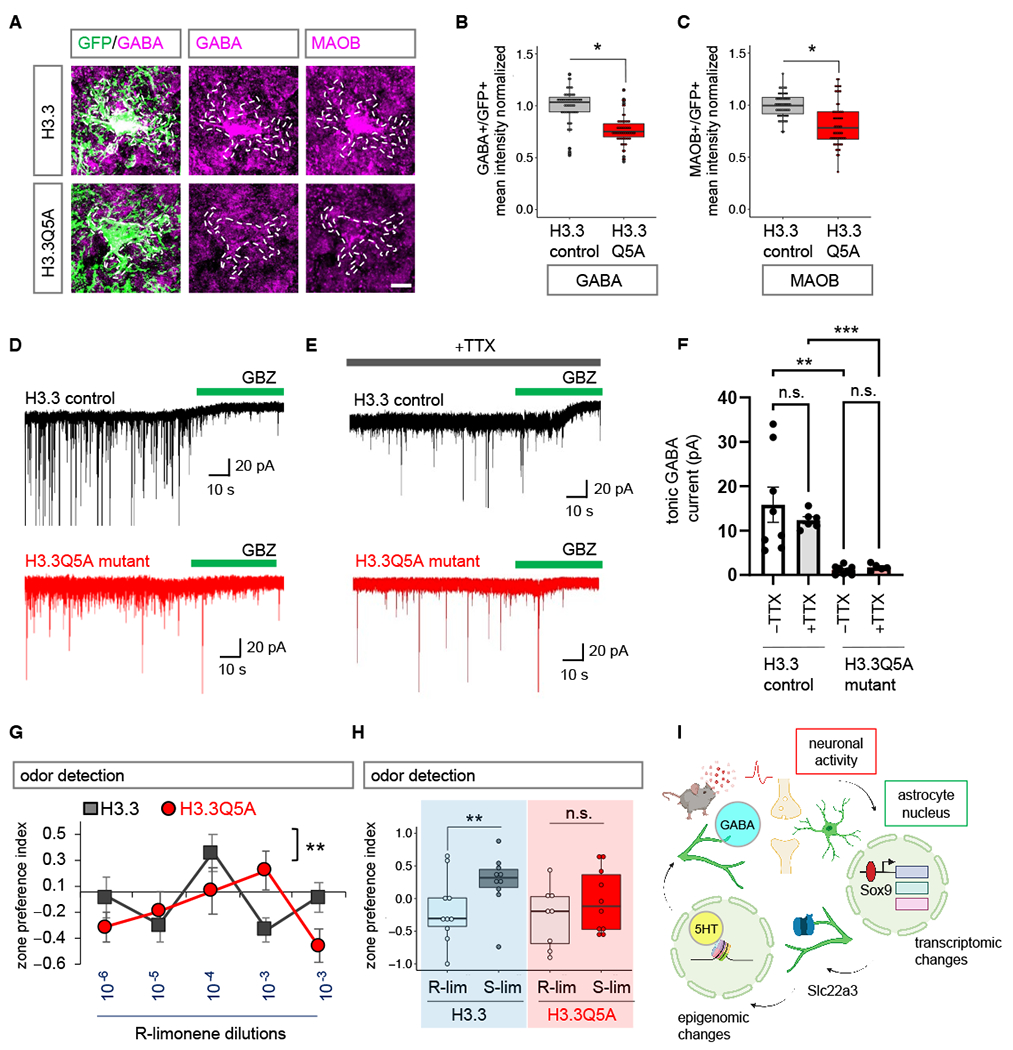
Neuronal activity drives alterations in gene expression within neurons, yet how it directs transcriptional and epigenomic changes in neighboring astrocytes in functioning circuits is unknown. We found that neuronal activity induces widespread transcriptional up-regulation and down-regulation in astrocytes, highlighted by the identification of Slc22a3 as an activity-inducible astrocyte gene that encodes neuromodulator transporter Slc22a3 and regulates sensory processing in the mouse olfactory bulb. Loss of astrocytic Slc22a3 reduced serotonin levels in astrocytes, leading to alterations in histone serotonylation. Inhibition of histone serotonylation in astrocytes reduced the expression of γ-aminobutyric acid (GABA) biosynthetic genes and GABA release, culminating in olfactory deficits. Our study reveals that neuronal activity orchestrates transcriptional and epigenomic responses in astrocytes while illustrating new mechanisms for how astrocytes process neuromodulatory input to gate neurotransmitter release for sensory processing.


Conflict of interest statement

Competing interests: The authors declare no competing interests.

Figures

Fig. 1.
Fig. 1.. Neuronal activity directs Sox9-regulated transcriptional responses in astrocytes
(A-C) Schematic illustrating chemogenetic neuronal activation experimental design. (D) Sections showing distinct labeling of astrocytes (GFP) and Gq-DREADD neurons (mCh) in CX, cortex; HP, hippocampus; OB, olfactory bulb. Scale bar: 25 µm. (E) Volcano plots depicting RNA-Seq from GFP astrocytes comparing Gq-CNO vs. Gq-Saline. (F) Number of DEGs that are upregulated or downregulated in GFP astrocytes in Gq-CNO vs. Gq-Saline (n= 3/cohort, p< 0.05, log2fold-change 1). (G) Significant transcription factor (TF) motifs (p< 0.05) enriched in these DEGs and exhibiting astrocyte-specific expression. (H) Average transcript expression of Sox family TF’s in GFP astrocytes (CPM: counts per million). (I) Comparison showing heatmaps of ChIP-Sox9 and ChIP-Sox2 at 4 kb from peak center in Gq-CNO vs. mCh-CNO control (n= 3/cohort). (J) Schematic for odor evoked neuronal activation in the OB. Left panel: heatmaps of ChIP-Sox9 at 4 kb from peak center in mineral oil vs. odor exposed mice. Right panel: enriched gene ontology terms associated with these peaks (n= 6/cohort). (K) Sox9 binding partners in OB’s from Gq-CNO vs. Gq-Saline. (L) Volcano plot depicting IP-MS (IP-Mass Spectrometry) data of Sox9 interactome in Gq-CNO. Fold change was calculated over control lysates incubated with beads only without antibody. Sox9 binding partners unique to Gq-CNO vs. Gq-Saline are highlighted in red (n= 9–12/cohort, p< 0.05, log2fold-change >1). (M) Top 5 Sox9 interactors unique to Gq-CNO (p< 0.0001, log2fold-change >8.5). Color code represent p-values (x-axis), and size represent log2fold-change with larger circles denoting greater binding affinity.
Fig. 2.
Fig. 2.. Neuronal activation induces Slc22a3 in OB astrocytes
(A-B) Heatmap depicting the 34 neuronal activity-dependent and Sox9 regulated DEGs (n= 3, p< 0.05), and the top 10 candidates filtered by Sox9 motif binding score 1000 bp from transcription start site of candidates. (C-D) ChIP-PCR screen identifying activity-dependent Sox9 regulation at Slc22a3 promoter (n= 4-6 OB). (E-H) Slc22a3 expression in control vs. Sox9-cKO OB astrocytes and in Gq-Saline vs. Gq-CNO; and box plots depicting area covered by Slc22a3 in GFP astrocytes (average of 116-122 cells/cohort, ****p= 1.93E-08; ***p= 0.00013, unpaired Student’s two-tailed t-test on n= 4 mice/cohort); Scale bar: 20 µm. (I) Schematic illustrating odor-evoked neuronal activation experimental design. (J) Immunoblots of Fos and loading control from OB lysates (n= 4/cohort). (K-O) Immunostaining of Fos in Aldh1l1-GFP mice and quantification of mean fluorescence intensity in NeuN+ neurons (244-250 cells/cohort, *p= 0.0285, Wilcoxon rank sum test on n= 4 mice/cohort). (P-T) Immunostaining of Slc22a3 in Aldh1l1-GFP mice and quantification of mean fluorescence intensity in GFP+ astrocytes (130-131 cells/cohort, ***p= 0.00039, unpaired Student’s two-tailed t-test on n= 4 mice/cohort). Scale bar: 50 µm; inset: 10 µm. Dashed line represents boundary of granule cell layer. See Table S3 for data summary.
Fig. 3.
Fig. 3.. Astrocytic Slc22a3 regulates olfactory circuit function
(A) Schematic illustrating viral vectors used for Slc22a3 conditional deletion from OB astrocytes. (B-E) Immunostaining and quantification of Slc22a3 in GFP+ astrocytes (average of 83-93 cells/cohort, ****p= 9.59E-05, unpaired Student’s two-tailed t-test on n= 4 mice/cohort); and in NeuN+ neurons (average of 350-363 cells/cohort, p= 0.5828, unpaired Student’s two-tailed t-test on n= 4 mice/cohort). Scale bar: 50 µm, inset: 10 µm. (F) Schematic illustrating live mouse tracking in three-chamber assay for odor detection. Top represent a control mouse exploring R-limonene (R-lim) at dilution of 10−4, while bottom represent Slc22a3-cKO mouse showing no preference for same R-lim concentration. (G) Quantification of odor detection in control and Slc22a3-cKO mice (n= 10/cohort, *p= 0.0211; two-way repeated measures ANOVA with Sidak multiple comparison). (H) Quantification of odor discrimination between R-lim and S-limonene (S-lim) from the same cohorts of mice (n= 10/cohort, **p= 0.0052; two-way repeated measures ANOVA with Sidak multiple comparisons). (I-J) Whole-cell patch clamp electrophysiology of granule cells firing number from stepped current injections (n= 3, 10 cells/cohort, p= 0.0578, two-way ANOVA with Sidak’s multiple comparison correction). (K-L) Traces and summary data of amplitude and frequency from sEPSC recordings (7-9 cells/cohort, sEPSC amplitude p= 0.7546; sEPSC frequency *p= 0.0473, unpaired Student’s two-tailed t-test on n= 3 mice/cohort; ****p< 0.0001); Kolmogorov-Smirnov (K-S) test. (M-N) Traces and quantification of amplitude and frequency from sIPSC recordings (8-10 cells/cohort, sIPSC amplitude *p= 0.0164, sIPSC frequency p= 0.8095, unpaired Student’s two-tailed t-test on n= 3 mice/cohort ****p< 0.0001 K-S test). All recordings in (L, N) are in granule cells and data is presented as mean ± SEM. See Table S3 for data summary.
Fig. 4.
Fig. 4.. Astrocytic Slc22a3 regulates astrocyte morphology and calcium activity
(A) Schematic illustrating viral vectors and timelines for RNA-Seq experiment. (B) Volcano plots depicting RNA-Seq from FACS sorted astrocytes comparing Slc22a3-cKO vs. control samples. (C-D) Gene Ontology circle plot and table, showing the top GO terms found in DEGs shown in (B). (E) Top morphology and calcium associated genes (p< 0.01) in downregulated DEGs in the Slc22a3-cKO OB astrocytes. (F) Schematic illustrating viral vectors and timelines for evaluation of astrocyte morphology. (G) High-magnification confocal images of Aldh1l1-GFP from control and Slc22a3-cKO mice and 3D surface rendering of the same showing reduced astrocyte morphological complexity in Slc22a3-cKO OB astrocytes. Scale bar: 20 µm. (H) Sholl analysis of astrocyte complexity (n= 4, average of 34-54 cells/cohort, *p= 0.0117; two-way repeated measures ANOVA with Sidak correction). Data presented as mean ± SEM. (I) Quantification of total process length (*p= 0.0285, Wilcoxon rank sum test), branch number (*p= 0.0198, unpaired Student’s two-tailed t-test), and terminal points (*p= 0.0177, unpaired Student’s two-tailed t-test) in control and Slc22a3-cKO OB astrocytes (34-54 cells/cohort, statistics on n= 4 mice/cohort). (J) Schematic illustrating mice, viral vectors, and timelines for expression of optical calcium sensor in OB astrocytes. (K-L) Traces from two photon, slice imaging of GCaMP6 activity from OB astrocyte soma in control and Slc22a3-cKO in the presence of TTX (0.5 µM) and serotonin (5HT, 50 µM). Scale bar: 10 µm. (M-N) Quantification of amplitude and frequency from 5HT induced calcium activity from astrocyte soma (19-20 cells/cohort, control amplitude *p= 0.0346; Slc22a3-cKO amplitude p= 0.6992; control frequency **p= 0.0029; Slc22a3-cKO frequency p= 0.5588; paired Student’s two-tailed t-test on n= 4 mice/cohort). See Table S3 for data summary.
Fig. 5.
Fig. 5.. Slc22a3 regulates histone serotonylation in OB astrocytes
(A) Immunostaining of H3-5HT in OBs of Aldh1l1-GFP mouse and quantification of GFP+/H3-5HT+ co-labeling (n= 3, 25-45 cells). (B) Schematic illustrating viral vectors and timelines for H3-5HT quantification and ChIP-Seq. (C-D) H3-5HT immunostaining and quantification in control and Slc22a3-cKO OB astrocytes (74-79 cells/cohort, *p= 0.0377; unpaired Student’s two-tailed t-test on n= 4 mice/cohort). Scale bar: 5 µm. (E) Venn diagram depicting number of H3-5HT ChIP-Seq peaks unique and shared between control and Slc22a3-cKO OB’s (n=4 OBs/cohort). (F) Venn diagram depicting number of genes that both lose H3-5HT peaks and are downregulated in Slc22a3-cKO. (G) Heatmaps comparing ChIP H3-5HT at 4 kb from peak center in control vs Slc22a3-cKO OB’s. (H) GO analysis of genes at H3-5HT peaks revealing loss of H3-5HT regulation at GABA-associated pathways in Slc22a3-cKO, and (I) of the 538 overlapping genes shown in Figure 5F. See Table S3 for data summary.
Fig. 6.
Fig. 6.. Slc22a3 regulates tonic GABA release from OB astrocytes
(A-H) Immunostaining and quantification of GABA and MAOB in control vs. Slc22a3-cKO (A-D) GFP+ astrocytes (73-88 cells/cohort; GABA **p= 0.0032, MAOB *p= 0.0121) and (E-H) NeuN+ neurons in the OB (144 cells/cohort; GABA p= 0.2119, MAOB p= 0.9355); unpaired Student’s two-tailed t-test on n= 4 mice/cohort. Scale bar: 10 µm. (I) Schematic illustrating viral vectors and timelines for tonic GABA current measurement experiments. (J-K) Traces of tonic GABA currents in granule cells in OBs from control and Slc22a3-cKO treated with gabazine (GBZ, 20 μM), with or without TTX (0.5 μM). (L) Quantification of tonic GABA current (7-10 cells/cohort, −TTX *p= 0.0331, +TTX **p= 0.0056) (M-N) Traces and quantification of measurement of tonic GABA current in presence of GABA (7-8 cells/cohort, p= 0.8483); unpaired Student’s two-tailed t-test on n= 3 mice/cohort. Data presented as mean ± SEM. See Table S3 for data summary.
Fig. 7.
Fig. 7.. Inhibition of H3-5HT in OB astrocytes disrupts astrocyte morphology
(A) Schematic illustrating viral vectors used for H3.3 and H3.3Q5A expression in OB astrocytes. (B) H3-5HT and GFP co-labeling in H3.3 and H3.3Q5A expressing OBs and (C) box plots depicting quantification of astrocytic H3-5HT (99-110 cells/cohort, **p= 0.0092; unpaired Student’s two-tailed t-test on n= 4 mice/cohort). Scale bar: 25 µm. (D) High-magnification confocal images of H3.3-GFP and 3D surface rendering of the same showing reduced astrocyte morphological complexity in H3.3Q5A OB astrocytes. Scale bar: 20 µm. (E) Sholl analysis of astrocyte complexity (n= 4, average of 44 cells/cohort, ****p= 1.9e-05; two-way repeated measures ANOVA with Sidak correction). Data presented as mean ± SEM. (F) Quantification of total process length, branch number, and terminal points (44 cells/cohort, ****p= 2.75e-05, *p= 0.0122, ****p= 8.73e-06, unpaired Student’s two-tailed t-test on n= 4 mice/cohort). (G-H) Traces and (I-J) summary data of amplitude and frequency from (I) sEPSC recordings (7 cells/cohort, sEPSC amplitude p= 0.2386; sEPSC frequency p= 0.7917; unpaired two-tailed Student’s t-test on n= 3 mice/cohort, **p= 0.0059 K-S test); and from (J) sIPSC recordings (8 cells/cohort, sIPSC amplitude p= 0.8277, sIPSC frequency p= 0.7128, unpaired two-tailed Student’s t-test on n= 3 mice/cohort. All recordings are in granule cells from H3.3 and H3.3Q5A OB’s and data is presented as mean ± SEM. See Table S3 for data summary.
Fig. 8.
Fig. 8.. Inhibition of H3-5HT disrupts astrocytic tonic GABA release and sensory processing
(A-C) Immunostaining and box plots depicting quantification of astrocytic GABA and MAOB in H3.3 and H3.3Q5A OBs (56-58 cells/cohort, GABA: *p= 0.0117, unpaired two-tailed Student’s t-test on n= 4 mice/cohort; MAOB *p= 0.0285, Wilcoxon rank sum test on n= 4 mice/cohort). Scale bar: 10 µm. (D-E) Traces of tonic GABA currents in granule cells in OBs from H3.3 and H3.3Q5A treated with gabazine (GBZ, 20 μM), with or without TTX (0.5 μM). (F) Quantification of tonic GABA currents (5-8 cells/cohort, –TTX **p= 0.0017, +TTX ***p= 0.0007; unpaired two-tailed Student’s t-test on n= 3 mice/cohort). Data presented as mean ± SEM. (G) Quantification of odor detection in H3.3 and H3.3Q5A mice (n=10/cohort, **p= 0.0072; two-way repeated measures ANOVA with Sidak multiple comparison). (H) Quantification of odor discrimination between R-lim and S-lim from the same cohorts of mice (n=10/cohort, **p= 0.0058; two-way repeated measures ANOVA with Sidak multiple comparisons). See Table S3 for data summary. (I) Model figure integrating activity dependent transcriptional changes in astrocytes, with Slc22a3 function in olfactory circuits, and histone serotonylation regulation of GABA in astrocytes.

Update of

References

    1. Cheng YT, Woo J, Deneen B, Neuroscientist, 1–16 (2022). - PMC - PubMed
    1. Kofuji P, Araque A, Annu. Rev. Neurosci. 44, 49–67 (2021). - PMC - PubMed
    1. Khakh B, Deneen B, Annu. Rev. Neurosci. 42, 187–207 (2019). - PubMed
    1. Dallérac G, Zapata J, Rouach N, Nat. Rev. Neurosci. 19, 729–743 (2018). - PubMed
    1. Bazargani N, Attwell D, Nat. Neurosci. 19, 182–189 (2016). - PubMed

MeSH terms

Substances