

T-BACCO SCORE: A predictive scoring tool for tuberculosis (TB) loss to follow-up among TB smokers
- PMID: 37319310
- PMCID: PMC10270618
- DOI: 10.1371/journal.pone.0287374
T-BACCO SCORE: A predictive scoring tool for tuberculosis (TB) loss to follow-up among TB smokers
Abstract
Introduction: Loss to follow-up (LTFU) and smoking during TB treatment are major challenges for TB control programs. Smoking increases the severity and prolongs TB treatment duration, which lead to a higher rate of LTFU. We aim to develop a prognostic scoring tool to predict LTFU among TB patients who smoke to improve successful TB treatment outcomes.
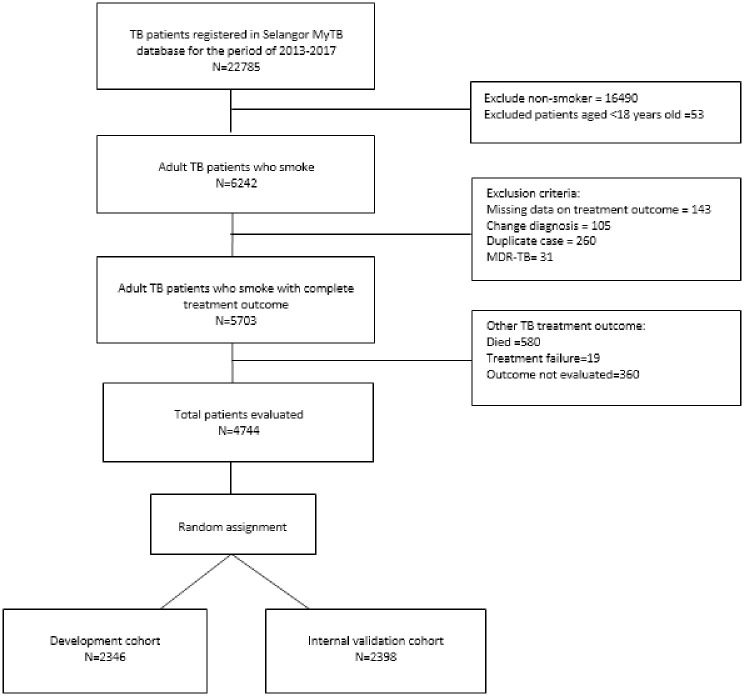
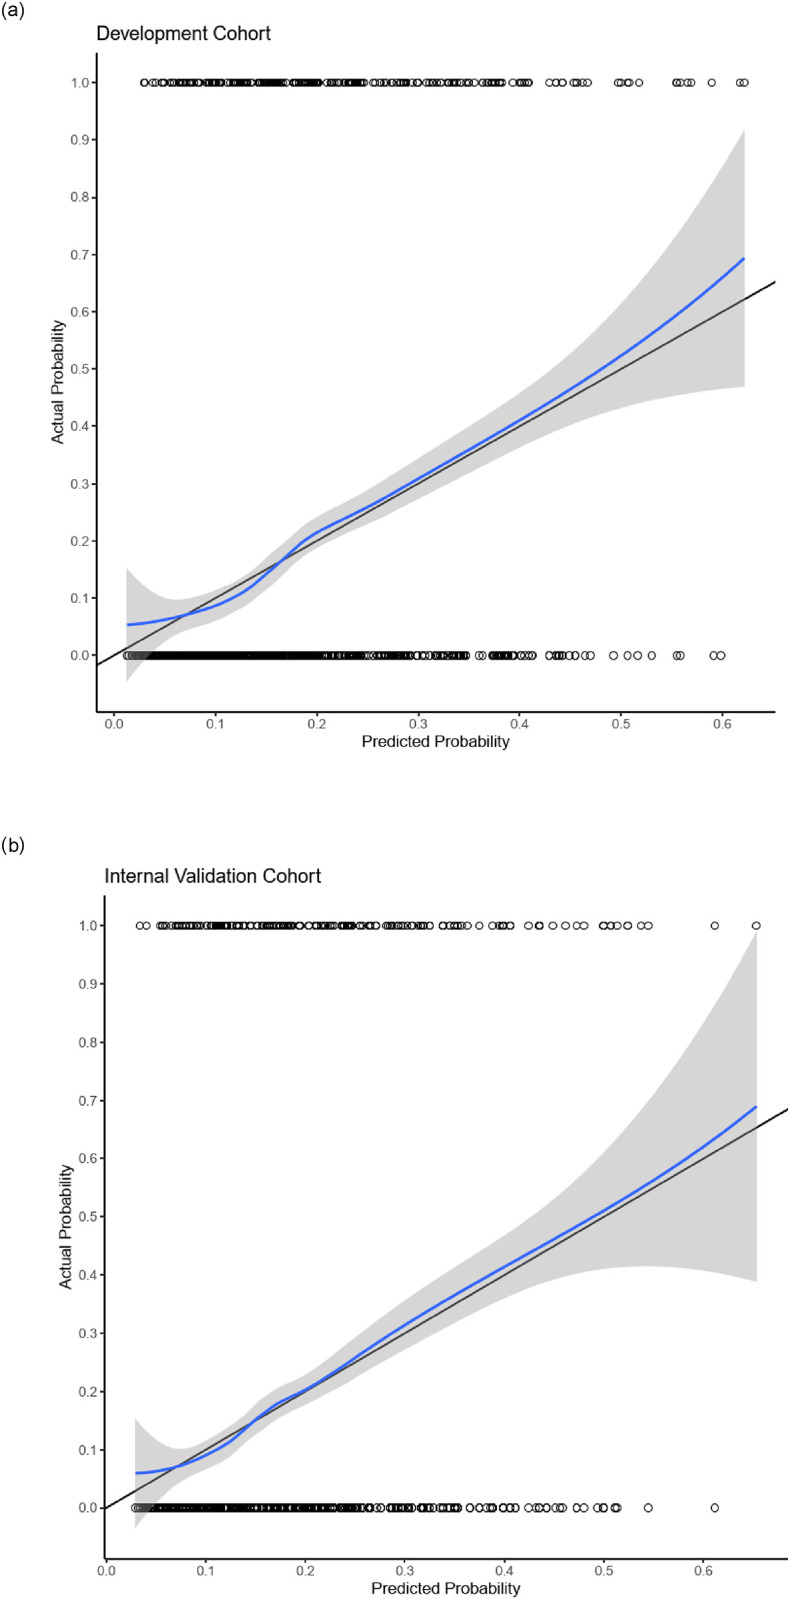
Materials and methods: The development of the prognostic model utilized prospectively collected longitudinal data of adult TB patients who smoked in the state of Selangor between 2013 until 2017, which were obtained from the Malaysian Tuberculosis Information System (MyTB) database. Data were randomly split into development and internal validation cohorts. A simple prognostic score (T-BACCO SCORE) was constructed based on the regression coefficients of predictors in the final logistic model of the development cohort. Estimated missing data was 2.8% from the development cohort and was completely at random. Model discrimination was determined using c-statistics (AUCs), and calibration was based on the Hosmer and Lemeshow goodness of fit test and calibration plot.
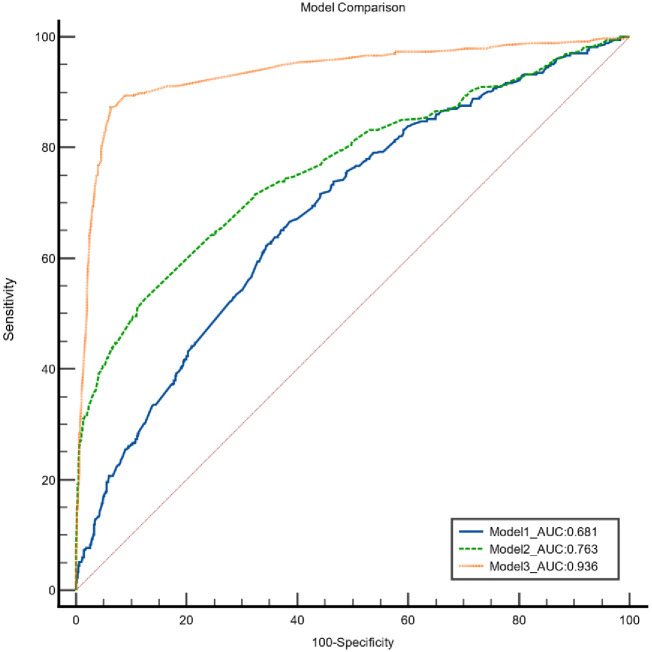
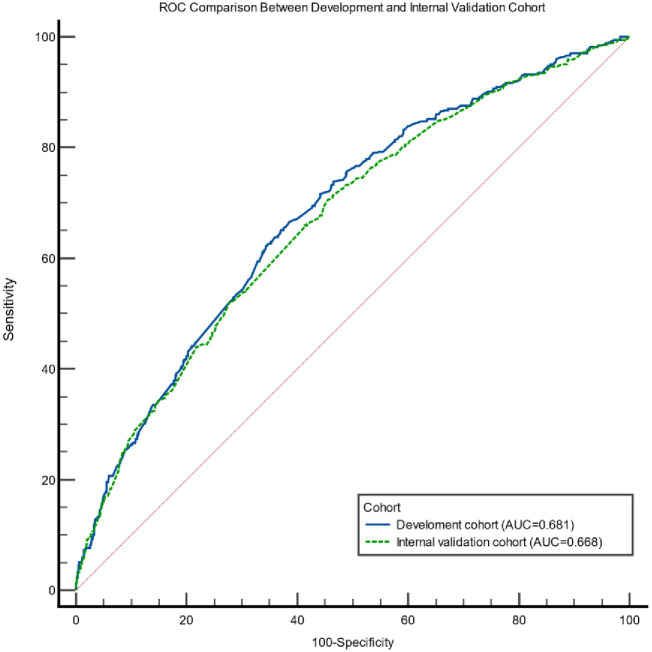
Results: The model highlights several variables with different T-BACCO SCORE values as predictors for LTFU among TB patients who smoke (e.g., age group, ethnicity, locality, nationality, educational level, monthly income level, employment status, TB case category, TB detection methods, X-ray categories, HIV status, and sputum status). The prognostic scores were categorized into three groups that predict the risk for LTFU: low-risk (<15 points), medium-risk (15 to 25 points) and high-risk (> 25 points). The model exhibited fair discrimination with a c-statistic of 0.681 (95% CI 0.627-0.710) and good calibration with a nonsignificant chi-square Hosmer‒Lemeshow's goodness of fit test χ2 = 4.893 and accompanying p value of 0.769.
Conclusion: Predicting LTFU among TB patients who smoke in the early phase of TB treatment is achievable using this simple T-BACCO SCORE. The applicability of the tool in clinical settings helps health care professionals manage TB smokers based on their risk scores. Further external validation should be carried out prior to use.
Copyright: © 2023 Sharani et al. This is an open access article distributed under the terms of the Creative Commons Attribution License, which permits unrestricted use, distribution, and reproduction in any medium, provided the original author and source are credited.
Conflict of interest statement
The authors have declared that no competing interests exist.
Figures
Similar articles
-
Characteristics and determinants of loss to follow-up among tuberculosis (TB) patients who smoke in an industrial state of Malaysia: a registry-based study of the years 2013-2017.BMC Public Health. 2022 Apr 1;22(1):638. doi: 10.1186/s12889-022-13020-3. BMC Public Health. 2022. PMID: 35365112 Free PMC article.
-
Prognostic score to predict mortality during TB treatment in TB/HIV co-infected patients.PLoS One. 2018 Apr 16;13(4):e0196022. doi: 10.1371/journal.pone.0196022. eCollection 2018. PLoS One. 2018. PMID: 29659636 Free PMC article.
-
Development and validation of a prognostic score to predict tuberculosis mortality.J Infect. 2018 Oct;77(4):283-290. doi: 10.1016/j.jinf.2018.02.009. Epub 2018 Apr 9. J Infect. 2018. PMID: 29649520
-
Incidence and predictors of LTFU among adults with TB/HIV co-infection in two governmental hospitals, Mekelle, Ethiopia, 2009-2016: survival model approach.BMC Infect Dis. 2019 Feb 4;19(1):107. doi: 10.1186/s12879-019-3756-2. BMC Infect Dis. 2019. PMID: 30717705 Free PMC article.
-
Machine learning algorithms using national registry data to predict loss to follow-up during tuberculosis treatment.BMC Public Health. 2024 May 23;24(1):1385. doi: 10.1186/s12889-024-18815-0. BMC Public Health. 2024. PMID: 38783264 Free PMC article.
References
-
- WHO. Global tuberculosis report. Geneva: World Health Organization, 2019.
MeSH terms
LinkOut - more resources
Full Text Sources
Medical
