. 2023 Sep 7;142(10):903-917.
doi: 10.1182/blood.2022019537.

The non-cell-autonomous function of ID1 promotes AML progression via ANGPTL7 from the microenvironment

Affiliations

The non-cell-autonomous function of ID1 promotes AML progression via ANGPTL7 from the microenvironment

Ming-Yue Fei et al. Blood. .

Abstract

The bone marrow microenvironment (BMM) can regulate leukemia stem cells (LSCs) via secreted factors. Increasing evidence suggests that dissecting the mechanisms by which the BMM maintains LSCs may lead to the development of effective therapies for the eradication of leukemia. Inhibitor of DNA binding 1 (ID1), a key transcriptional regulator in LSCs, previously identified by us, controls cytokine production in the BMM, but the role of ID1 in acute myeloid leukemia (AML) BMM remains obscure. Here, we report that ID1 is highly expressed in the BMM of patients with AML, especially in BM mesenchymal stem cells, and that the high expression of ID1 in the AML BMM is induced by BMP6, secreted from AML cells. Knocking out ID1 in mesenchymal cells significantly suppresses the proliferation of cocultured AML cells. Loss of Id1 in the BMM results in impaired AML progression in AML mouse models. Mechanistically, we found that Id1 deficiency significantly reduces SP1 protein levels in mesenchymal cells cocultured with AML cells. Using ID1-interactome analysis, we found that ID1 interacts with RNF4, an E3 ubiquitin ligase, and causes a decrease in SP1 ubiquitination. Disrupting the ID1-RNF4 interaction via truncation in mesenchymal cells significantly reduces SP1 protein levels and delays AML cell proliferation. We identify that the target of Sp1, Angptl7, is the primary differentially expression protein factor in Id1-deficient BM supernatant fluid to regulate AML progression in mice. Our study highlights the critical role of ID1 in the AML BMM and aids the development of therapeutic strategies for AML.


Conflict of interest statement

Conflict-of-interest disclosure: The authors declare no competing financial interests.

Figures

None
Graphical abstract
Figure 1.
Figure 1.
ID1 is highly expressed in AML-MSCs and, in particular, in AML1-ETO and MLL-AF9 subtypes. (A-B) The qPCR and western blot analysis of Id1 expression in HSCs, total BM, MSCs, osteoblasts (OBs), fibroblasts (FBs), and endothelial cells (ECs) from healthy mice (n = 10). (C-E) The qPCR and western blot analysis of ID1 expression in human-derived HD-MSCs (n ≥ 10) and AML-MSCs (n = 17). (F-H) The qPCR and western blot analysis of ID1 expression in HS-5 cells cocultured with CD34+ HSPCs and different AML cell lines for 4 days. (I) ELISAs for the detection of BMP6 in the conditioned medium (CM) in the coculture system. (J-K) The qPCR analysis of ID1 expression in MSCs derived from patients with AML subtype M2 or M5 supplemented with recombinant BMP6. (L) The qPCR was used to analyze the efficiency of BMP6 knockdown in Kasumi-1 cells compared with that in control groups. (M) The western blot analysis of ID1 expression in HS-5 cells cocultured with BMP6 knockdown or overexpressing Kasumi-1 cells. (N) The qPCR was used to analyze the efficiency of BMP6 knockdown in THP-1 cells compared with that in control groups. (O) The western blot analysis of ID1 expression in HS-5 cells cocultured with BMP6 knockdown or overexpressing THP-1 cells. (P-S) The qPCR and western blot analysis of Id1 expression in total BM, MSCs, OBs, FBs, and ECs from recipient mice that underwent secondary transplantation with AE9a-expressing fetal liver cells or MLL-AF9–expressing BM cells (n = 7). ∗P < .05; ∗∗P < .01; ∗∗∗P < .005; ∗∗∗∗P < .001. KD, knockdown.
Figure 1.
Figure 1.
ID1 is highly expressed in AML-MSCs and, in particular, in AML1-ETO and MLL-AF9 subtypes. (A-B) The qPCR and western blot analysis of Id1 expression in HSCs, total BM, MSCs, osteoblasts (OBs), fibroblasts (FBs), and endothelial cells (ECs) from healthy mice (n = 10). (C-E) The qPCR and western blot analysis of ID1 expression in human-derived HD-MSCs (n ≥ 10) and AML-MSCs (n = 17). (F-H) The qPCR and western blot analysis of ID1 expression in HS-5 cells cocultured with CD34+ HSPCs and different AML cell lines for 4 days. (I) ELISAs for the detection of BMP6 in the conditioned medium (CM) in the coculture system. (J-K) The qPCR analysis of ID1 expression in MSCs derived from patients with AML subtype M2 or M5 supplemented with recombinant BMP6. (L) The qPCR was used to analyze the efficiency of BMP6 knockdown in Kasumi-1 cells compared with that in control groups. (M) The western blot analysis of ID1 expression in HS-5 cells cocultured with BMP6 knockdown or overexpressing Kasumi-1 cells. (N) The qPCR was used to analyze the efficiency of BMP6 knockdown in THP-1 cells compared with that in control groups. (O) The western blot analysis of ID1 expression in HS-5 cells cocultured with BMP6 knockdown or overexpressing THP-1 cells. (P-S) The qPCR and western blot analysis of Id1 expression in total BM, MSCs, OBs, FBs, and ECs from recipient mice that underwent secondary transplantation with AE9a-expressing fetal liver cells or MLL-AF9–expressing BM cells (n = 7). ∗P < .05; ∗∗P < .01; ∗∗∗P < .005; ∗∗∗∗P < .001. KD, knockdown.
Figure 2.
Figure 2.
ID1 knockout in BMSCs suppresses AML cell proliferation in vitro and in vivo. (A)The western blot analysis of ID1 expression in HS-5 cells with ID1 knockout and in control cells. (B-F) MTT assays show that ID1 knockout in HS-5 cells significantly inhibits the proliferation of cocultured Kasumi-1, SKNO-1, THP-1, and MOLM-13 cells (n = 3). (G-K) Cell cycle analysis on Kasumi-1, SKNO-1, THP-1, and MOLM-13 cells cocultured with ID1+/+ or ID1−/− HS-5 cells for 4 days (n = 3). (L) The strategy of AE9a- and MLL-AF9–expressing cell line transplantation. (M) Id1−/− recipients showed a significantly longer survival time than Id1+/+ recipients after undergoing transplantation with AE9a (n = 9; median survival, 24 vs 38 days) or MLL-AF9 cell line (n = 10; median survival, 25.5 vs 33.5 days). (N) The in vivo bioluminescence imaging and quantification analysis shows that the Id1−/− BMM impairs leukemia progression in recipients that received transplantation with AE9a or MLL-AF9 cell lines that are luciferase positive (n ≥ 4). ∗P < .05; ∗∗P < .01; ∗∗∗P < .005; ∗∗∗∗P < .001. Ctrl, control; GAPDH, glyceraldehyde-3-phosphate dehydrogenase; PI, propidium iodide; sg, single guide.
Figure 3.
Figure 3.
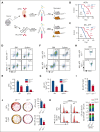
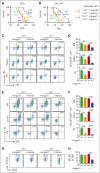
Id1 expression in the host BMM leads to AML acceleration. (A) The strategy of FLT or BMT. (B) Survival curves of Id1+/+ and Id1−/− recipients that underwent transplantation with AE9a-expressing fetal liver LSKs primarily (n ≥ 17; median survival, 101 vs 163 days). (C) Survival curves of Id1+/+ and Id1−/− recipients that underwent transplantation with MLL-AF9–expressing BM L-GMP cells primarily (n ≥ 19; median survival, 63 vs 77 days). (D-G) Representative flow cytometry profiles and quantification of the frequencies of the GFP+c-Kit+ leukemia blast cells in the BM and spleen of the indicated mice at 4 weeks after FLT or BMT (n = 10). (H-I) Representative flow cytometry profiles and quantification of the frequencies of the L-GMP cells in the BM of the indicated mice at 4 weeks after BMT (n = 10). (J) Colony-forming unit (CFU) assays analyzing the GFP+c-Kit+ leukemia blast cells sorted from FLT recipients BM or L-GMP cells sorted from BMT recipients BM. Average number of colonies generated from 1000 cells (n = 3). (K) Cell cycle analysis on AE9a-expressing LSKs and MLL-AF9–expressing L-GMP cells cocultured with Id1+/+ BMSCs or Id1−/− BMSCs for 5 days (n = 3). ∗P < .05; ∗∗P < .01; ∗∗∗P < .005; ∗∗∗∗P < .001.
Figure 4.
Figure 4.
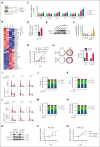
Id1 enhances Angptl7 release from BMSCs to promote AML progression. (A) The proteomics analysis strategy of BMSF from Id1+/+ and Id1−/− AML recipients. (B) The heat map analysis of differentially expression proteins in tandem mass tag–based proteomic analysis of BMSF from wild-type and Id1−/− AML mice. (C) The qPCR analysis of the differentially expressed proteins in BMSF proteomics. (D) The ELISA analysis of ANGPTL7 levels in the BM fluid derived from healthy individuals (n = 3) and patients with AML (M2, n = 2; M5, n = 2). (E) The western blotting analysis of ANGPTL7 levels in the MSCs derived from healthy individuals (n = 2) and patients with AML (M2, n = 2; M5, n = 2). (F) The ELISAs showed that ID1 knockout in HS-5 cells significantly decreases the ANGPTL7 protein level in CM. Overexpression of HA-ID1 in HS-5 cells significantly upregulates the level of ANGPTL7 in CM. (G) The MTT assays showed that ANGPTL7 recombinant protein significantly promotes the proliferation of Kasumi-1 and THP-1 cells. (H) CFU assays analyzing the AE9a LSKs or MLL-AF9 L-GMP cells. Average number of colonies generated from 800 cells (n = 3). (I-K) Cell cycle analysis on Kasumi-1 and THP-1 cells with vehicle or ANGPTL7 during coculture with ID1+/+ or ID1−/− HS-5 cells (n = 3). (L-N) Cell cycle analysis on AE9a-LSKs and MLL-AF9-L-GMP cells with vehicle or Angptl7 during coculture with Id1ctrl or Id1kd MS-5 cells (n = 3). (O) The western blot analysis of lentivirus-mediated ID1 silencing in patient-derived AML subtype M2 and M5 MSCs. Anti-ID1, anti-SP1, anti-ANGPTL7, and anti-GAPDH antibodies were used. (P-Q) The MTT proliferation analysis on patient-derived AML subtype M2 and M5 CD34+ leukemia blast cells with vehicle or ANGPTL7 treatment during coculture with matched ID1+/+ or ID1−/− MSCs. ∗P < .05; ∗∗P < .01; ∗∗∗P < .005; ∗∗∗∗P < .001. FC, fold change; WT, wild-type.
Figure 5.
Figure 5.
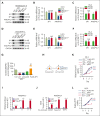
ID1-mediated SP1 protein levels are essential for Angptl7 transcription. (A-C) HS-5 cells were transduced with indicated sgRNAs and overexpression plasmids. Western blott and qPCR analyses were performed on these HS-5 cells after 4 days of coculture with Kasumi-1 cells. (D-F) HS-5 cells were transduced with indicated sgRNAs and overexpression plasmids. Western blot and qPCR analyses were performed on these HS-5 cells after 4 days of coculture with THP-1 cells. (G) The ELISAs showed that SP1 knockdown restricts ANGPTL7 expression and that ANGPTL7 was significantly upregulated by SP1 overexpression in HS-5 cells CM. (H) PROMO predicts the SP1 binding site on the ANGPTL7 promoter. (I) The dual-luciferase reporter assay showed that SP1 binds to site II to upregulate luciferase activity. (J) Chromatin immunoprecipitation assays showed that ANGPTL7 promoter DNA fragments were immunoprecipitated by SP1 antibodies in contrast to immunoglobulin G (IgG) in HS-5 cells cocultured with CD34+ HSPCs, Kasumi-1, or THP-1 cells. (K-L) The MTT assays showed that overexpression of SP1 in ID1−/− HS-5 cells significantly promote the proliferation of Kasumi-1 and THP-1 cells. ∗P < .05; ∗∗P < .01; ∗∗∗P < .005; ∗∗∗∗P < .001.
Figure 6.
Figure 6.
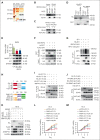
The interaction between ID1 and RNF4 suppresses SP1 ubiquitination. (A) The silver nitrate staining results of the immunoprecipitation HA-Id1 interactome. (B-C) Both HA and FLAG coimmunoassays showed significant interactions between HA-ID1 and RNF4-FLAG. (D) ID1 and RNF4 interact with each other in vitro. Both purified GST-RNF4 and GST-ID1 pull-down assays showed significant interactions with His-ID1 and His-RNF4. (E) The levels of SP1 protein, but not ID1, were significantly reduced in HS-5 cells transduced with shRNA against RNF4. (F) ID1 inhibits the RNF4-SP1 interaction in vitro. Purified GST-RNF4, HA-ID1, and FLAG-SP1 were used for GST pull-down assays, and anti-GST, anti-HA, and anti-FLAG antibodies were used for western blotting. (G) SP1, HA-ID1, RNF4-FLAG, and MYC-ubiquitin were cotransfected into 293T cells. Anti-SP1 immunoprecipitation assays have shown that HA-ID1 significantly inhibits SP1 ubiquitination via RNF4. (H) Schematic representation of the ID1 and RNF4 truncations. (I) The anti-FLAG immunoprecipitation assay showed a significant RNF4-FLAG interaction with the ID1 C-terminal. (J) Anti-HA immunoprecipitation assay showed significant interaction of HA-ID1 with the RNF4 SIM domain. (K) HS-5 cells with stable expression of truncated ID1 were transiently transfected with either RNF4 or empty vectors. Western blot analysis of SP1, HA, and FLAG-related proteins. (L-M) MTT assays showed significant inhibition of the proliferation in Kasumi-1 and THP-1 cells cocultured with HS-5 cells expressing RNF-FLAG and HA-ID1 C del. ∗P < .05; ∗∗P < .01; ∗∗∗P < .005; ∗∗∗∗P < .001.
Figure 7.
Figure 7.
Intra-BM transfusion of Angptl7 significantly accelerated AML progression in Id1-deficient recipient mice. (A-B) Id1−/− recipient mice without Angptl7 injection showed significantly longer survival time than other groups after FLT or BMT. (C-F) The frequency of GFP+c-Kit+ leukemia blast cells was decreased in the BM, spleen, and peripheral blood (PB) of Id1−/− recipients without Angptl7 injection after FLT and BMT (n = 8). (G-H) Id1−/− recipients without Angptl7 injection showed a decrease in the frequency of L-GMP cells in the BM after BMT (n = 8). ∗P < .05; ∗∗P < .01; ∗∗∗P < .005; and ∗∗∗∗P < .001.

References

    1. Juliusson G, Hagberg O, Lazarevic VL, et al. Improved survival of men 50 to 75 years old with acute myeloid leukemia over a 20-year period. Blood. 2019;134(18):1558–1561. - PMC - PubMed
    1. Whiteley AE, Price TT, Cantelli G, Sipkins DA. Leukaemia: a model metastatic disease. Nat Rev Cancer. 2021;21(7):461–475. - PMC - PubMed
    1. De Kouchkovsky I, Abdul-Hay M. Acute myeloid leukemia: a comprehensive review and 2016 update. Blood Cancer J. 2016;6(7):e441. - PMC - PubMed
    1. Li S, Garrett-Bakelman FE, Chung SS, et al. Distinct evolution and dynamics of epigenetic and genetic heterogeneity in acute myeloid leukemia. Nat Med. 2016;22(7):792–799. - PMC - PubMed
    1. Sachs K, Sarver AL, Noble-Orcutt KE, et al. Single-cell gene expression analyses reveal distinct self-renewing and proliferating subsets in the leukemia stem cell compartment in acute myeloid leukemia. Cancer Res. 2020;80(3):458–470. - PMC - PubMed

Publication types

MeSH terms