. 2023 Aug;102(8):102804.
doi: 10.1016/j.psj.2023.102804. Epub 2023 May 23.

Development of active jejunal glucose absorption in broiler chickens

Affiliations

Development of active jejunal glucose absorption in broiler chickens

Mikako Shibata et al. Poult Sci. 2023 Aug.

Abstract

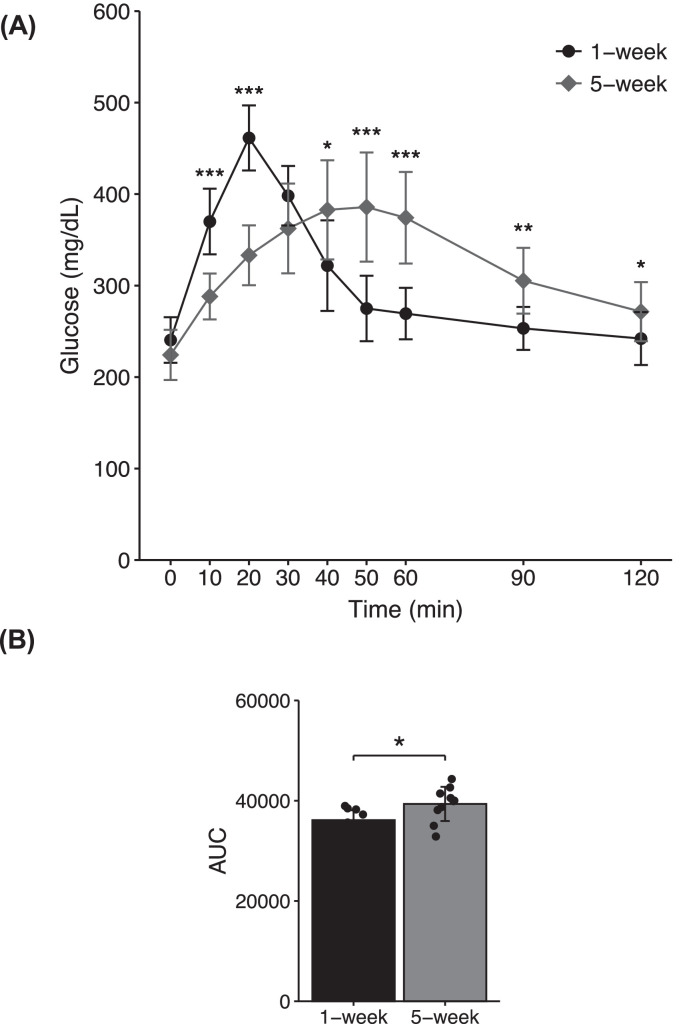
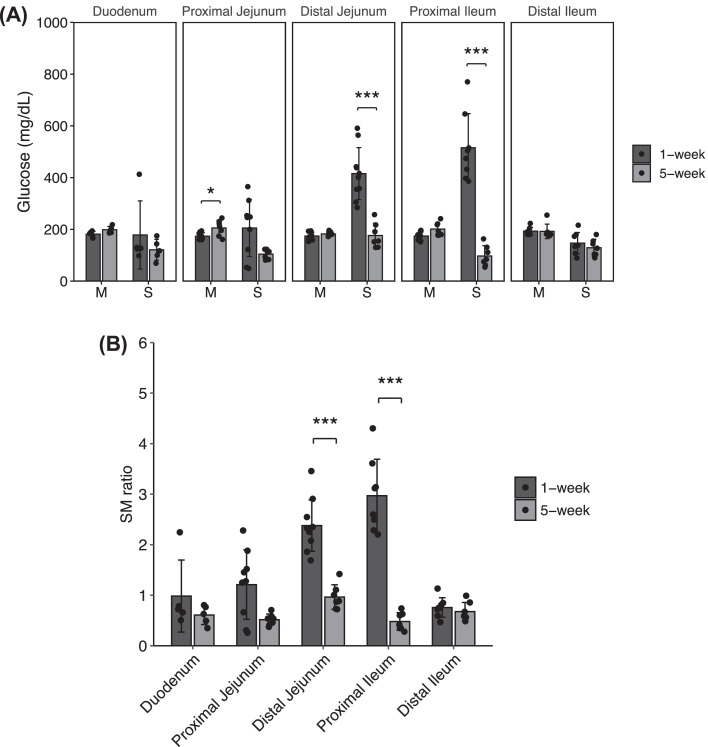
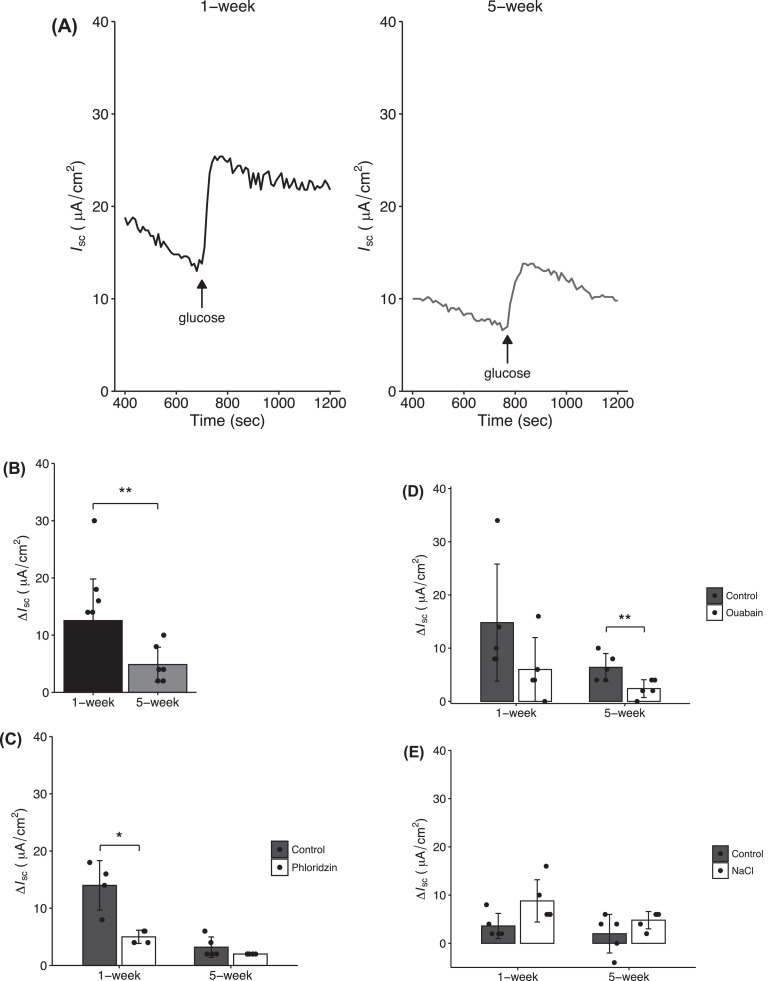
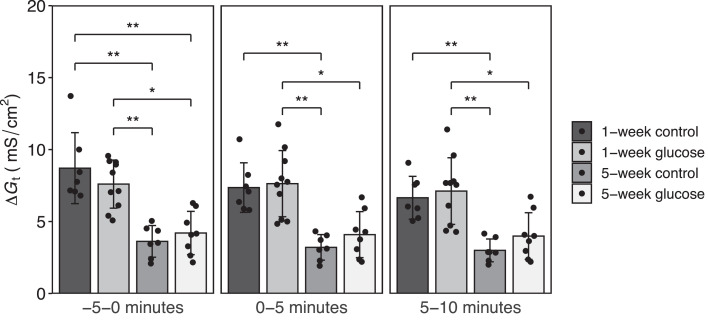
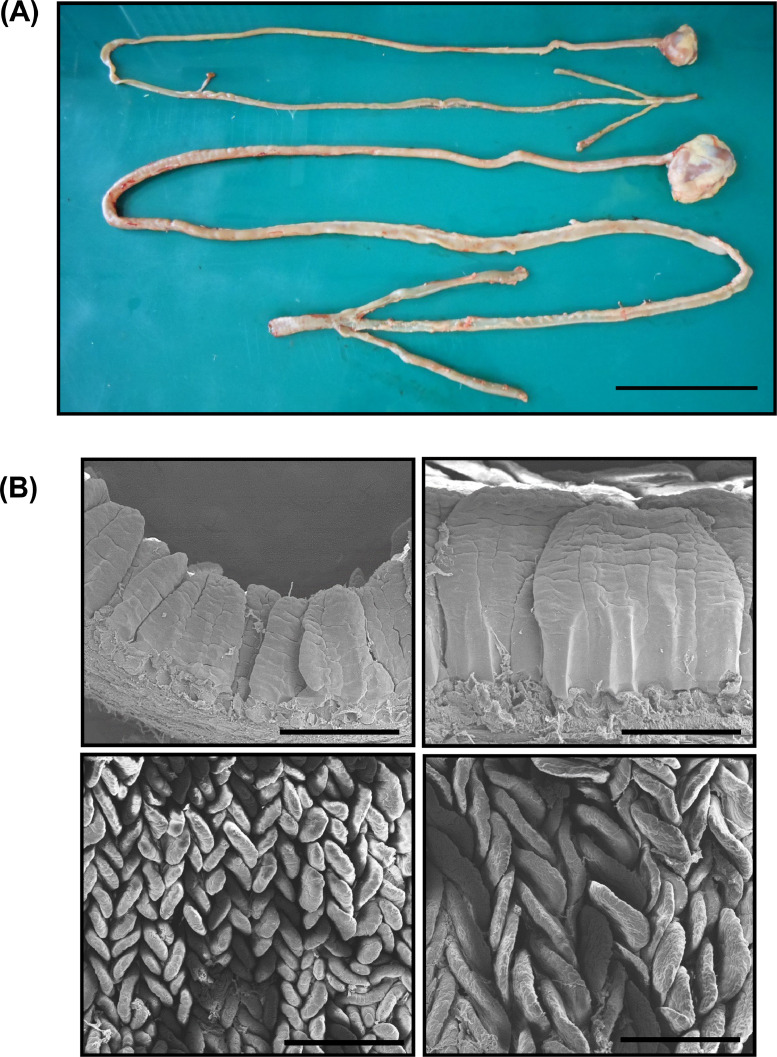
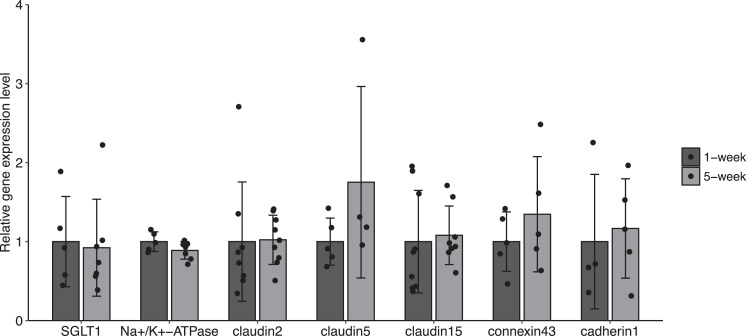
Growth in chickens, especially meat-type chickens (broilers), is extremely rapid, but studies on the regulatory mechanism of intestinal glucose absorption with growth are few, contradictory, and unclear. Here, we investigated the regulation of intestinal glucose absorption with growth in broiler chickens using oral glucose gavage, intestinal Evans blue transit, intestinal glucose absorption, scanning electron microscopy, and glucose absorption- and cell junction-related gene expression analyses. Peak blood glucose levels after oral glucose gavage occurred at 10 and 50 min in chickens at 1 wk (C1W) and 5 wk (C5W) of age, respectively. The area under the curve for glucose levels was greater for the C5W than the C1W (P = 0.035). The stain ratio in the small intestine in the C5W was lower than that in the C1W (P = 0.01), but there were no differences in the tissue regions stained with Evans blue and the migration distance of Evans blue from Meckel's diverticulum. In everted sac and Ussing chamber experiments, we observed reduced intestinal glucose uptake and electrogenic glucose absorption in the jejunum of the C5W. Phloridzin, an inhibitor of sodium/glucose cotransporter 1 (SGLT1), suppressed the glucose-induced short-circuit current in the C1W (P = 0.016) but not the C5W. Although the addition of NaCl solution stimulated the glucose-induced short-circuit current in the C1W, no differences between the treatments were observed (P = 0.056), which was also the case in the C5W. Additionally, tissue conductance was diminished in the C5W compared with that in the C1W. Moreover, in the C5W, the intestinal tract was more developed and the jejunal villi were enlarged. In conclusion, glucose absorption throughout the intestine could be greater in C5W than in C1W; however, reduced SGLT1 sensitivity, decreased ion permeability, and intestinal overdevelopment lead to decreased local glucose absorption in the jejunum with growth in broiler chickens. These data provide a detailed analysis of intestinal glucose absorption in growing broiler chickens, and can contribute to the development of novel feeds.

Keywords: age; broiler; jejunal glucose absorption; jejunal morphology; jejunal permeability.


Figures

Figure 1
Figure 1
Blood glucose dynamics during oral glucose challenge. (A) Male fasted chickens at 1 wk of age (n = 10) and 5 wk of age (n = 10) received glucose solution (2 g/kg BW) by oral administration. Blood glucose concentrations were obtained at the indicated times. (B) Total area under the curve (AUC) was calculated using the trapezoidal method. Data represent the means ± SD. Statistically differences were defined as *P < 0.05, **P < 0.01, and ***P < 0.001 using 2-sided Mann-Whitney U test.
Figure 2
Figure 2
Mucosa to serosal glucose transport across everted gut sacs. (A) Everted sacs from 1-wk old (n = 7) and 5-wk old (n = 5) chickens were incubated with Krebs Ringer buffer containing D-glucose (10 mM). Glucose concentrations from mucosal and serosal solution were determined after incubation. (B) To determine the mucosal to serosal glucose transport, the glucose concentration ratio (S/M) in the serosal (S) and mucosal (M) side was estimated. Data represent the means ± SD, and 2-sided Mann-Whitney U tests were used to compare the glucose concentration and S/M ratios. Statistically differences were assumed at *P < 0.05 and ***P < 0.001.
Figure 3
Figure 3
Short-circuit current (Isc) responses to glucose challenge. (A) Isc (μA/cm2) recorded from the distal jejunum in response to 10 mM glucose stimulation (mucosa) in 1-wk old (n = 6) and 5-wk old (n = 8) chickens. (B) Difference between basal and maximal Isc before and after glucose stimulation was calculated as the ΔIsc. (C) Glucose-induced Isc in the presence of 100 μM phlorizin as SGLT1 inhibitor in mucosal side of chicks 1 wk (n = 5) and 5 wk (n = 5) of age. (D) Glucose-induced Isc in the presence of 100 μM ouabain as Na+/K+-ATPase inhibitor on the serosal side of the 1-wk old group (n = 5) and 5-wk old group (n = 5). (E) Isc response to NMDG-Cl (control) or 100 μM NaCl challenge using Na+-free modified buffer solution including glucose on both sides of the 1-wk old group (n = 5) and 5-wk old group (n = 5). Data represent the means ± SD, and 2-sided Mann-Whitney U tests were employed to assess the comparison of ΔIsc values between the 2 groups (control and treatment) to evaluate the treatment effects. Statistically differences were assumed at *P < 0.05 and **P < 0.01.
Figure 4
Figure 4
Tissue conductance in glucose challenge. Tissue conductance (Gt, mS/cm2) was calculated as the average of each conductance before (−5 to 0 min), during (0–5 min), after (5–10 min) 10 mM D-glucose challenge in mucosal side of 1-wk old and 5-wk old chickens. Data represent the means ± SD. Dunn-Bonferroni post hoc test was used to compare the tissue conductance on 2 age and experimental groups in measurement of the glucose-stimulated ΔIsc. Statistically differences were assumed at *P < 0.05 and **P < 0.01.
Figure 5
Figure 5
Morphological comparison of the intestine. (A) The entire intestinal length was measured from duodenum connected to the pylorus of the stomach to the end of the ileum in chicks at 1 wk (top) and 5 wk (bottom) of age, and representative images are shown. Scale bar = 10 cm. (B) Using scanning electron microscopy (SEM), the morphology of the jejunal villi in 1- (left) and 5-wk-old (right) chickens were evaluated from the side (top) and top (bottom), and representative SEM images are shown. Scale bar = 500 μm.
Figure 6
Figure 6
mRNA expression levels on glucose transport- and cell junction-related genes. mRNA expression levels of SGLT1 (Slc5a1), Na+/K+-ATPase (Atp1a1), claudin2 (CLDN2), claudin5 (CLDN5), claudin15 (CLDN15), connexin43 (GJA1), cadherin1 (CDH1) in the distal jejunum of chicks at 1 wk (n = 4–9) and 5 wk (n = 4–9) of age were analyzed using qPCR analysis. Data represent the means ± SD. Differences between groups were evaluated by 2-sided Mann-Whitney U test.

Similar articles

Cited by

References

    1. Amat C., Planas J.M., Moreto M. Kinetics of hexose uptake by the small and large intestine of the chicken. Am. J. Physiol. 1996;271:R1085–R1089. - PubMed
    1. Barfull A., Garriga C., Mitjans M., Planas J.M. Ontogenetic expression and regulation of Na(+)-D-glucose cotransporter in jejunum of domestic chicken. Am. J. Physiol. Gastrointest. Liver Physiol. 2002;282:G559–G564. - PubMed
    1. Buddington R.K., Elnif J., Puchal-Gardiner A.A., Sanglid P.T. Intestinal apical amino acid absorption during development of the pig. Am. J. Physiol. Regul. Integr. Comp. Physiol. 2001;280:R241–R247. - PubMed
    1. De Schepper H.U., De Man J.G., Van Nassauw L., Timmermans J-P., Herman A.G., Pelckmans P.A., De Winter B.Y. Acute distal colitis impairs gastric emptying in rats via an extrinsic neuronal reflex pathway involving the pelvic nerve. Gut. 2007;56:195–202. - PMC - PubMed
    1. Drozdowski L., Woudstra T., Wild G., Clandindin M.T., Thomson A.B.R. The age-associated decline in the intestinal uptake of glucose is not accompanied by changes in the mRNA or protein abundance of SGLT1. Mech. Ageing Dev. 2003;124:1035–1045. - PubMed