. 2023 Aug 16;111(16):2488-2501.e8.
doi: 10.1016/j.neuron.2023.05.015. Epub 2023 Jun 14.

Labeling PIEZO2 activity in the peripheral nervous system

Affiliations

Labeling PIEZO2 activity in the peripheral nervous system

Nicholas W Villarino et al. Neuron. .

Abstract

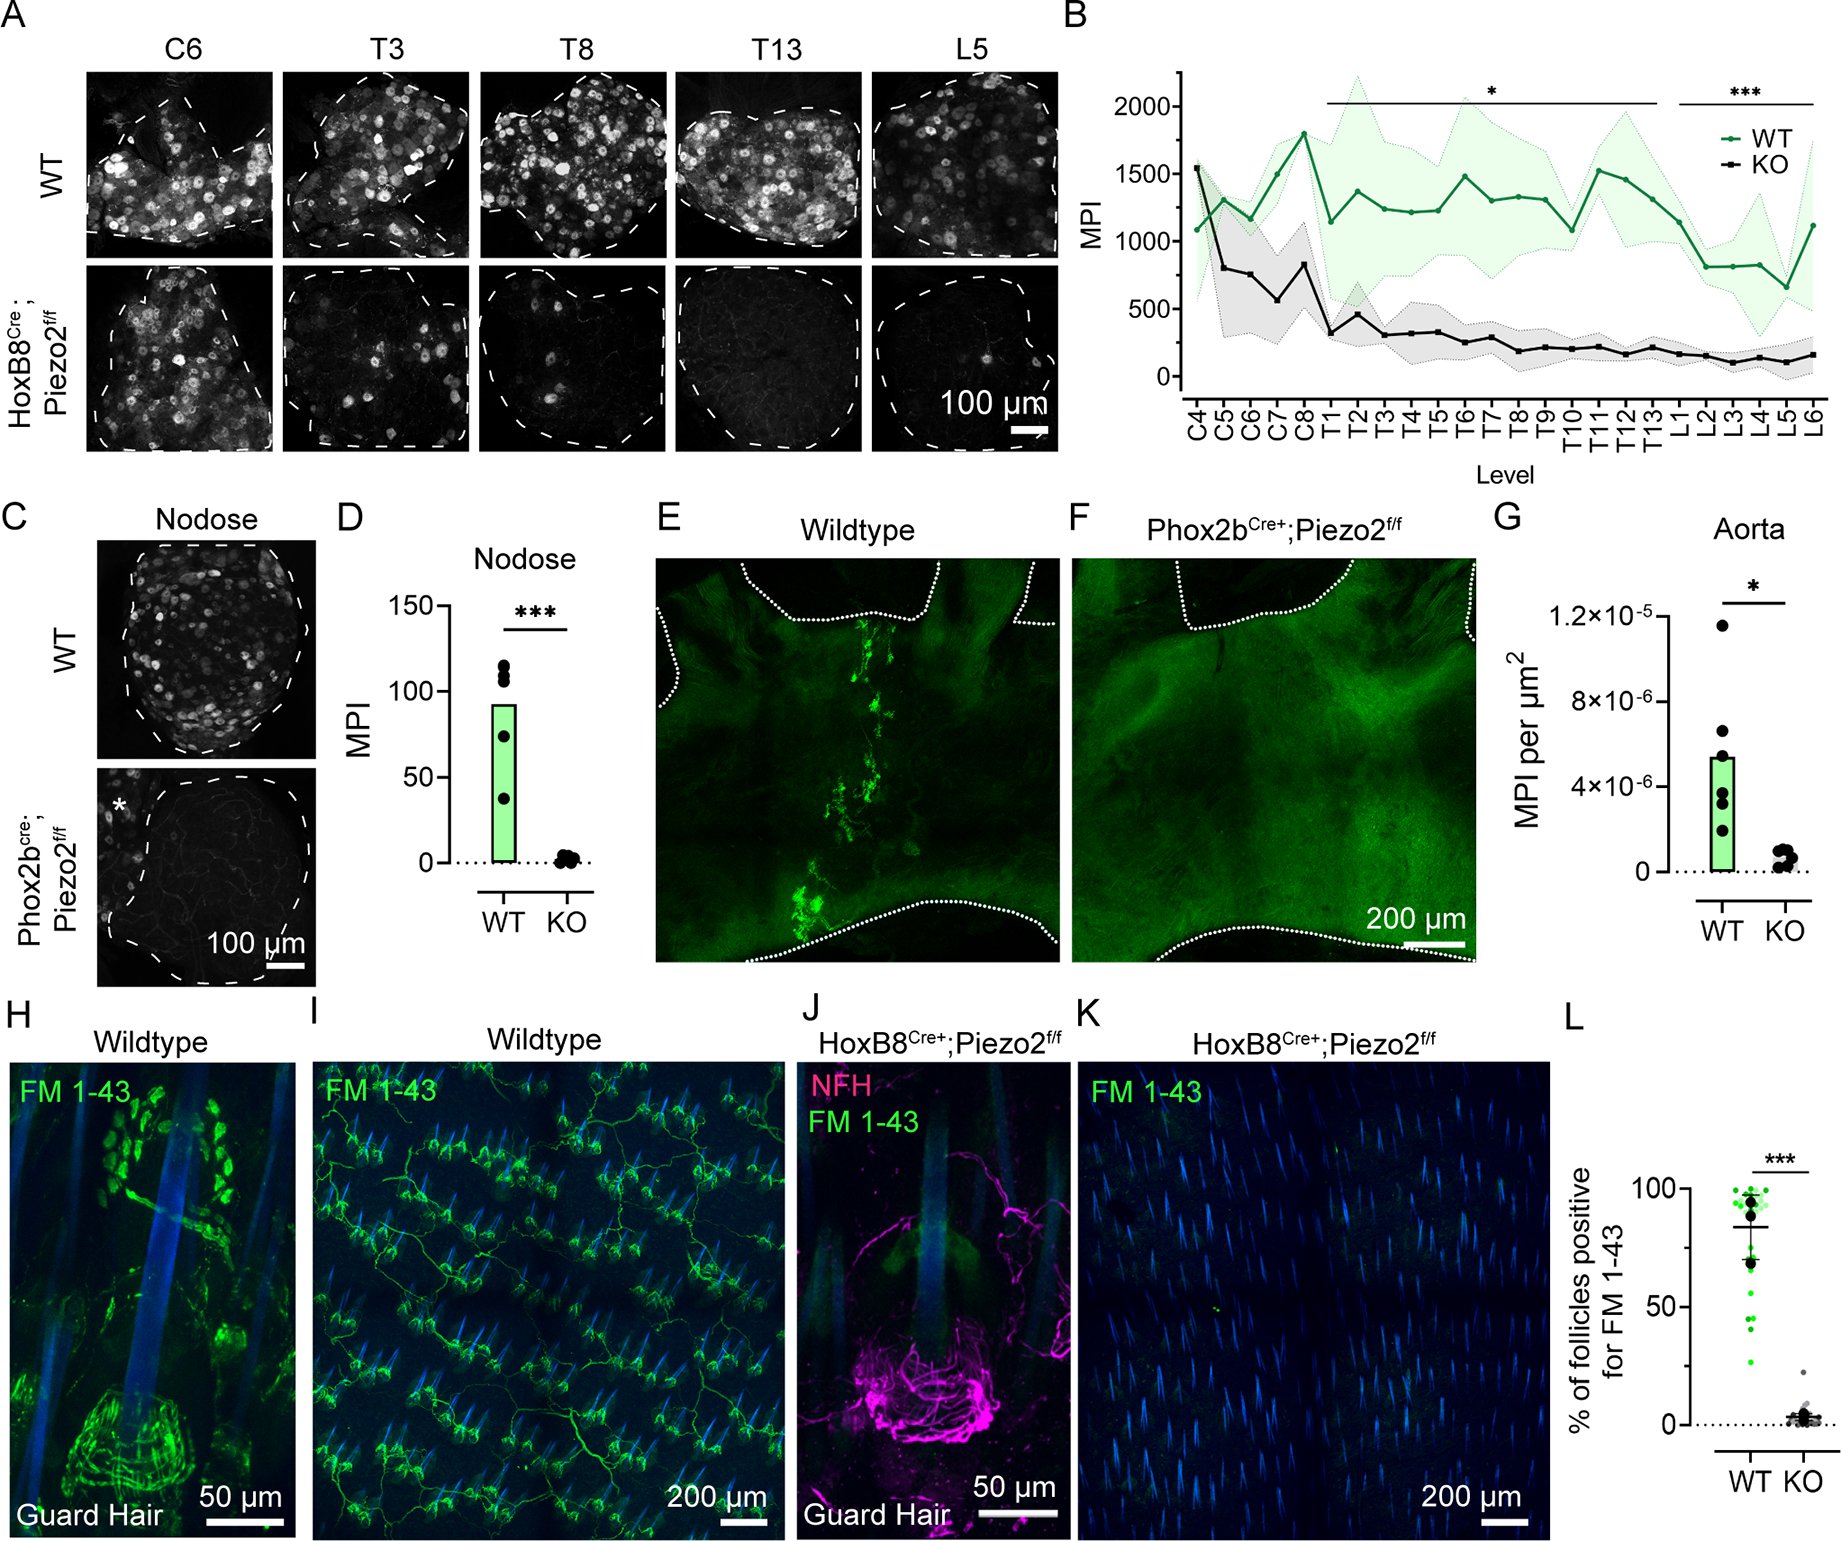
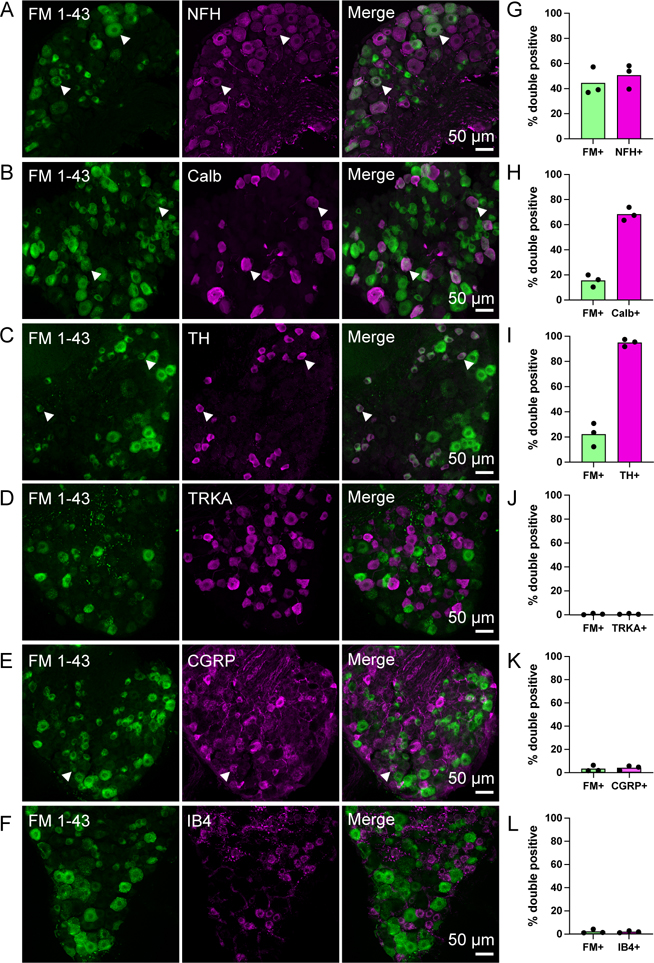
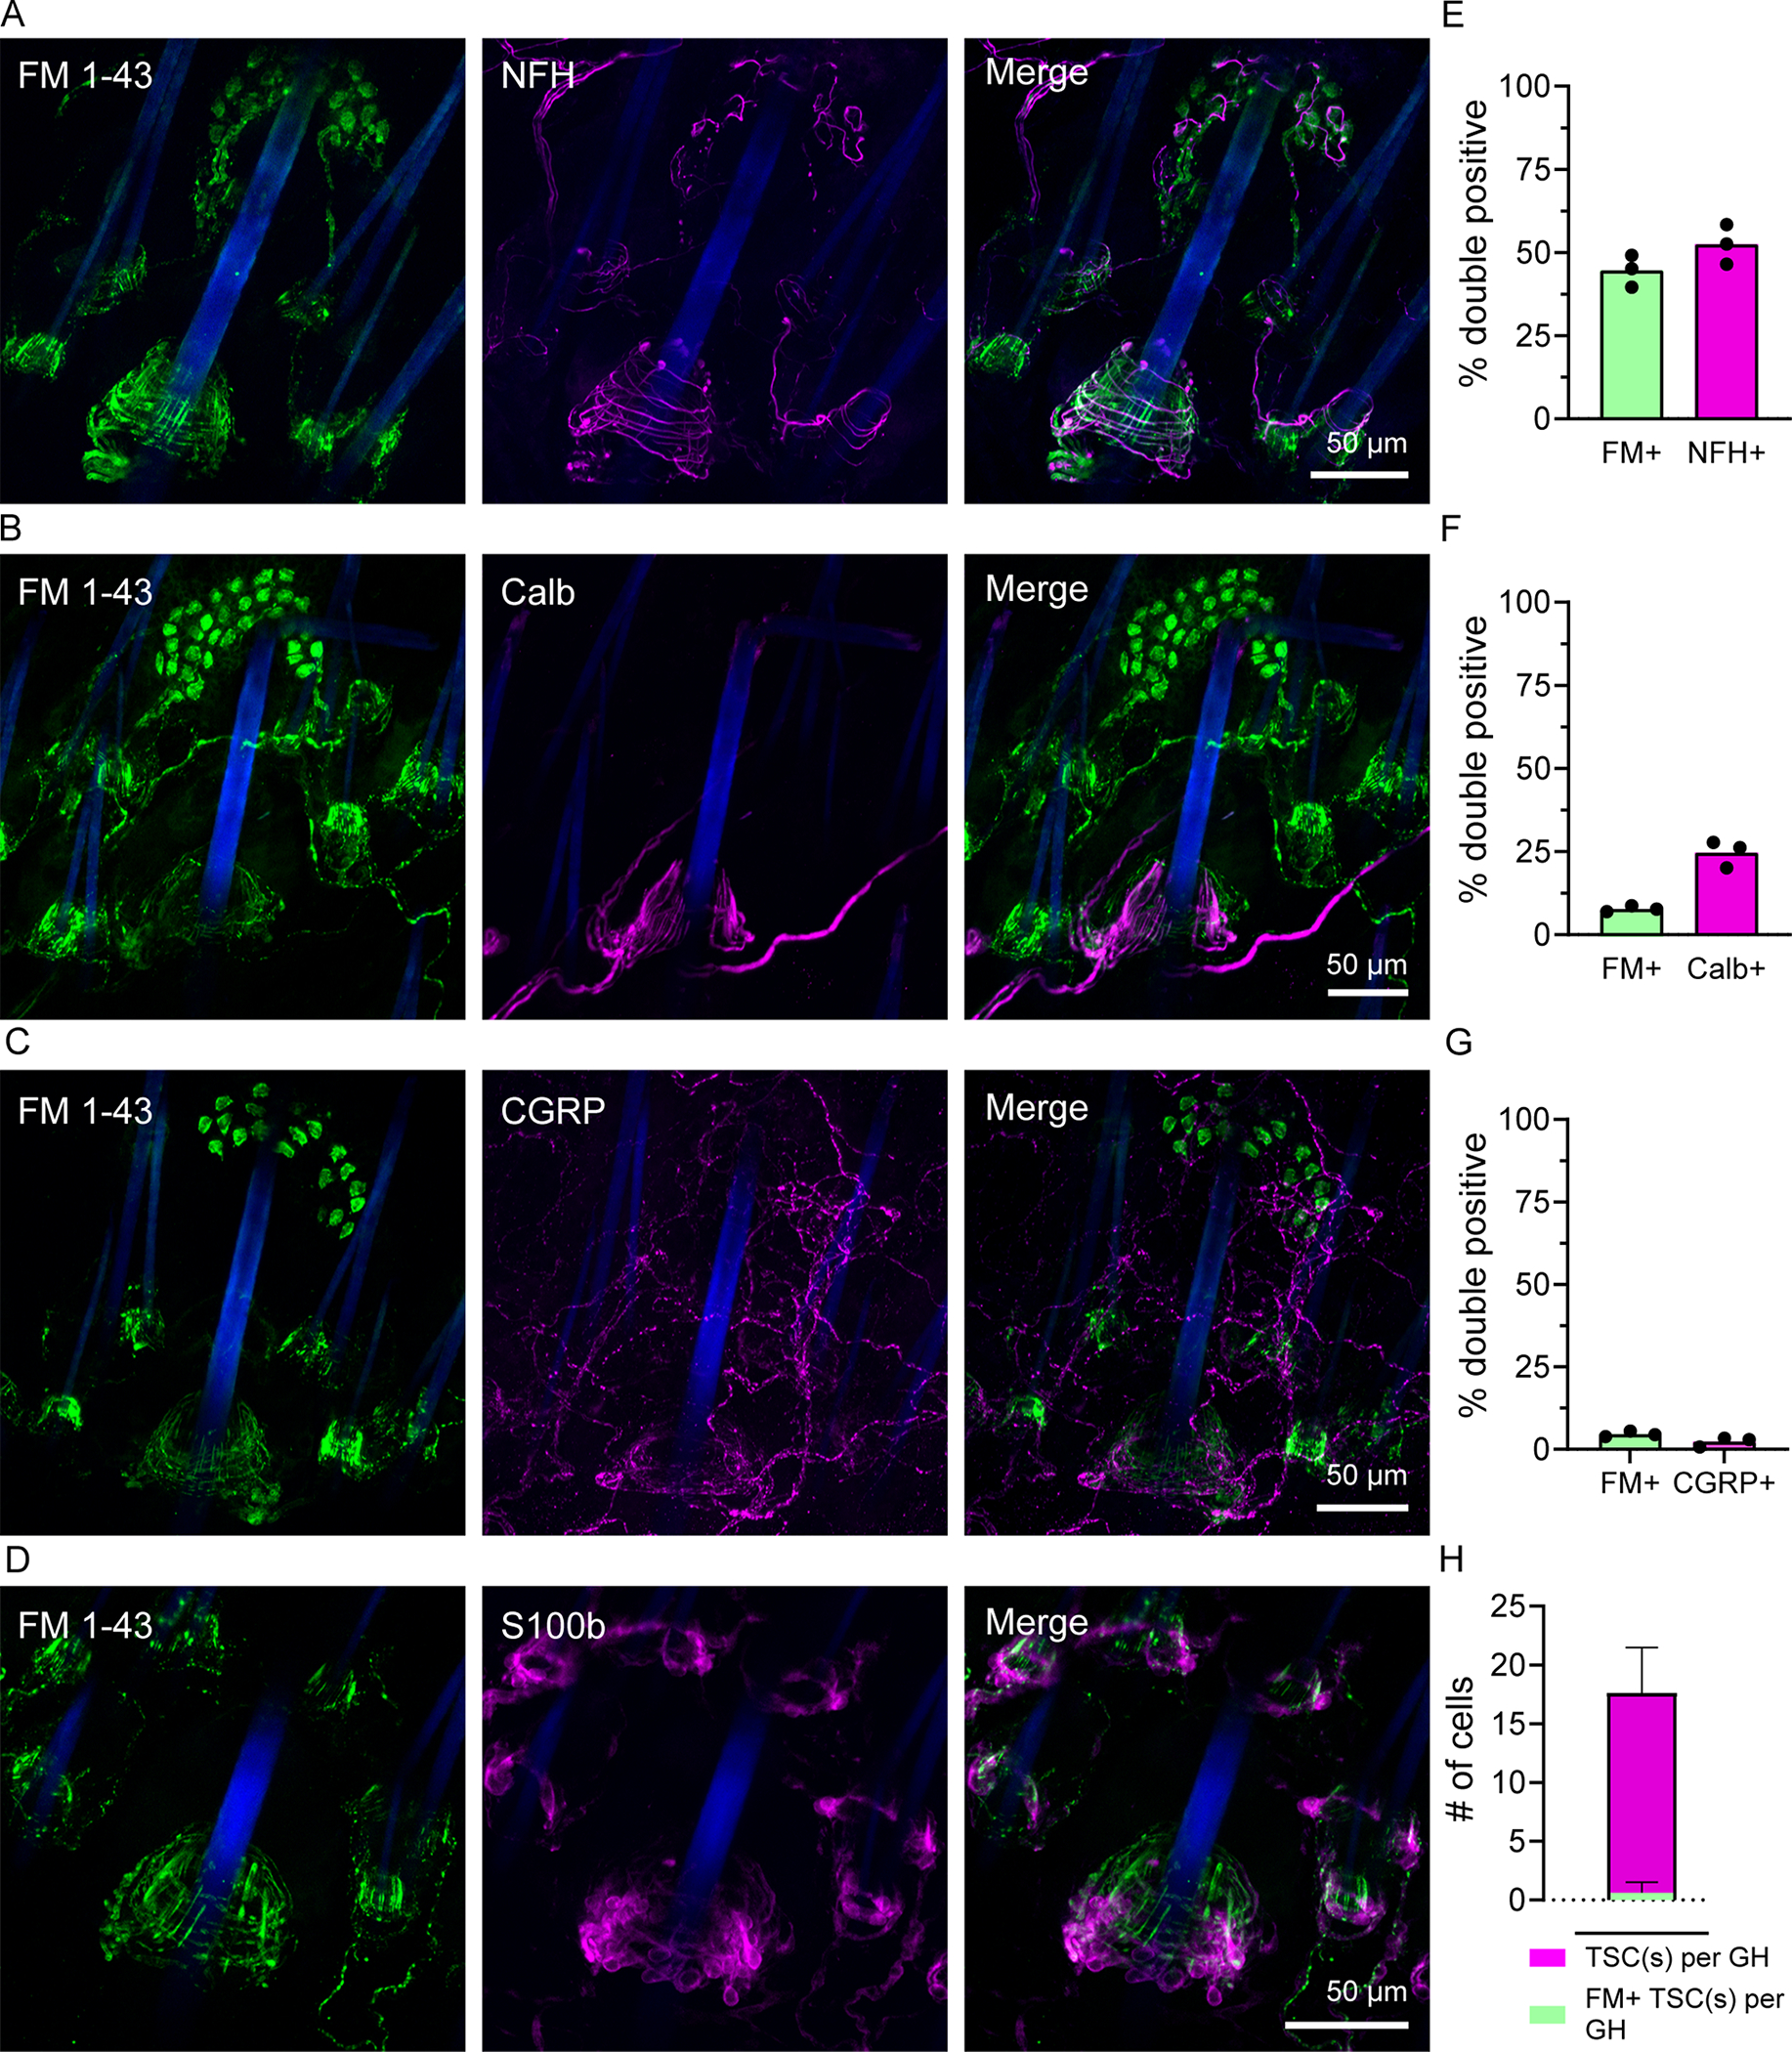
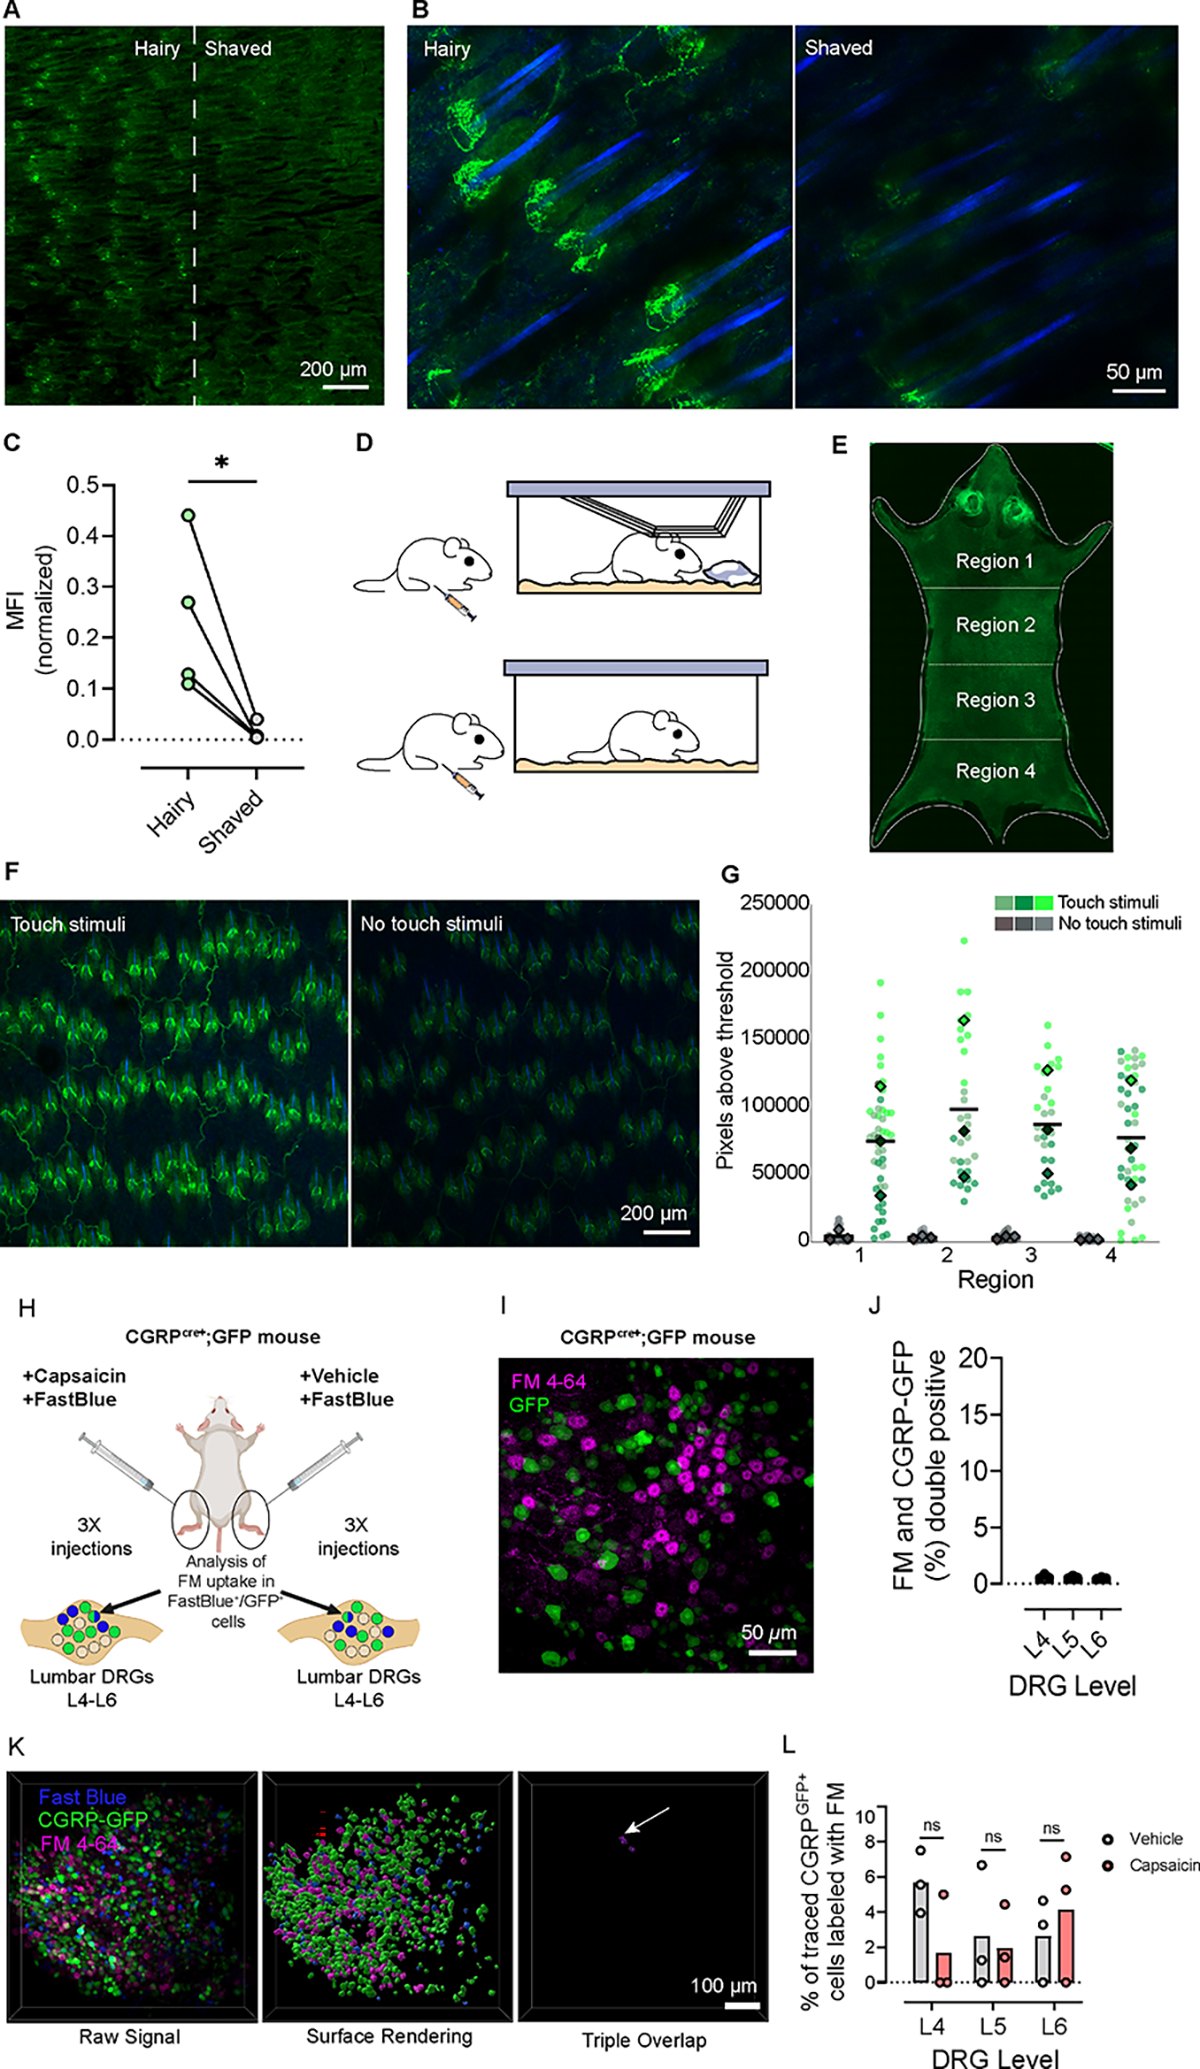
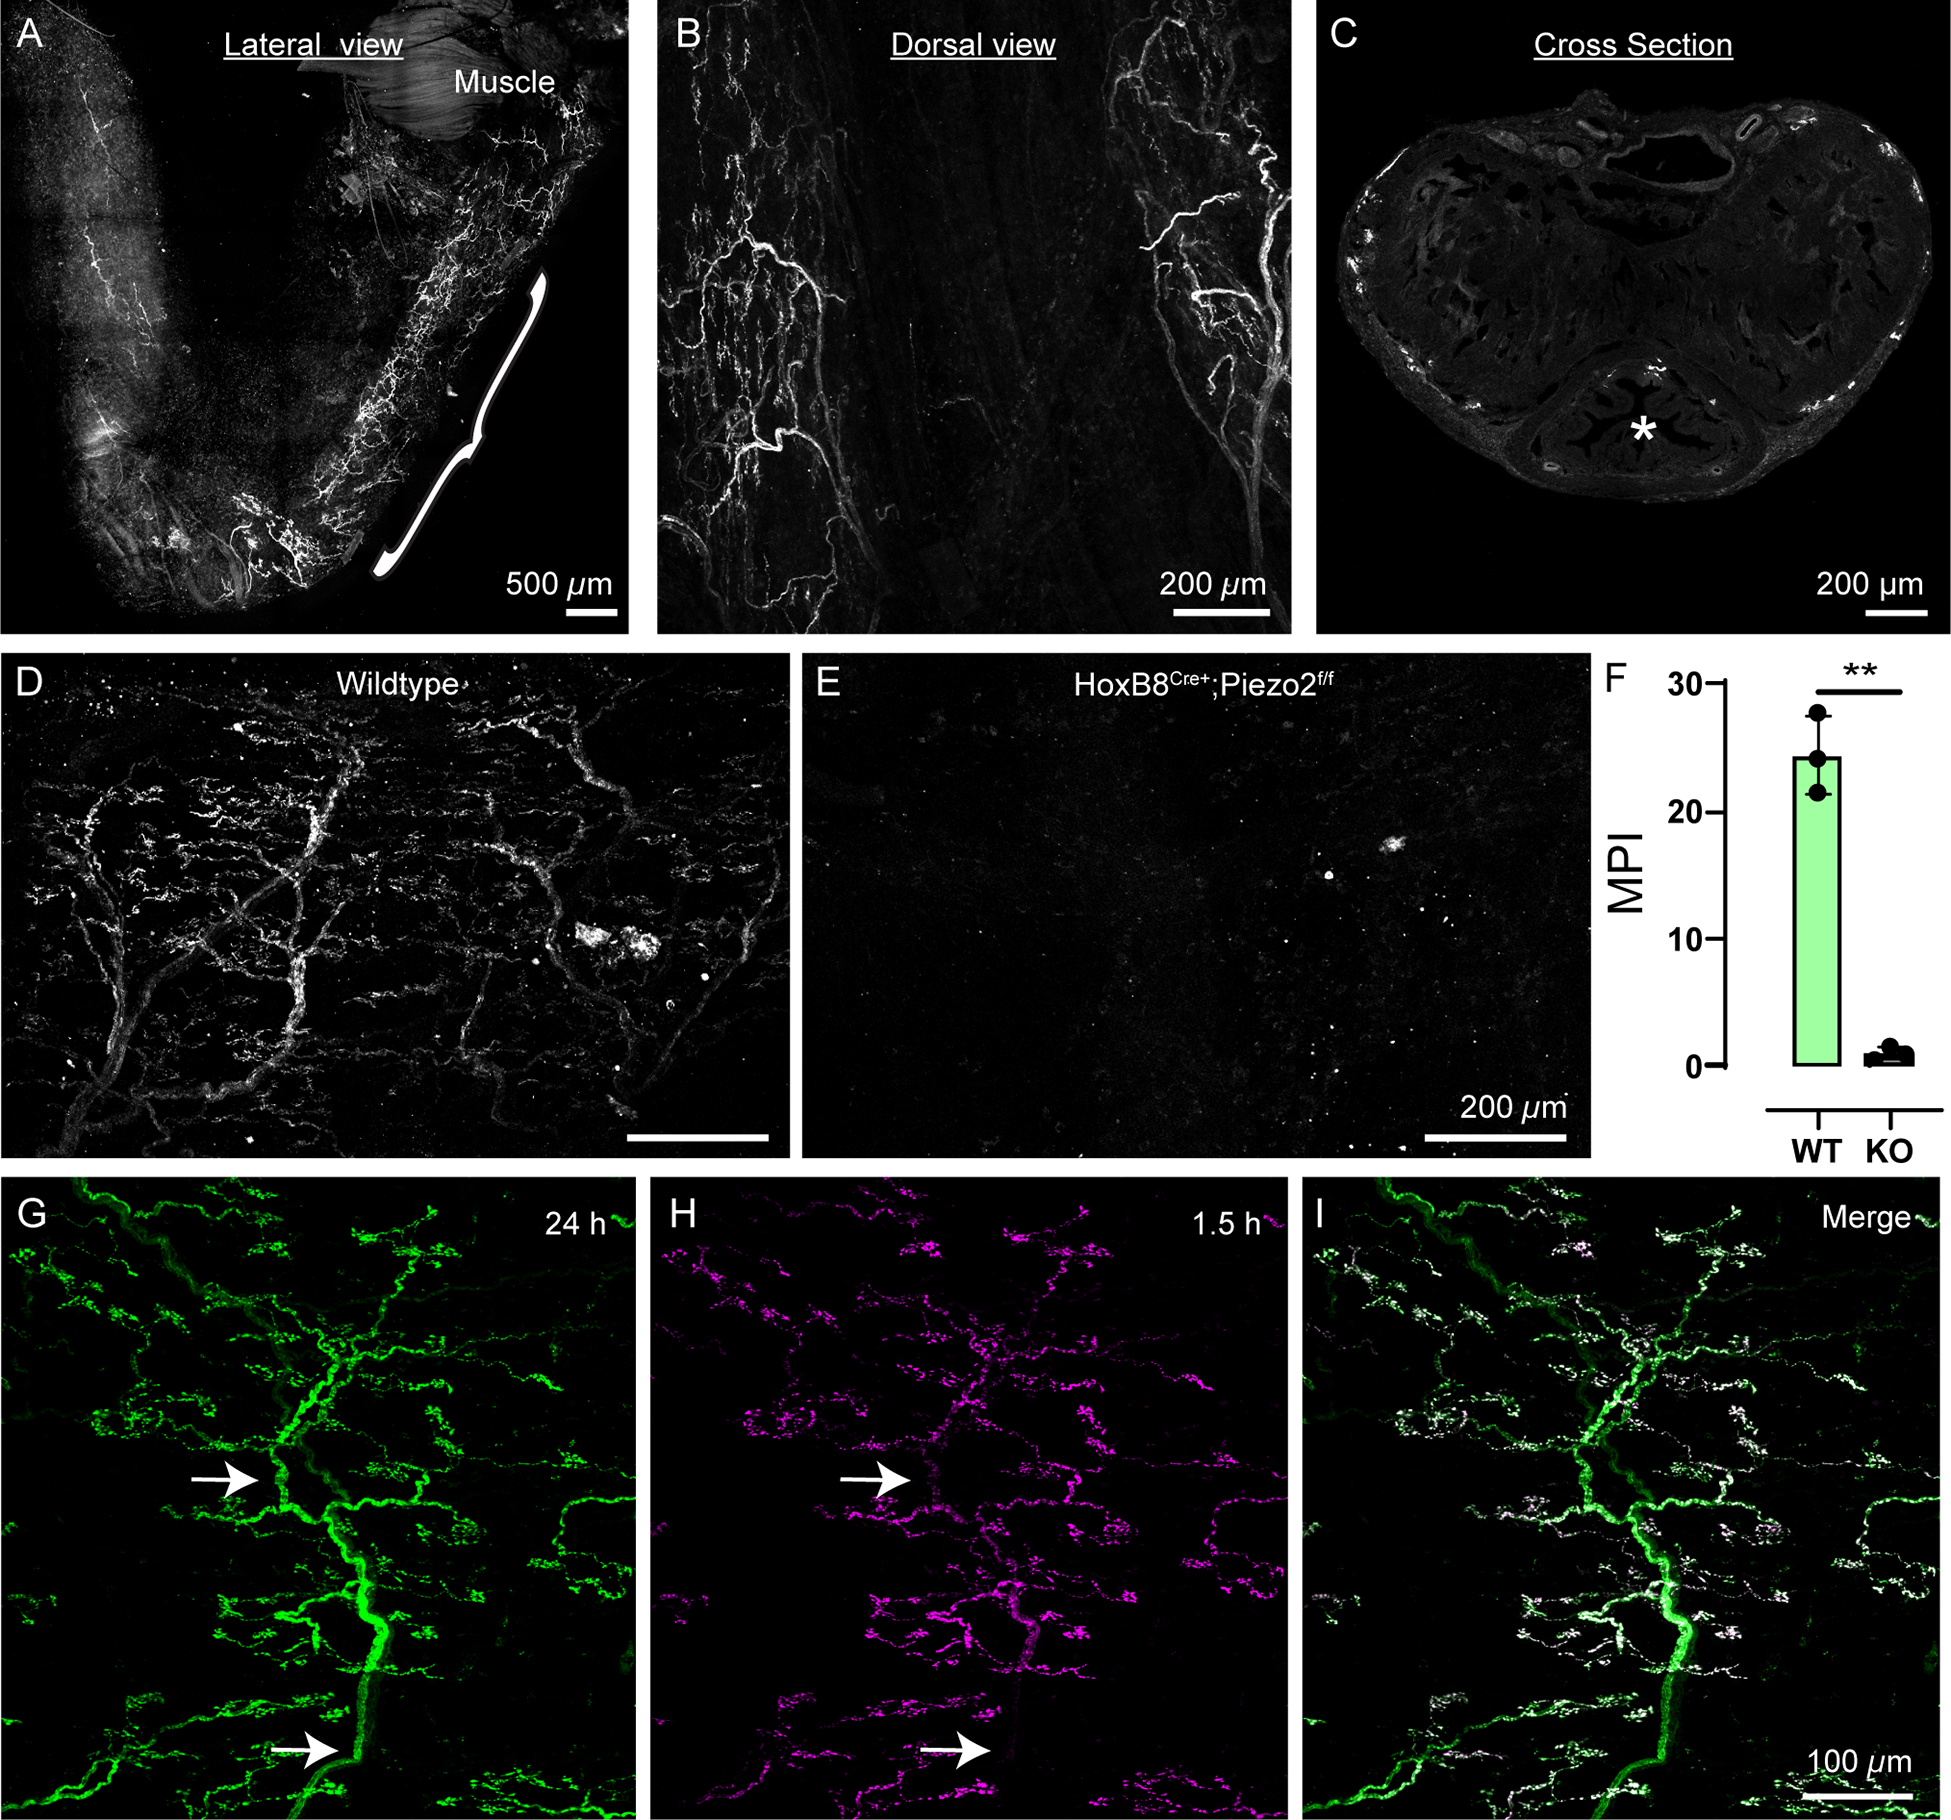
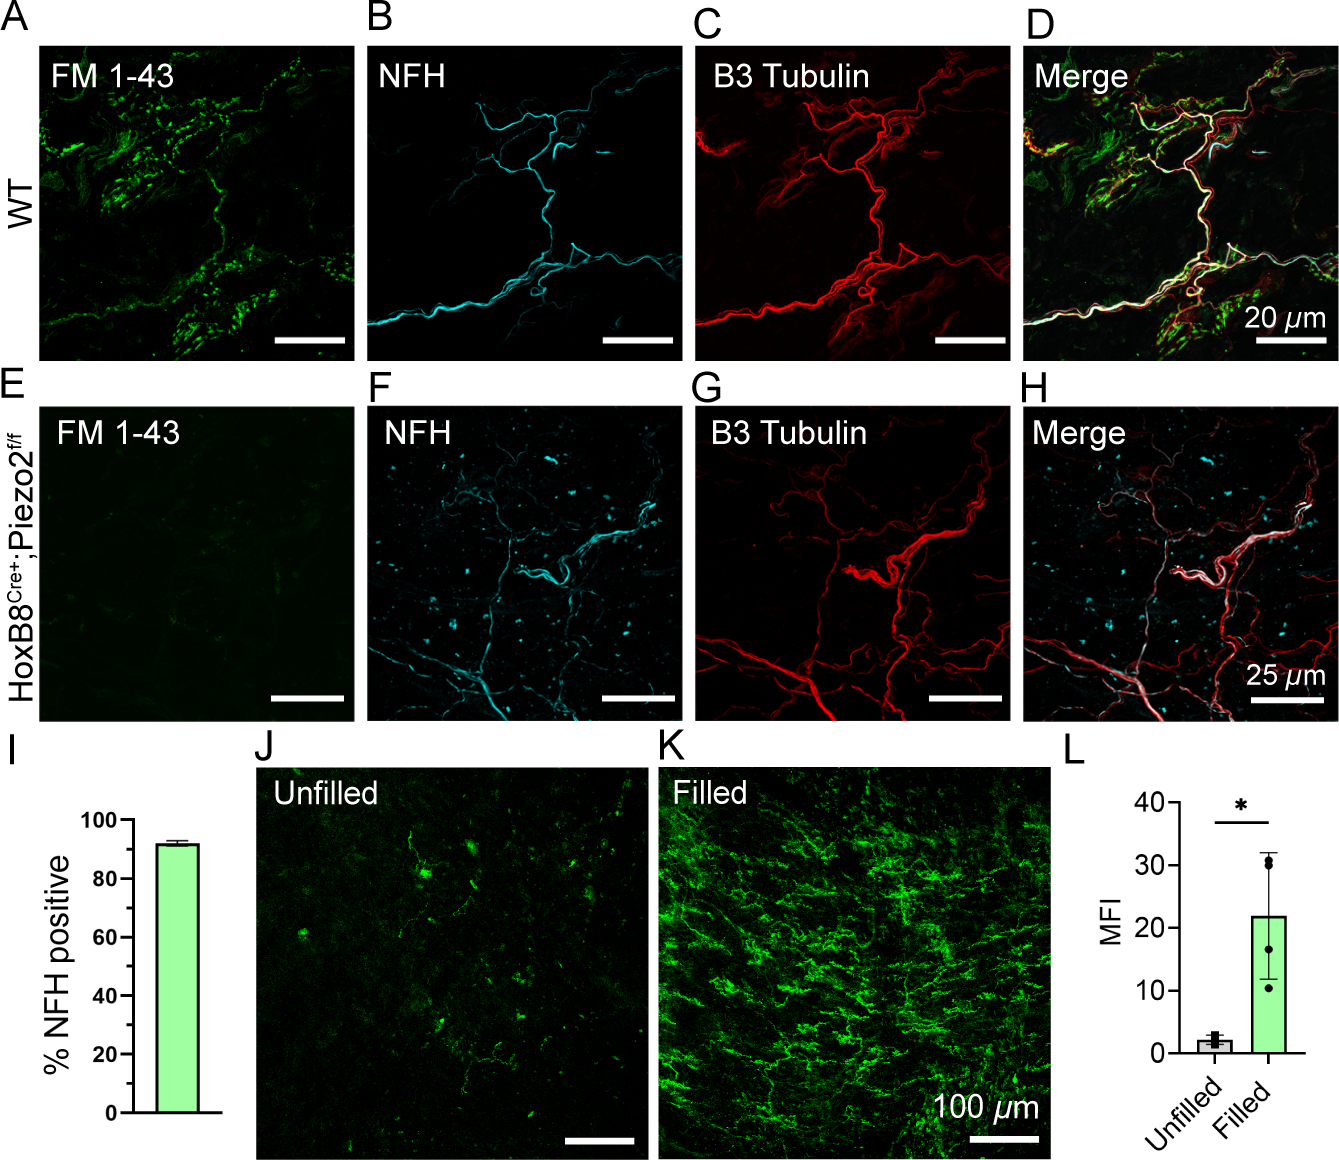
Sensory neurons detect mechanical forces from both the environment and internal organs to regulate physiology. PIEZO2 is a mechanosensory ion channel critical for touch, proprioception, and bladder stretch sensation, yet its broad expression in sensory neurons suggests it has undiscovered physiological roles. To fully understand mechanosensory physiology, we must know where and when PIEZO2-expressing neurons detect force. The fluorescent styryl dye FM 1-43 was previously shown to label sensory neurons. Surprisingly, we find that the vast majority of FM 1-43 somatosensory neuron labeling in mice in vivo is dependent on PIEZO2 activity within the peripheral nerve endings. We illustrate the potential of FM 1-43 by using it to identify novel PIEZO2-expressing urethral neurons that are engaged by urination. These data reveal that FM 1-43 is a functional probe for mechanosensitivity via PIEZO2 activation in vivo and will facilitate the characterization of known and novel mechanosensory processes in multiple organ systems.

Keywords: AM 1-43; FM 1-43; Piezo2; dorsal root ganglia; mechanosensation; sensory neurons; somatosensation; urethra; urinary tract.


Conflict of interest statement

Declaration of interests The authors declare no competing interests.

Figures

Figure 1:
Figure 1:. The majority of FM 1–43 sensory neuron uptake depends on Piezo2 expression
(A) Representative z-stack images of whole-mount dorsal root ganglia DRG from wildtype (Top) or HoxB8Cre+;Piezo2f/f (Bottom) mice that were injected i.p. with FM 1–43 24 h prior. The DRG level written on the top applies to both images underneath it. Scale bar applies to all images. Tissue area outlined with dashed line. (B) Mean pixel intensity (mean pixel intensity, abbreviated as MPI) of FM 1–43 labeling in DRGs at different vertebral level from wildtype (N=3, 2 female and 1 male) and HoxB8Cre+;Piezo2f/f KO animals(N=4, 2 male, 2 female). Center line is mean, with shaded areas representing SD. A mean pixel intensity value was calculated per animal, per region, and mean thoracic (p=0.02, *) and mean lumbar (p=0.0021, **) values were significantly lower in KO compared to WT (N=3–4 per group). Means were analyzed by Welch’s two-tailed t test. (C) Representative z-stacks of whole-mount nodose ganglion from wildtype (Top) and Phox2bCre+;Piezo2f/f mice injected i.p. with FM 1–43 24 h prior. Asterisk marks the jugular ganglion, which is fused to the nodose in mice. Nodose area outlined with dashed line. Scale bar applies to both images. (D) MPI of FM 1–43 labeling in left and right nodose ganglia from wildtype (N= 3, 1 male and 2 female) and Phox2bCre+;Piezo2f/f (N=3, 2 male and 1 female) animals. Individual dots represent values from each ganglion, two values per mouse. Means from each condition were analyzed by a Welch’s two-tailed t-test, p=0.0008 (***). (E) Representative 24 h FM 1–43 labeling of whole-mount aorta baroreceptor endings in wildtype and (F) Phox2bCre+;Piezo2f/f KO mouse. Scale bar: 200 μm. (G) MPI of FM 1–43 of the aortic arch between the left subclavian and left common carotid artery from wildtype (N= 3, 1 male and 2 female) and Phox2bCre+;Piezo2f/f (N=3, 2 male and 1 female) animals. Individual dots represent area normalized values from each field of view, two values (front and back) per mouse. Means from all animals in each condition were analyzed using a Welch’s two-tailed t-test, p=0.0198 (*). (H) Representative z-stack image of 24 h FM 1–43 labeling of cutaneous neurons around a guard hair in whole-mount skin from wildtype mouse. Hair shaft autofluorescence is shown in blue. Some Merkel cells (top of the hair shaft), longitudinal lanceolate, and circumferential endings (base of the hair shaft) are visibly labeled. (I) Representative z-stack image of 24 h FM 1–43 labeling (green) of cutaneous neurons in whole-mount skin from wildtype animals. Hair shaft autofluorescence is shown in blue. (J) Representative z-stack 24 h FM 1–43 labeling of whole-mount skin from HoxB8Cre+;Piezo2f/f KO mouse immunostained for NFH (magenta). (K) Representative z-stack image of 24 h FM 1–43 labeling (green) of cutaneous neurons in whole-mount skin from HoxB8Cre+;Piezo2f/f KO animal. (L) Quantification of the percent of follicles labeled with FM 1–43 from wildtype (N= 3, 3 female) and from (N= 3, 2 female and 1 male) HoxB8Cre+;Piezo2f/f KO animals. Individual colored dots represent a single field of view, while black dots represent means from each animal. Means from all animals in each condition plotted ± S.D. and were analyzed using a Welch’s two-tailed t-test, p=0.0005 (***).
Figure 2:
Figure 2:. Characterization of DRG cell types that take up FM 1–43
(A-F) Representative z-stack images of immunostained DRG sections from wild-type mice injected i.p. with FM 1–43 48h prior. Arrowheads indicate examples of double positive cells where present. Scale bar applies to all images on the same row. (G-L) Quantification of the percent of double positive cells from within the FM 1–43 positive population or double positive cells within the cell marker population in DRG sections from wildtype animals. N=3 mice, individual means from each shown as a single dot. Bars represent mean value from all three animals.
Figure 3:
Figure 3:. FM 1–43 uptake in cutaneous end organ structures
(A-D) Representative z-stack images of immunostained guard hairs in whole-mount skin from wild-type mice injected i.p. with FM 1–43 24h prior. FM 1–43 signal shown on left (green), immunostained marker shown in middle (magenta), and merged image shown on the right. Scale bar applies to all images on the same row. (E-G) Quantification of the percent of double positive signal from within FM 1–43 (left bar) or marker positive (right bar) signal. N=3 female mice, 5–8 fields of view analyzed per animal. Individual means from each animal shown as a single dot, Bars represent mean value from all three animals. (H) Quantification of the Schwann cell colocalization with FM 1–43 signal near guard hairs. Magenta bar indicates the average count of TSCs per guard hair, green indicates the average number of TSCs colocalized with FM. N=3 female mice, 5–6 guard hairs analyzed per mouse plotted ± S.D.
Figure 4:
Figure 4:. FM dyes label cutaneous end organ structures in an activity-dependent manner and do not label TRPV1 expressing neurons after capsaicin stimulus
(A) Low magnification z-stack image of FM 1–43 labeling of skin after dehairing, 16 h post i.p. FM 1–43 injection. The border of normal hairy (left) and depilated (right) hindlimb skin indicated by the dotted line. (B) Higher magnification representative image of ‘Hairy’ (left) and ‘Shaved’ (right) hindlimb skin. Scale bar applies to both images. (C) Quantification of the mean FM 1–43 fluorescence signal normalized to hair follicle count. Individual points represent mean values from 5 fields of view imaged from each condition, per mouse (N = 4 mice), analyzed using a paired t-test (p = 0.0487). (D) Schematic diagram of mouse cage with ‘Touch Stimuli’ (top, wire cage bar and nestlet) and one with ‘No touch stimuli’ (bottom, no wire cage bar or nestlet). (E) Widefield stitched image of whole dorsal back skin from a mouse at 25x. Dashed lines indicate regional distinctions used for analysis. Bright regions at the head are the autofluorescent ears: face and ear skin were not imaged at higher magnification for analysis. (F) Representative z-stack images of dorsal skin with ‘Touch Stimuli’ (left) and with ‘No touch stimuli’ (right). Scale bar applies to both images. (G) Quantification of the sum of pixels above a set threshold in each region. Colored dots represent each field of view analyzed and the corresponding colored diamond represents the mean from each animal. Means were analyzed using two-way ANOVA with Sidák’s multiple comparisons test, and by this test treatment conditions were significantly different p=0.0340. Due to insufficient N to determine normality (N=3), we also ran the Mann-Whitney U test non-parametruc analysis which returned p = 0.1 However, the data shows a clear trend, which we speculate would be significant with higher N. (H) Schematic diagram of attempt to achieve FM labeling of TRPV1 expressing neurons. CGRPcre+;GFP mice were injected with FM 4–64, followed by 2 h waiting period. FastBlue and capsaicin/vehicle was co-injected subcutaneously intraplantar, near the proximal tibia, and lower biceps femoris. After 72 h, DRGs (L4-L6) were collected, fixed, and wholemount imaged. (I) Representative z-stack of a lumbar DRG from a CGRPcre+;GFP mouse, i.p. injected with FM 4–64 24 h prior. GFP (green) and FM 4–64 (magenta) channels are displayed as a single merged image. (J) Quantification of overlap between FM 4–64 and GFP from CGRPcre+;GFP mouse 72 h post i.p. FM 4–64 injection. Dots represent means from each vertebral level. N=3 DRGs analyzed per level. (K) 3D representation of raw signal from an L6 DRG (top left) from a ‘Vehicle’ injected animal. Surface rendering of each channel (top right) and triple overlap (bottom) are shown using Imaris surface-surface colocalization tool. Arrow points to a confirmed instance of triple overlap. Scale bar applies to all images. (L) Quantification of FM 4–64 labeling in DRGs expressed as a percent of CGRPGFP/FastBlue-positive cells. N=3 animals (1 female and 2 male). Means from each DRG level (L4, L5, L6) are plotted and analyzed using a paired two-tailed t-test (p=0.184, 0.841, 0.613 respectively).
Figure 5:
Figure 5:. In cell culture, FM 1–43 labeling increases with human PIEZO2 channel activity
(A) Representative images from HEK P1KO cells that were transfected with control plasmid, exposed to FM 1–43, and had no stimulus. Scale applies to all images. (B) HEK P1KO cells transfected with control plasmid and exposed to orbital shaking. (C) Representative flow cytometry plots from HEK P1KO cells transfected with control plasmid. X-axis is FITC-A (log scale) and represents FM 1–43 loading; Y-axis is % cell count. (D-E) Images from HEK P1KO cells transfected with PIEZO2 with no stimulus(D) or (E) exposed to orbital shaking. (F) Flow cytometry histograms of PIEZO2 transfected HEK P1KO cells with (green) and without (gray) exposure to shaking, axes as in (C) (G-H) Representative images and flow cytometry plots from HEK cells transfected with PIEZO2R2868H, a gain-of-function allele, with no stimulus (G) and (H) exposed to orbital shaking. (I) Representative flow cytometry histograms from HEK cells transfected with PIEZO2R2868H with (green) and without (gray) exposure to orbital shaking, axes as in (C) (J) Flow cytometry quantification of each transfection condition with and without orbital shaking, normalized to control transfected cells. Averages are plotted from 3 biological replicates ± S.D. Analyzed using unpaired two-tailed t-test, PIEZO2 WT p < 0.00001 (****) and PIEZO2R2686H p = 0.0475 (*). Connecting lines indicate biological replicates run on same day. (K) FM 1–43 uptake, shown as a percent of maximum, is suppressed in a concentration-dependent manner during exposure to ruthenium red (x-axis). (L-M) Stimulus-dependent mechanically activated (poke) whole cell currents were acquired in 1 μm increments under control conditions (top, black traces) and in the presence of 10 μM FM 1–43 (bottom, green traces). Currents were recorded at either a holding potential of −80 mV (L) or +80 mV (M). Poker displacements are shown (up to 4 μm above threshold). Currents are leak subtracted relative to levels prior to the mechanical stimulus. (N) Inhibition of hPIEZO2 mediated MA currents is plotted as a percent of control for n= 10 cells. (O) When inhibition was possible to determine at +80 mV for an individual cell (n=5), the data from an individual cell is connected. Analyzed by two-tailed paired t-test, p=0.0015 (**).
Figure 6:
Figure 6:. FM 1–43 reveals novel lateralized sensory endings in the pelvic urethra of male mice
(A) Lateral view of the male pelvic urethra labeled by FM 1–43 injection 24 h before tissue harvest. Bracket indicates pelvic urethra and area of urethral neuron labeling. Note free nerve endings in the most distal penile urethra. (B) Dorsal view of the pelvic urethra. (C) Cross-sectional view of the pelvic urethra shaft showing labeling around the edges. Urethral opening is marked by an asterisk. (D) 24 h FM 1–43 labeling of neurons in a wildtype pelvic urethra. (E) 24 h after FM 1–43 injection in a HoxB8Cre+;Piezo2f/f KO mouse, the pelvic urethra shows no neuronal labeling. (F) Mean pixel intensity of FM 1–43 labeling in pelvic urethra from wildtype (N= 3) and HoxB8Cre+;Piezo2f/f KO (N=3) animals. Dots represent individual animals, data shown as mean ± SD Means from all animals in each condition were analyzed using a Welch’s two-tailed t-test, p=0.0049 (**). (G) 24 h labeling of a urethral neuron ending shows nerve trunks (arrows). (H) 1.5 h labeling of the same neuron ending in F with FM 4–64 only shows labeling on the “leaves” of the tree. (I) Merged image from channels in G,H. White represents overlap.
Figure 7:
Figure 7:. Characterization of tree-like urethral neuron endings, which are engaged during urination
(A-D) High magnification z-stack image of FM 1–43 labeling and immunostaining of a urethral ending in a wildtype animal, 24 h after injection. (E-H) High magnification z-stack image of FM 1–43 labeling and immunostaining of a urethral ending in a HoxB8Cre+;Piezo2f/f KO animal, 24 h after injection. (I) Quantification of NFH-positive innervation of urethral neuron endings expressed as a percent. N=3 mice analyzed, 5–6 fields of view per animal. Data shown as mean ± SD. (J) FM 1–43 labeling in the pelvic urethra when the bladder remains unfilled. (K) FM 1–43 labeling of neuron endings in the pelvic urethra after 1 h of continuous bladder filling and recurring micturition cycles. (L) Quantification of FM 1–43 labeling brightness (MPI) of endings in pelvic urethra in ‘Filled’ versus ‘Unfilled’ animals. Dots represent individual animals, data shown as mean ± SD. N=4 mice per condition were analyzed per condition using an unpaired t-test, p < 0.024 (*).

References

    1. Coste B, Mathur J, Schmidt M, Earley TJ, Ranade S, Petrus MJ, Dubin AE, and Patapoutian A (2010). Piezo1 and Piezo2 are essential components of distinct mechanically activated cation channels. Science 330, 55–60. 10.1126/science.1193270. - DOI - PMC - PubMed
    1. Marshall KL, Saade D, Ghitani N, Coombs AM, Szczot M, Keller J, Ogata T, Daou I, Stowers LT, Bonnemann CG, et al. (2020). PIEZO2 in sensory neurons and urothelial cells coordinates urination. Nature 588, 290–295. 10.1038/s41586-020-2830-7. - DOI - PMC - PubMed
    1. Ranade SS, Woo SH, Dubin AE, Moshourab RA, Wetzel C, Petrus M, Mathur J, Begay V, Coste B, Mainquist J, et al. (2014). Piezo2 is the major transducer of mechanical forces for touch sensation in mice. Nature 516, 121–125. 10.1038/nature13980. - DOI - PMC - PubMed
    1. Woo SH, Lukacs V, de Nooij JC, Zaytseva D, Criddle CR, Francisco A, Jessell TM, Wilkinson KA, and Patapoutian A (2015). Piezo2 is the principal mechanotransduction channel for proprioception. Nat Neurosci 18, 1756–1762. 10.1038/nn.4162. - DOI - PMC - PubMed
    1. Woo SH, Ranade S, Weyer AD, Dubin AE, Baba Y, Qiu Z, Petrus M, Miyamoto T, Reddy K, Lumpkin EA, et al. (2014). Piezo2 is required for Merkel-cell mechanotransduction. Nature 509, 622–626. 10.1038/nature13251. - DOI - PMC - PubMed

Publication types

MeSH terms

LinkOut - more resources