. 2024 May:59:79-96.
doi: 10.1016/j.jare.2023.06.003. Epub 2023 Jun 13.

HMGB1/STAT3/p65 axis drives microglial activation and autophagy exert a crucial role in chronic Stress-Induced major depressive disorder

Affiliations

HMGB1/STAT3/p65 axis drives microglial activation and autophagy exert a crucial role in chronic Stress-Induced major depressive disorder

Ke Xu et al. J Adv Res. 2024 May.

Abstract

Introduction: Neuroinflammation and autophagy are implicated in stress-related major depressive disorder (MDD), but the underlying molecular mechanisms remain largely unknown.

Objectives: Here, we identified that MDD regulated by HMGB1/STAT3/p65 axis mediated microglial activation and autophagy for the first time. Further investigations were performed to uncover the effects of this axis on MDD in vivo and in vitro.

Methods: Bioinformatics analyses were used to re-analysis the transcriptome data from the dorsolateral prefrontal cortex (dlPFC) of post-mortem male MDD patients. The expression level of HMGB1 and its correlation with depression symptoms were explored in MDD clinical patients and chronic social defeat stress (CSDS)-induced depression model mice. Specific adeno-associated virus and recombinant (r)HMGB1 injection into the medial PFC (mPFC) of mice, and pharmacological inhibitors with rHMGB1 in two microglial cell lines exposed to lipopolysaccharide were used to analyze the effects of HMGB1/STAT3/p65 axis on MDD.

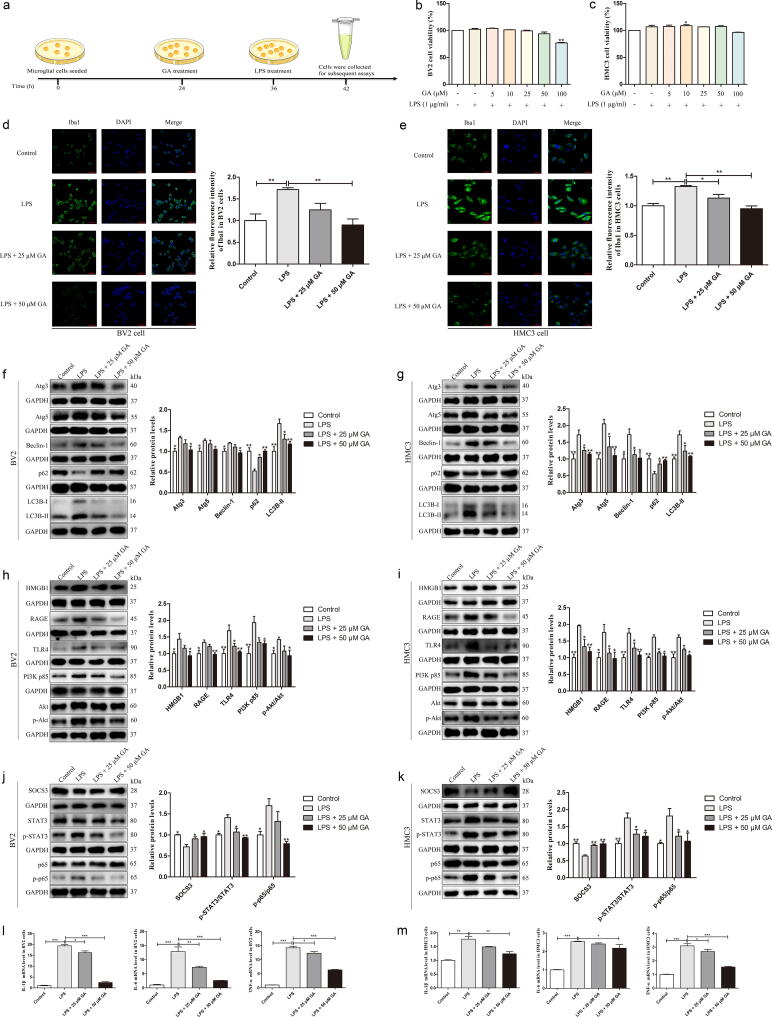
Results: The differential expression of genes from MDD patients implicated in microglial activation and autophagy regulated by HMGB1/STAT3/p65 axis. Serum HMGB1 level was elevated in MDD patients and positively correlated with symptom severity. CSDS not only induced depression-like states in mice, but also enhanced microglial reactivity, autophagy as well as activation of the HMGB1/STAT3/p65 axis in mPFC. The expression level of HMGB1 was mainly increased in the microglial cells of CSDS-susceptible mice, which also correlated with depressive-like behaviors. Specific HMGB1 knockdown produced a depression-resilient phenotype and suppressed the associated microglial activation and autophagy effects of CSDS-induced. The effects induced by CSDS were mimicked by exogenous administration of rHMGB1 or specific overexpression of HMGB1, while blocked by STAT3 inhibitor or p65 knockdown. In vitro, inhibition of HMGB1/STAT3/p65 axis prevented lipopolysaccharide-induced microglial activation and autophagy, while rHMGB1 reversed these changes.

Conclusion: Our study established the role of microglial HMGB1/STAT3/p65 axis in mPFC in mediating microglial activation and autophagy in MDD.

Keywords: Autophagy; HMGB1/STAT3/p65 axis; Major depressive disorder; Medial prefrontal cortex; Microglial; Neuroinflammation.


Conflict of interest statement

Declaration of Competing Interest The authors declare that they have no known competing financial interests or personal relationships that could have appeared to influence the work reported in this paper.

Figures

None
Graphical abstract
Fig. 1
Fig. 1
Major depressive disorder (MDD) may be associated with HMGB1/STAT3/p65 axis-mediated microglial activation and autophagy in the dorsal lateral prefrontal cortex. (a) Venn diagram of differential expressed genes (DEGs) between groups. Four upregulated DEGs were shared by MDD and MDD with suicide (MDDS) patients versus controls. (b, c) Heatmap of the top 50 DEGs between MDD patients and controls (b) and the 21 DEGs between MDDS patients and controls. (c). (d, e) Top 10 enriched gene ontology (GO) terms on “biological process” for DEGs between MDD and control groups (d) and between the MDDS and control groups (e). (f, g) Top 20 ingenuity pathway functional enrichment of DEGs between MDD and control groups (f) and between the MDDS and control groups (g). (h) Venn diagram of the top 20 enriched pathways for MDD vs. control groups and MDDS vs. control groups, and the 6 co-enriched (shared) pathways. (i) Potential relationships among MDD, HMGB1 signaling, Toll-like receptor signaling, NF-κB signaling, and STAT3 signaling. (j) Potential molecular networks linking MDD, autophagy, activation of microglia, IL-1β, IL-6, TNF, and the HMGB1/STAT3/RELA (NF-κB p65) axis.
Fig. 2
Fig. 2
Serum HMGB1 level predicts major depressive disorder (MDD) symptom severity. (a) Serum HMGB1 levels in healthy controls (n = 40), drug-naive MDD patients (DN-MDD; n = 39), and MDD patients with relapse or current drug treatment (DT-MDD; n = 38). (b, c) ROC curves of HMGB1 for DN-MDD (b) and DT-MDD (c) diagnosis. (d) Pearson correlation between serum HMGB1 concentration and MDD symptom severity HDRS value. Detection limit of the ELISA: 10 pg/ml. Data are presented as mean ± S.E.M. ***P < 0.001 vs. healthy controls. AUC, area under the ROC curve; ROC, receiver operating characteristic.
Fig. 3
Fig. 3
Correlation analysis between depressive-like behaviors and HMGB1 level in the mPFC of chronic social defeat stress (CSDS) model mice. (a) Experimental timeline of CSDS. (bf) Social interaction ratio and time in the interaction zone (b), sucrose preference (c), number of entries into the open arm and total time spent in the open arm of elevated plus maze test (d), number of rearings, total distance traveled, and distance traveled in the center zone during the 5-min open field test (e), and immobility time in the tail suspension test (TST; f) for control mice (n = 13), CSDS-treated susceptible mice (n = 17), and CSDS-treated resilient mice (n = 13). (g) RT-qPCR analysis of HMGB1 mRNA expression in the mPFC (n = 5 per group). (h) HMGB1 protein expression level in the mPFC (n = 4 per group). (ip) Pearson correlation analysis between HMGB1 mRNA level and depressive-like behaviors (n = 5 per group), including social interaction ratio (i), sucrose preference (j), number of entries into the open arm (k), total time spent in the open arm (l), number of rearings (m), total distance traveled (n), distance traveled in the center zone (o), and immobility time in the TST (p). Data are presented as mean ± SEM. *P < 0.05, **P < 0.01 vs. control group.
Fig. 4
Fig. 4
Chronic social defeat stress (CSDS) promotes microglial HMGB1/STAT3/p65 axis expression in the mPFC of susceptible mice. (a) Representative immunofluorescence images showing and densitometric analysis of the percentage of HMGB1 in Iba1-positive cells (green; microglia), GFAP-positive cells (green; astrocytes), and NeuN-positive cells (green; neurons) in the mPFC of control and CSDS-susceptible mice (n = 3 per group; scale bar, 50 µm). Cell nuclei are counterstained blue with 4,6-diamidino-2-phenylindole (DAPI). (b, c) Expression levels of HMGB1 downstream proteins in the mPFC (n = 4 per group), including RAGE, TLR4, PI3K p85, p-Akt/Akt, SOCS3, p-STAT3/STAT3, and p-p65/p65. (df) mRNA levels of IL-1β (d), IL-6 (e), and TNF-α (f) in the mPFC (n = 5 per group). Data are presented as mean ± SEM. *P < 0.05, **P < 0.01, ***P < 0.001 vs. control group.
Fig. 5
Fig. 5
Chronic social defeat stress (CSDS) treatment results in increased microglial activation and autophagy in the mPFC of susceptible mice. (a) Representative immunofluorescence images of Iba1 within the mPFC (scale bar, 50 µm), three-dimensional (3D) construction (scale bar, 100 µm), and Sholl analysis in each group. (bd) Iba1 fluorescence intensity (b), the density of microglia (c), and Sholl analysis for branch interactions as a function of distance from the soma (d) in the mPFC (n = 3 per group). (e) Iba1 expression level in the mPFC (n = 3 per group). (f) Expression levels of autophagy markers Atg3, Atg5, Beclin-1, p62, and LC3B-II in the mPFC (n = 4 per group). (g) Expression levels of Atg3, Atg5, Beclin-1, and LC3B-II in the mPFC of susceptible mice at day 0, day 1, day 3, and day 7 after CSDS (n = 4 per group). Data are presented as mean ± SEM. *P < 0.05, **P < 0.01, ***P < 0.001 vs. indicated group.
Fig. 6
Fig. 6
HMGB1 signaling in the mPFC is necessary and sufficient to promote stress susceptibility. (a) Experimental paradigm for assessing behavior following specific HMGB1 knockdown and chronic social defeat stress (CSDS). (b) Illustration of iAAV-HMGB1 micro-infusion into the mPFC region (scale bar, 1000 µm). (c) Knockdown efficiency of HMGB1 shRNA vectors (n = 6 per group). (dh) Body weight (d), sucrose preference (e), number of rearings, total distance traveled, and central distance traveled in the open field (f), time in the social interaction zone (g), and immobility time during tail suspension (h) in control and iAAV-HMGB1 groups before CSDS (n = 22 per group). (im) Corresponding measures after CSDS for iAAV-eGFP (n= 11), iAAV-eGFP + Stress(n= 9), iAAV-HMGB1 (n= 11), and iAAV-HMGB1 + Stress (n = 10) groups: body weight (i), sucrose preference (j), open field activity (k), social interaction (l), and immobility time during tail suspension (m). (n) Representative immunofluorescence images of the microglia marker Iba1 within the mPFC (scale bar, 50 µm) as well as three-dimensional (3D) construction (scale bar, 50 µm) and Sholl analysis of microglia in each group. (o-q) Iba1 fluorescence intensity (o), the density of microglia (p), and Sholl analysis for branch interactions as a function of distance from the soma (q) in each group (n = 3 per group). (r) Iba1 expression level in the mPFC (n = 3 per group). (s) Expression levels of Atg3, Atg5, p62, Beclin-1, and LC3B-II in the mPFC of each group (n = 3 per group). (t) Expression levels of HMGB1, RAGE, TLR4, PI3K p85, and p-Akt/Akt in the mPFC of each group (n = 3 per group). (u) Expression levels of p-STAT3/STAT3, p-IκBα/IκBα, and p-p65/p65 in the mPFC of each group (n = 3 per group). (vx) RT-qPCR analysis of IL-1β (v), IL-6 (w), and TNF-α (x) expression in the mPFC of each group (n = 4 per group). Data are presented as mean ± SEM. *P < 0.05, **P < 0.01, ***P < 0.001 vs. control group.
Fig. 7
Fig. 7
Specific knockdown of p65 in mPFC mitigated depressive-like behavior, microglial activation, and autophagy in HMGB1-overexpressing mice. (a) Experimental timeline. (b) Illustration of AAV-HMGB1 and iAAV-p65 micro-infusions into the mPFC region (scale bar, 1,000 µm). (cg) Mouse body weight (c), sucrose preference (d), number of rearings, total distance traveled, and central distance traveled in the open field (e), time in the social interaction zone (f), and immobility time during tail suspension (g) before subthreshold social defeat stress were measured in control (n= 9), AAV-HMGB1 (n= 10), iAAV-p65 (n= 9), and AAV-HMGB1 + iAAV-p65 (n= 10) groups. (hl) Corresponding results after subthreshold social defeat stress: body weight (h), sucrose preference (i), number of rearings, total distance traveled, and central distance traveled in the open field (j), time in the social interaction zone (k), and immobility time during tail suspension (l) (n= 9 per group). (m) Representative immunofluorescence images of Iba1 within the mPFC (scale bar, 50 µm) as well as three-dimensional (3D) construction (scale bar, 50 µm) and Sholl analysis of microglia in each group (n = 3 per group). (n, o) Iba1 fluorescence intensity (n) and density of microglia in the mPFC (o). (p) Sholl analysis for branch interactions as a function of distance from the soma. (q) Iba1 expression level in the mPFC (n = 3 per group). (r) Expression levels of Atg3, Atg5, p62, Beclin-1, and LC3B-II in the mPFC (n = 3 per group). (s) Expression levels of HMGB1, RAGE, TLR4, PI3K p85, and p-Akt/Akt in the mPFC (n = 3 per group). (t) Expression levels of p-STAT3/STAT3, p-IκBα/IκBα, and p-p65/p65 in the mPFC (n = 3 per group). (uw) mRNA levels of IL-1β (u), IL-6 (v), and TNF-α (w) in the mPFC (n = 4 per group). Data are presented as mean ± SEM. *P < 0.05, **P < 0.01, ***P < 0.001 vs. control group.
Fig. 8
Fig. 8
Effects of inhibiting HMGB1 on microglial activation, autophagy, and HMGB1/STAT3/p65 axis expression in cultured microglia after LPS. (a) Experimental timeline of microglia treatment. (b, c) BV2 (b) and HMC3 (c) cells were incubated with different concentrations of glycyrrhizic acid (GA) for 12 h plus LPS to a final concentration of 1 µg/ml for 6 h as indicated, and cell viability was measured using the CCK8 assay (n = 3 per group). (d, e) Example immunofluorescence images and relative fluorescence intensity analysis of Iba1 in BV2 (d) and HMC3 (e) cells treated as indicated (n = 3 per group; scale bar, 50 µm). (f, g) Expression levels of autophagy markers Atg3, Atg5, Beclin-1, p62, and LC3B-II in BV2 (f) and HMC3 (g) cells treated as indicated (n = 3 per group). (h, i) Expression levels of HMGB1, RAGE, TLR4, PI3K p85, and p-Akt/Akt in BV2 (h) and HMC3 (i) cells treated as indicated (n = 3 per group). (j, k) Expression levels of SOCS3, p-STAT3/STAT3, and p-p65/p65 in BV2 (j) and HMC3 (k) cells treated as indicated (n = 3 per group). (l, m) Expression levels of IL-1β, IL-6, and TNF-α mRNAs in BV2 (l) and HMC3 (m) cells treated as indicated (n = 4 per group). Data are presented as mean ± SEM. *P < 0.05, **P < 0.01, ***P < 0.001 vs. indicated group.
Fig. 9
Fig. 9
Inhibition of HMGB1/STAT3/p65 axis eliminates LPS-induced microglial activation and autophagy in culture. (a) Experimental timeline of microglial treatment. (b, c) Expression levels of Iba1 in BV2 cells (b) and HMC3 cells (c) treated as indicated (n = 4 per group). (d, e) Example immunofluorescence images (scale bar, 50 µm) and relative fluorescence intensity analysis of Iba1 in BV2 cells (d) and HMC3 cells (e) treated as indicated (n = 3 per group). (f, g) Example immunofluorescence images (scale bar, 20 µm) and quantitative results for mRFP-GFP-LC3 stably transfected BV2 cells (f) and HMC3 cells (g) treated as indicated. (h, i) Expression levels of autophagy markers Atg3, Atg5, Beclin-1, p62, and LC3B-II in BV2 cells (h) and HMC3 cells (i) treated as indicated (n = 4 per group). (j, k) Expression levels of HMGB1, RAGE, TLR4, PI3K p85, and p-Akt/Akt in BV2 cells (j) and HMC3 cells (k) treated as indicated (n = 4 per group). (l, m) Expression levels of p-STAT3/STAT3, p-IκBα/IκBα, and p-p65/p65 in BV2 cells (l) and HMC3 cells (m) treated as indicated (n = 4 per group). (n, o) Expression levels of IL-1β, IL-6, and TNF-α mRNAs in BV2 cells (n) and HMC3 cells (o) treated as indicated (n = 4 per group). Data are presented as mean ± SEM. *P < 0.05, **P < 0.01, ***P < 0.001 vs. control group.

References

    1. Smith K. Mental health: a world of depression. Nature. 2014;515(7526):181. doi: 10.1038/515180a. - DOI - PubMed
    1. Meier T.B., Drevets W.C., Wurfel B.E., Ford B.N., Morris H.M., Victor T.A., et al. Relationship between neurotoxic kynurenine metabolites and reductions in right medial prefrontal cortical thickness in major depressive disorder. Brain Behav Immun. 2016;53:39–48. doi: 10.1016/j.bbi.2015.11.003. - DOI - PMC - PubMed
    1. Belleau E.L., Treadway M.T., Pizzagalli D.A. The Impact of Stress and Major Depressive Disorder on Hippocampal and Medial Prefrontal Cortex Morphology. Biol Psychiatry. 2019;85(6):443–453. doi: 10.1016/j.biopsych.2018.09.031. - DOI - PMC - PubMed
    1. Seamans J.K., Lapish C.C., Durstewitz D. Comparing the prefrontal cortex of rats and primates: insights from electrophysiology. Neurotox Res. 2008;14(2–3):249–262. doi: 10.1007/BF03033814. - DOI - PubMed
    1. Mok SW-F, Wong VK-W, Lo H-H, de Seabra Rodrigues Dias IR, Leung EL-H, Law BY-K, et al. Natural products-based polypharmacological modulation of the peripheral immune system for the treatment of neuropsychiatric disorders. Pharmacol Therap 2020;208:107480. doi:10.1016/j.pharmthera.2020.107480. - PubMed

Publication types