. 2023 Jun 16;8(1):229.
doi: 10.1038/s41392-023-01437-0.

Albumosomes formed by cytoplasmic pre-folding albumin maintain mitochondrial homeostasis and inhibit nonalcoholic fatty liver disease

Affiliations

Albumosomes formed by cytoplasmic pre-folding albumin maintain mitochondrial homeostasis and inhibit nonalcoholic fatty liver disease

Boyuan Ma et al. Signal Transduct Target Ther. .

Abstract

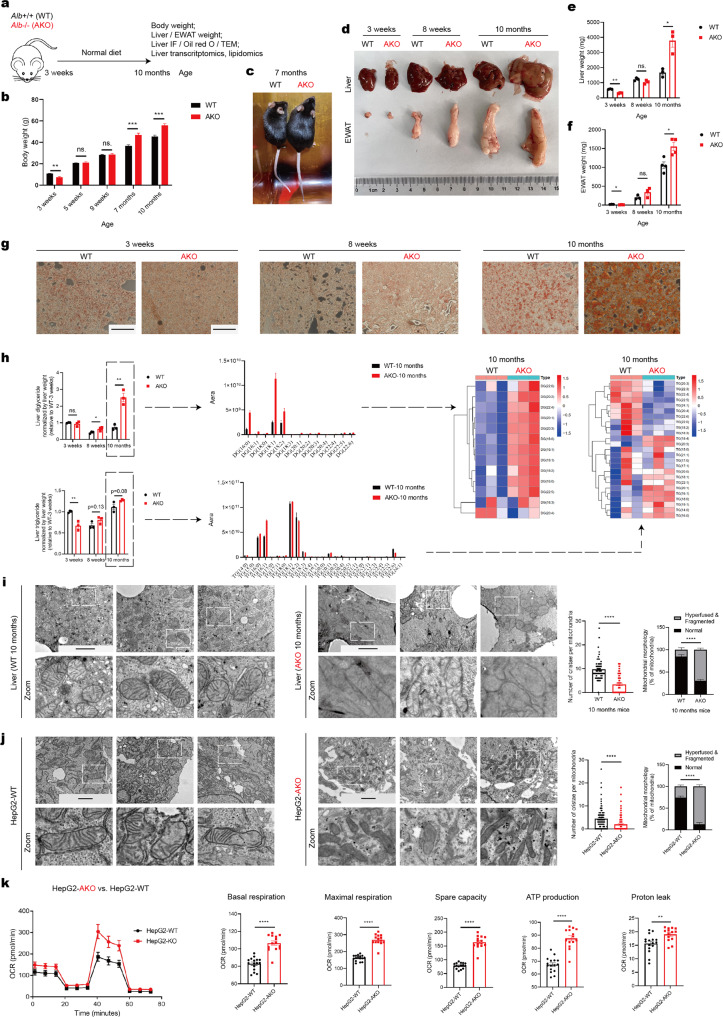
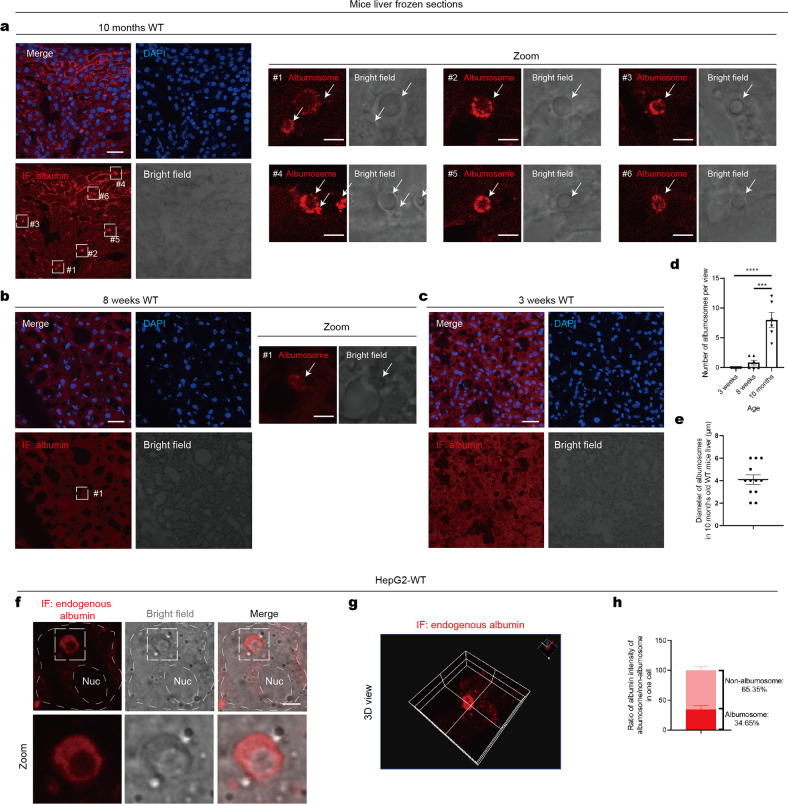
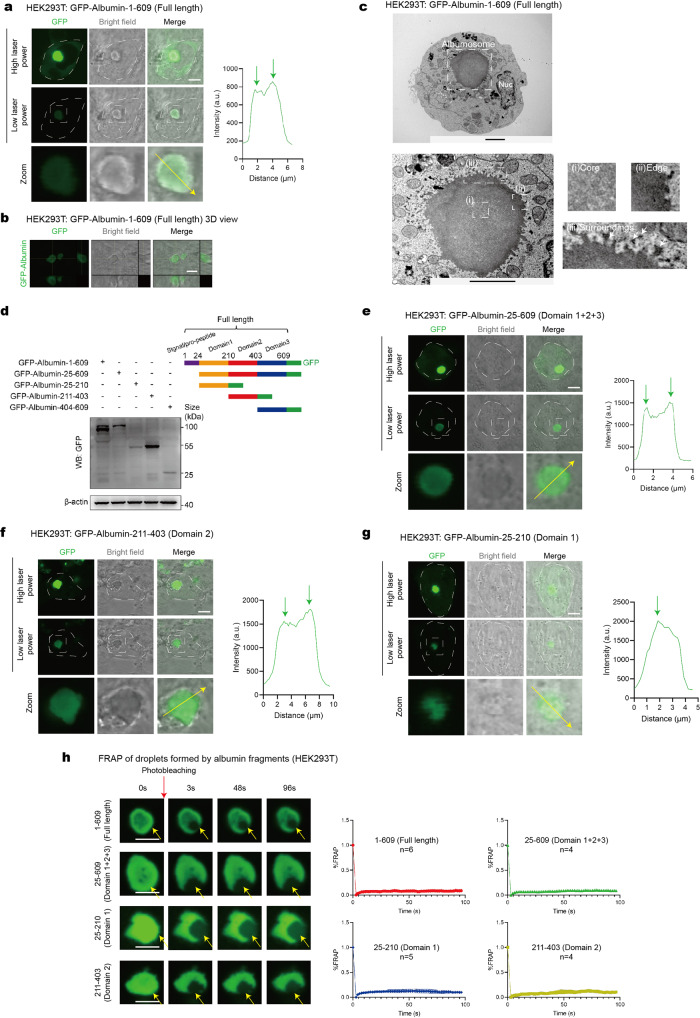
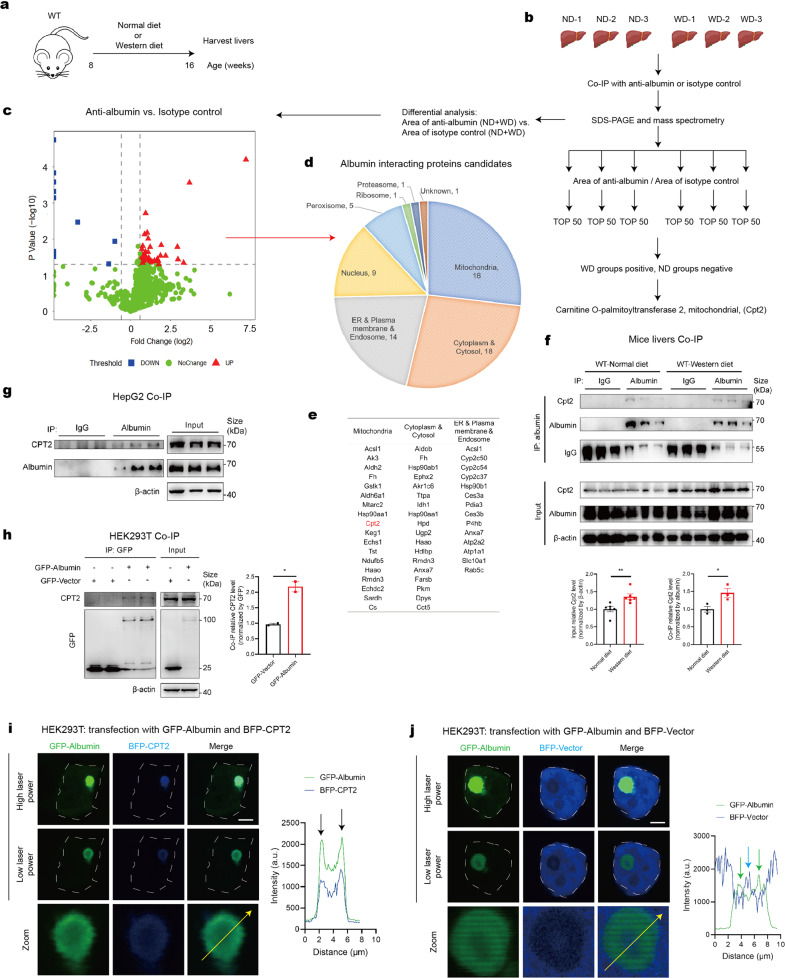
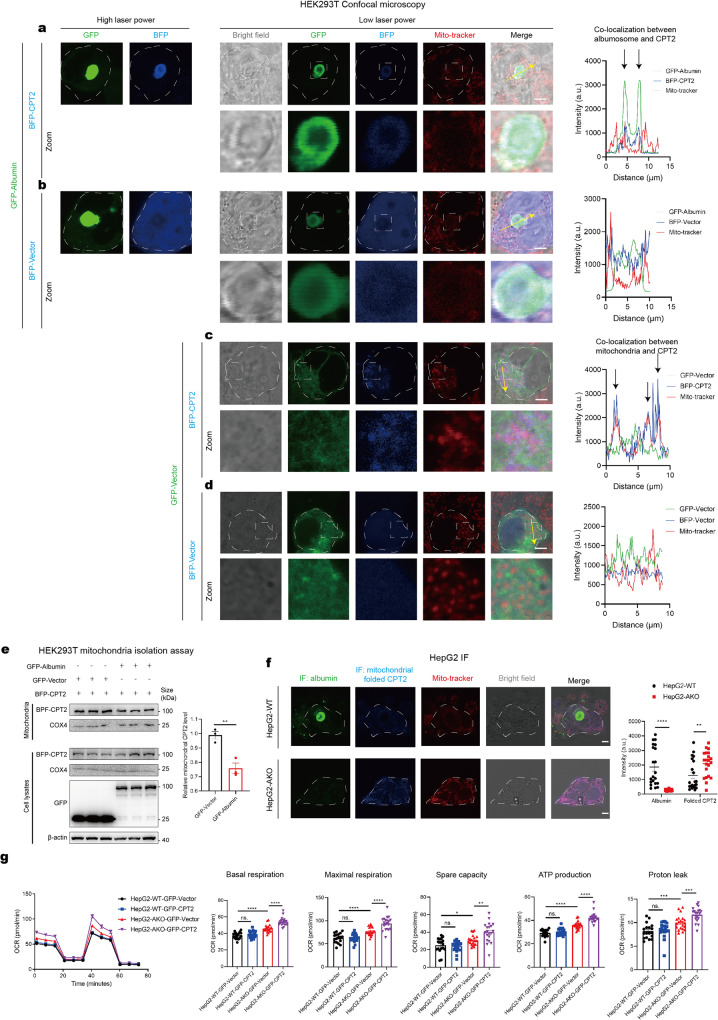
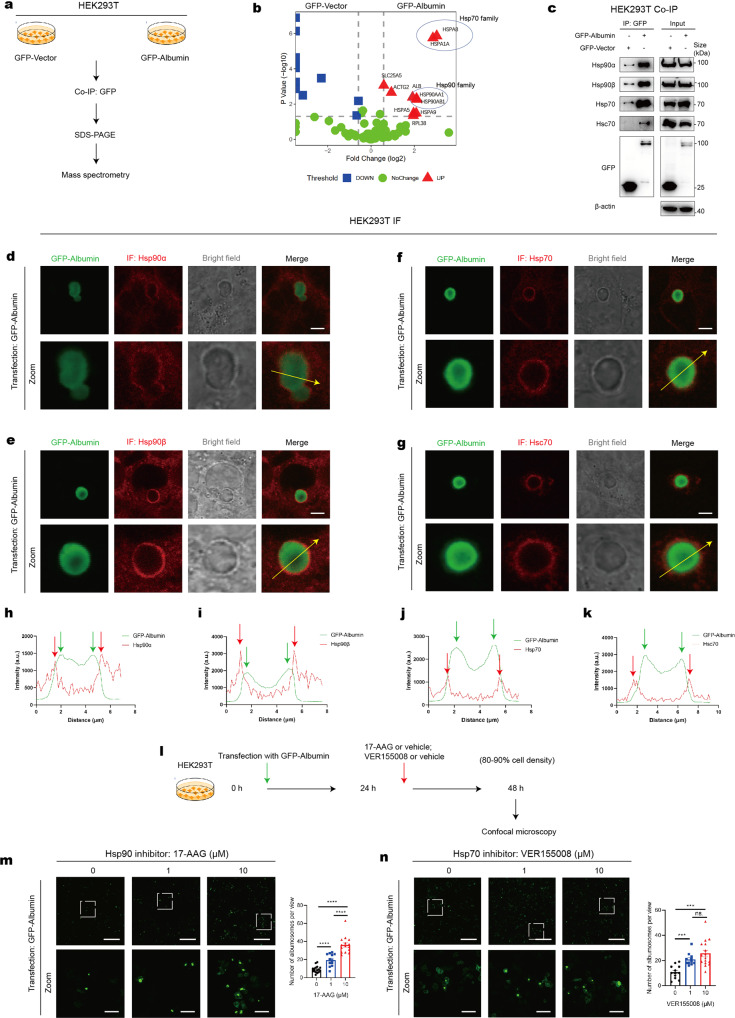
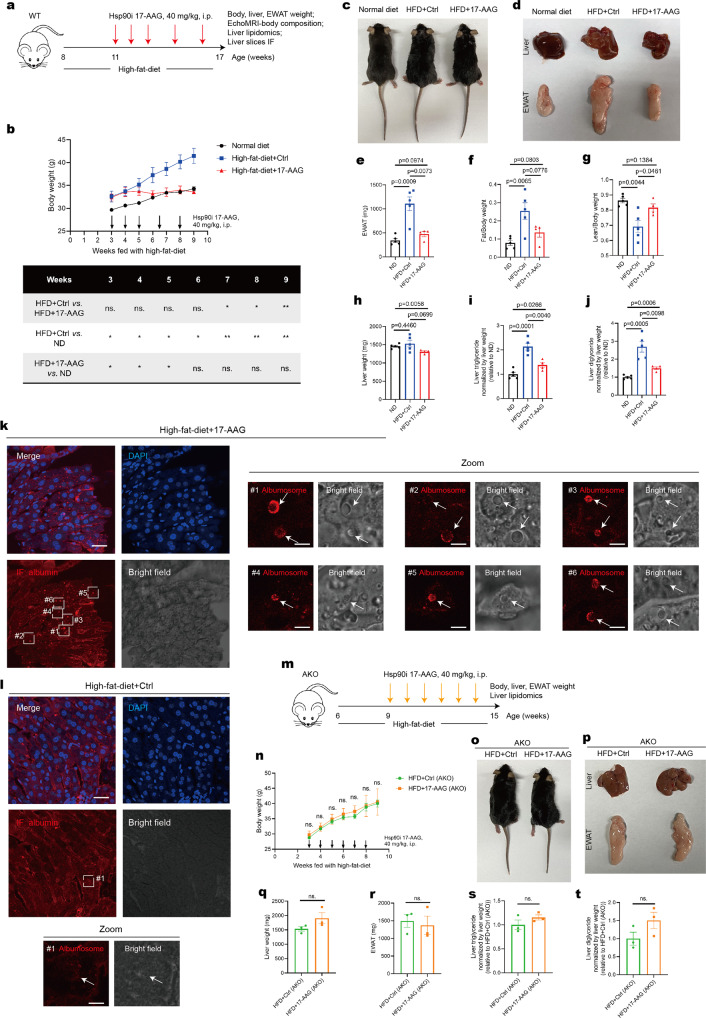
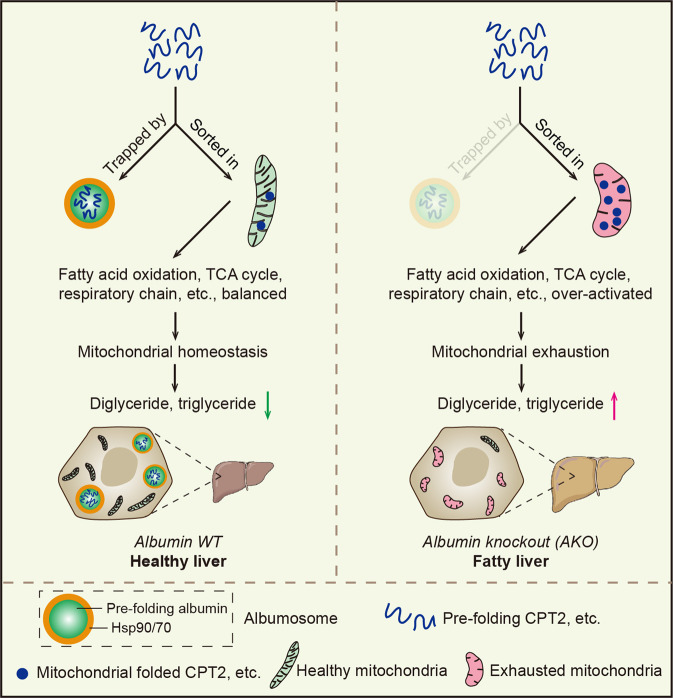
Hepatic mitochondrial dysfunction contributes to the progression of nonalcoholic fatty liver disease (NAFLD). However, the factors that maintain mitochondrial homeostasis, especially in hepatocytes, are largely unknown. Hepatocytes synthesize various high-level plasma proteins, among which albumin is most abundant. In this study, we found that pre-folding albumin in the cytoplasm is completely different from folded albumin in the serum. Mechanistically, endogenous pre-folding albumin undergoes phase transition in the cytoplasm to form a shell-like spherical structure, which we call the "albumosome". Albumosomes interact with and trap pre-folding carnitine palmitoyltransferase 2 (CPT2) in the cytoplasm. Albumosomes control the excessive sorting of CPT2 to the mitochondria under high-fat-diet-induced stress conditions; in this way, albumosomes maintain mitochondrial homeostasis from exhaustion. Physiologically, albumosomes accumulate in hepatocytes during murine aging and protect the livers of aged mice from mitochondrial damage and fat deposition. Morphologically, mature albumosomes have a mean diameter of 4μm and are surrounded by heat shock protein Hsp90 and Hsp70 family proteins, forming a larger shell. The Hsp90 inhibitor 17-AAG promotes hepatic albumosomal accumulation in vitro and in vivo, through which suppressing the progression of NAFLD in mice.


Conflict of interest statement

The authors declare no competing interests.

Figures

Fig. 1
Fig. 1
Albumin knockout promotes fatty liver disease progression, obesity, and mitochondrial damage during the aging process. a Experimental design model. WT and AKO mice were fed with the normal diet for 10 months (n = 3–10). b Body weights of WT and AKO mice at the age of 3 weeks, 5 weeks, 9 weeks, 7 months, and 10 months (n = 3–10). c Representative images of WT and AKO mice at the age of 7 months. d WT and AKO mice at the age of 3 weeks, 8 weeks, and 10 months were euthanized. Their livers and EWAT were obtained and weighed. Representative images of livers and EWAT (n = 3–4). e, f Weights of the livers (e) and EWAT (f) from the mice in d (n = 3–4). g Liver frozen sections from the mice at 3 weeks, 8 weeks, and 10 months of age were stained by Oil Red O. Representative images of the sections were shown (n = 3–4). Scale bars: 1 mm. h Lipid composition of the livers from WT and AKO mice at 3 weeks, 8 weeks, and 10 months of age were analyzed by lipidomics. Total amount of major lipids diglyceride and triglyceride of 10-month-old livers were shown. Fatty acids composition of diglyceride and triglyceride in 10-month-old livers were shown. Heatmap of the relative levels of all fatty acids in diglyceride and triglyceride of 10-month-old livers (n = 3). i TEM of liver sections of 10-month-old WT and AKO mice. The number of cristae per mitochondria and the hyperfused and fragmented level of mitochondria were analyzed. Representative images were shown. Scale bars: 2 μm. j TEM of HepG2-WT and HepG2-AKO. The number of cristae per mitochondria and the hyperfused and fragmented level of mitochondria were analyzed. Representative images were shown. Scale bars: 2 μm. k Seahorse mitochondrial respiratory assay of HepG2-WT and HepG2-AKO. Basal respiration, ATP production, proton leak, maximal respiration and spare capacity were analyzed. Data are analyzed by unpaired two-tailed Student’s t test and represented as mean ± SEM. ns. represents no significance. *p < 0.05, **p < 0.01, ***p < 0.001, ****p < 0.0001
Fig. 2
Fig. 2
Intracellular albumin forms the albumosome, a novel structure in hepatocytes. ae Liver sections of 10-month-old (a), 8-week-old (b), and 3-week-old (c) mice were used in IF. Representative images of maximum brightness projection of multilayers based on z-axis from confocal microscopy. Red: albumin; Blue: nucleus. Zoomed images: monolayer confocal images of regions #1-#6 in a and #1 in b. Scale bars: 30 μm in initial images and 5 μm in zoomed images. The numbers of albumosomes per view were measured (d). Diameters of albumosomes in 10-month-old WT mice liver sections were measured (e) (n = 4–6). fh IF of endogenous albumin in HepG2-WT. Representative images were shown. The ratio of albumin intensity of albumosome/non-albumosome in one cell was measured (h) (n = 3). Scale bar: 5 μm. Data are analyzed by unpaired two-tailed Student’s t test and represented as mean ± SEM. ***p < 0.001, ****p < 0.0001
Fig. 3
Fig. 3
Pre-folding albumin undergoes phase transition to form albumosomes. a, b GFP-Albumin-1–609 (Full length) was transfected in HEK293T. Albumosomes were observed and the intensity along the yellow arrow was measured (a). 3D images were shown (b). Representative images were shown. Scale bars: 5 μm. c TEM of the albumosome in HEK293T. GFP-Albumin was transfected into HEK293T cultured in a gridded glass bottom dish for 48 h and was then fixed. Combined with light microscopy and TEM, the specific location of cells with albumosomes was obtained and the ultrastructure of albumosomes was observed. (i) Representative image of the core of the albumosome. (ii) Representative image of the edge of the albumosome. (iii) Representative image of the surroundings of the albumosome. Scale bars: 2 μm. d Mapping of different regions of albumin. Western blot results of different fragments of albumin in HEK293T. eg Confocal microscopy of HEK293T transfected with GFP-Albumin-25–609 (Domain 1 + 2 + 3) (e), GFP-Albumin-211–403 (Domain 2) (f), and GFP-Albumin-25–210 (Domain 1) (g). Representative images were shown. Scale bars: 5 μm. h FRAP of droplets formed by each albumin fragment. Representative images were shown. The relative recovery intensity rates were analyzed (n = 4–6). Scale bars: 5 μm. Data are analyzed by unpaired two-tailed Student’s t test and represented as mean ± SEM
Fig. 4
Fig. 4
Albumosomes interact with CPT2 in the cytoplasm. a Experimental design model. WT mice were fed by the normal or Western diet for 8 weeks before their livers were harvested (n = 3). b Screening flow of the results of Co-IP and MS assays (n = 3). c Volcano plots of proteins in the MS result, anti-albumin vs. isotype control. The proteins that have more than 50% difference between the two groups with p < 0.05 were considered to be potential candidates. d, e Proteins that meet the criteria were classified by cellular localization. f Western blot validation of the interaction between albumin and Cpt2 in livers. Representative images were shown. Relative intensity was measured from western blot results. g Western blot results that show the interaction between endogenous albumin and endogenous CPT2 in HepG2. Representative images were shown (n = 3). h Western blot results that show the interaction between transfected albumin and endogenous CPT2 in HEK293T. Representative images were shown. Relative intensity was measured from western blot results (n = 2). i, j Confocal microscopy of HEK293T transfected with GFP-Albumin and BFP-CPT2 (i) or BFP-Vector (j). Representative images were shown. The intensities along the yellow arrows were measured. Scale bars: 5 μm. Data are analyzed by unpaired two-tailed Student’s t test and represented as mean ± SEM. *p < 0.05, **p < 0.01
Fig. 5
Fig. 5
Albumosomes regulate CPT2 sorting to mitochondria to maintain mitochondrial homeostasis. ad Confocal microscopy of HEK293T transfected with GFP-Albumin and BFP-CPT2 (a), GFP-Albumin and BFP-Vector (b), GFP-Vector and BFP-CPT2 (c), GFP-Vector and BFP-Vector (d). Mito-tracker was used for mitochondria staining. Representative images were shown. The intensities along the yellow arrows were measured. Scale bars: 5 μm. e HEK293T mitochondria isolation assay. Mitochondria was isolated from HEK293T transfected with GFP-Albumin and BFP-CPT2 or GFP-Vector and BFP-CPT2. Relative intensity was measured from Western blot results (n = 3). f IF of albumin and mitochondrial folded CPT2 of HepG2-WT and HepG2-AKO. Mito-tracker was used for mitochondria staining. Representative images were shown. Intensities of albumin and folded CPT2 were measured. Scale bars: 5 μm. g Seahorse mitochondrial respiration assay of HepG2-WT and HepG2-AKO overexpressed with GFP-Vector or GFP-CPT2, respectively. Basal respiration, maximal respiration, spare capacity, ATP production, and proton leak were analyzed. Data are analyzed by unpaired two-tailed Student’s t test and represented as mean ± SEM. ns. represents no significance. *p < 0.05, **p < 0.01, ***p < 0.001, ****p < 0.0001
Fig. 6
Fig. 6
Hsp90 and Hsp70 family proteins surround albumosomes and inhibit albumosomal accumulation in an ATPase-dependent manner. a Experimental design model. Co-IP and MS in HEK293T transfected with GFP-Albumin or GFP-Vector (n = 3). b Volcano plots of proteins in MS, GFP-Albumin vs. GFP-Vector. The proteins which have more than 50% difference between the two groups with p < 0.05 were considered to be potential candidates. c Western blot validation of the interaction between GFP-Albumin and Hsp90 and Hsp70 family proteins. dg IF of Hsp90α (d), Hsp90β (e), Hsp70 (f), and Hsc70 (g) in HEK293T around the albumosomes. Representative images were shown. Scale bars: 5 μm. hk Intensity curves along the yellow arrows, (h) for (d), (i) for (e), (j) for (f), and (k) for (g). l Experimental design model. HEK293T transfected with GFP-Albumin was treated with Hsp90i (17-AAG) or Hsp70i (VER155008). m, n Microscopy of albumosomes under treatments of 17-AAG (m) and VER155008 (n). Representative images were shown. Number of albumosomes per view were measured. Scale bars: 300 μm in initial images and 50 μm in zoomed images. Data are analyzed by unpaired two-tailed Student’s t test and represented as mean ± SEM. ns. represents no significance. ***p < 0.001, ****p < 0.0001
Fig. 7
Fig. 7
Inhibition of Hsp90 suppresses NAFLD progression by promoting albumosomal accumulation. a Experimental design model. WT mice fed with HFD from the age of 8 weeks were injected by 17-AAG at the 3rd, 4th, 5th, 6.5th, and 8th weeks of the HFD feeding process. The control group was injected by the solvent. Body composition was measured at the 9th week, after which mice were sacrificed with tissues harvest (n = 4–5). b Body weight change of the mice in HFD + 17-AAG, HFD + Ctrl, and ND groups (n = 4–5). c Representative images of the mice from HFD + 17-AAG, HFD + Ctrl, and ND groups at the 9th week of HFD process. d Representative images of the livers and EWAT from HFD + 17-AAG, HFD + Ctrl, and ND groups at the 9th week of HFD process. eg EWAT weights of HFD + 17-AAG, HFD + Ctrl, and ND groups (e). The ratio of fat (f) and lean (g) compared to body weight (n = 4–5). hj Liver weights of HFD + 17-AAG, HFD + Ctrl, and ND groups (h). Relative liver triglyceride (i) and diglyceride (j) content normalized by liver weight (n = 4–5). k, l Liver sections of HFD + 17-AAG (k) and HFD + Ctrl (l) were used in IF. Representative images of maximum brightness projection of multilayers based on z-axis from confocal microscopy. Scale bars: 30 μm. Red: Albumin; Blue: nucleus. Zoomed images: monolayer confocal images of regions #1-#6 in k and #1 in l. Scale bars: 5 μm. m Experimental design model. AKO mice fed with HFD from the age of 6 weeks were injected by 17-AAG at the 3rd, 4th, 5th, 6th, 7th, and 8th weeks of the HFD feeding process. The control group was injected by the solvent. Mice were sacrificed with tissues harvest at the 9th week (n = 3–4). n Body weight change of the HFD + 17-AAG (AKO) and HFD + Ctrl (AKO) (n = 3–4). o Representative images of the HFD + 17-AAG (AKO) and HFD + Ctrl (AKO) at the 9th week of HFD process. p Representative images of the livers and EWAT in HFD + 17-AAG (AKO) and HFD + Ctrl (AKO) at the 9th week of HFD process. q, r Weights of liver (q) and EWAT (r) of the two groups, HFD + 17-AAG (AKO) and HFD + Ctrl (AKO) (n = 3). s, t Relative liver triglyceride (s) and diglyceride (t) content normalized by liver weight of the two groups, HFD + 17-AAG (AKO) and HFD + Ctrl (AKO) (n = 3). Data are analyzed by unpaired two-tailed Student’s t test and represented as mean ± SEM. ns. represents no significance. *p < 0.05, **p < 0.01
Fig. 8
Fig. 8
Graphic summary of this study. Stresses from aging or HFD stimulate the expression of mitochondrial proteins related with fatty acid β-oxidation and synthesis, TCA cycle, and respiratory chain, etc. In WT livers, excessive pre-folding CPT2 could be trapped by albumosomes in the cytoplasm, relieving the stress of mitochondria and maintaining lipid metabolic homeostasis, which form a virtuous cycle and inhibit fat deposition. However, in AKO livers, such stress-induced excessive pre-folding mitochondrial proteins enter mitochondria more freely lacking the capture by albumosomes, and stimulate mitochondrial overloaded respiration. Continuously, prolonged stresses aggravate mitochondrial exhaustion and result in lipid metabolic disorders, which lead to a vicious cycle and trigger fat deposition

Similar articles

Cited by

References

    1. Loomba R, Friedman SL, Shulman GI. Mechanisms and disease consequences of nonalcoholic fatty liver disease. Cell. 2021;184:2537–2564. doi: 10.1016/j.cell.2021.04.015. - DOI - PubMed
    1. Huang DQ, El-Serag HB, Loomba R. Global epidemiology of NAFLD-related HCC: trends, predictions, risk factors and prevention. Nat. Rev. Gastroenterol. Hepatol. 2021;18:223–238. doi: 10.1038/s41575-020-00381-6. - DOI - PMC - PubMed
    1. Foerster F, Gairing SJ, Muller L, Galle PR. NAFLD-driven HCC: safety and efficacy of current and emerging treatment options. J. Hepatol. 2022;76:446–457. doi: 10.1016/j.jhep.2021.09.007. - DOI - PubMed
    1. Byrne CD, Targher G. NAFLD: a multisystem disease. J. Hepatol. 2015;62:S47–S64. doi: 10.1016/j.jhep.2014.12.012. - DOI - PubMed
    1. Perez-Carreras M, et al. Defective hepatic mitochondrial respiratory chain in patients with nonalcoholic steatohepatitis. Hepatology. 2003;38:999–1007. doi: 10.1002/hep.1840380426. - DOI - PubMed