. 2023 Jun 15;14(1):3561.
doi: 10.1038/s41467-023-39085-1.

A convolutional neural network STIFMap reveals associations between stromal stiffness and EMT in breast cancer

Affiliations

A convolutional neural network STIFMap reveals associations between stromal stiffness and EMT in breast cancer

Connor Stashko et al. Nat Commun. .

Abstract

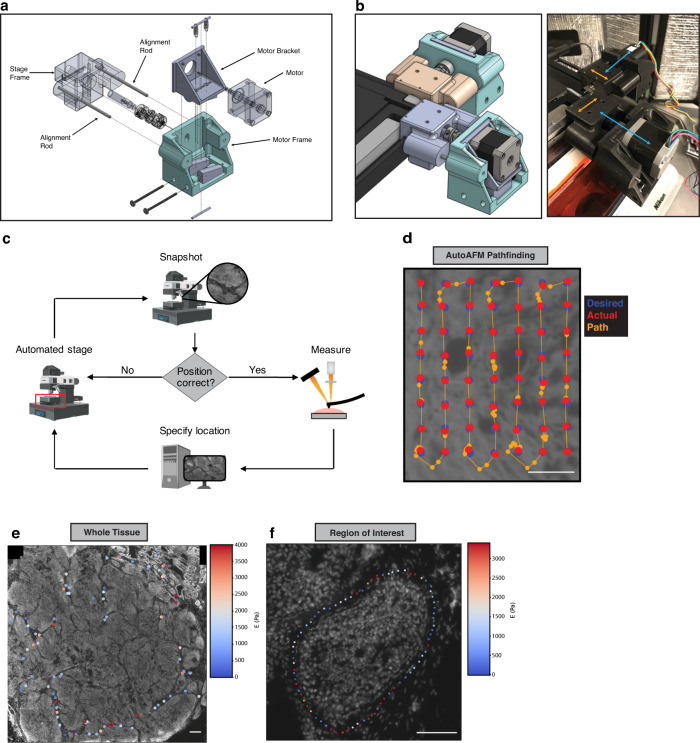
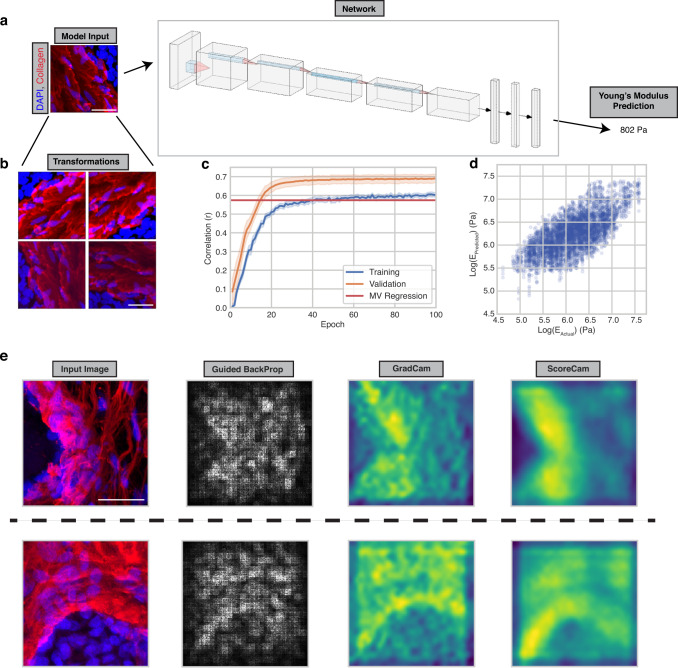
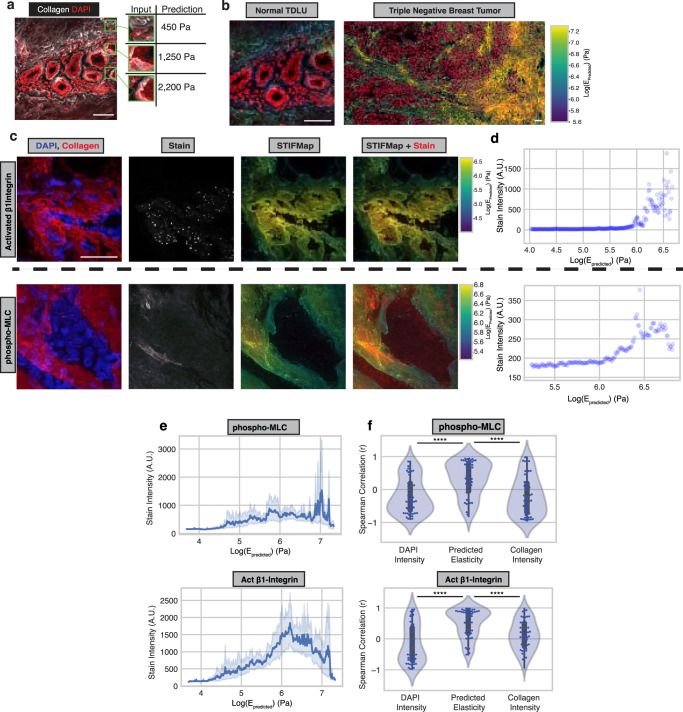
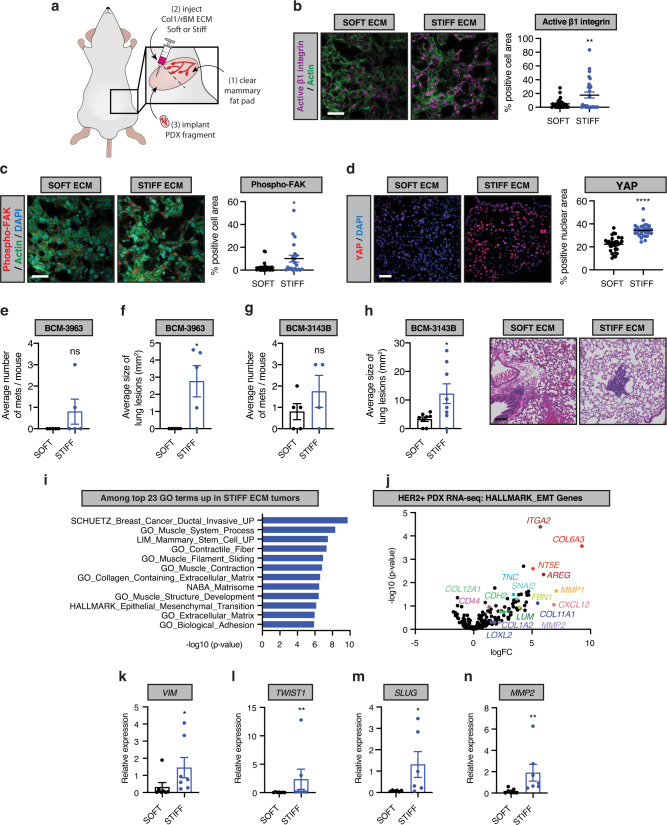
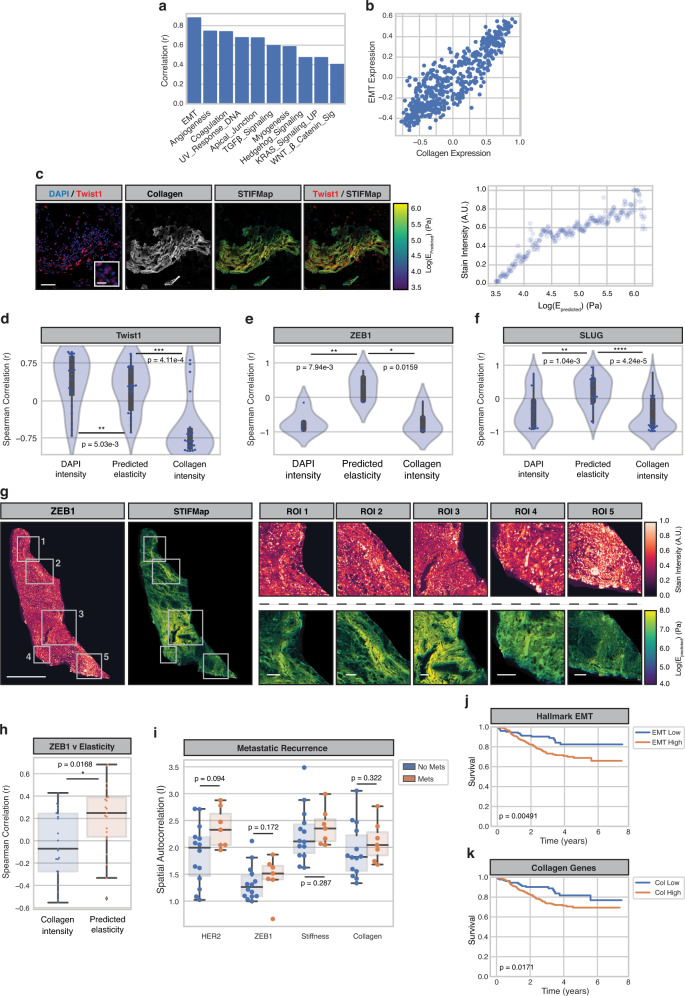
Intratumor heterogeneity associates with poor patient outcome. Stromal stiffening also accompanies cancer. Whether cancers demonstrate stiffness heterogeneity, and if this is linked to tumor cell heterogeneity remains unclear. We developed a method to measure the stiffness heterogeneity in human breast tumors that quantifies the stromal stiffness each cell experiences and permits visual registration with biomarkers of tumor progression. We present Spatially Transformed Inferential Force Map (STIFMap) which exploits computer vision to precisely automate atomic force microscopy (AFM) indentation combined with a trained convolutional neural network to predict stromal elasticity with micron-resolution using collagen morphological features and ground truth AFM data. We registered high-elasticity regions within human breast tumors colocalizing with markers of mechanical activation and an epithelial-to-mesenchymal transition (EMT). The findings highlight the utility of STIFMap to assess mechanical heterogeneity of human tumors across length scales from single cells to whole tissues and implicates stromal stiffness in tumor cell heterogeneity.


Conflict of interest statement

The authors declare no competing interests.

Figures

Fig. 1
Fig. 1. Overview of automated AFM acquisition system.
a Technical drawing of motor mount for interfacing servo motors with AFM translation knobs. b Assembled motor mounts. The Stage Frame slides along the edge of the stage (orange arrows) while the Motor Frame slides along the Alignment Rods, towards and away from the Stage Frame as the knobs turn (blue arrows). c Schematic of AutoAFM feedback system. d Example of AutoAFM feedback with desired AFM sampling positions (blue), actual AFM positions (red), and AFM path of movement and positions outside of the desired positions (orange). Representative images of AutoAFM collecting AFM measurements over a whole tissue (e) and a region of interest (f) in a breast tumor section. 200 experiments were conducted obtaining reproducible results. Scale bar, 100 μm.
Fig. 2
Fig. 2. A convolutional neural network predicts the Young’s Modulus of tissue.
a Example input-output relationships to the network with diagram depicting connectivity of different network layers. b Example image transformations to increase the size of the network training dataset. c Correlation between model predictions and actual Young’s Modulus values for the training (blue line) and validation (orange line) datasets over the course of training. Error bars indicate 95% confidence intervals across 25 trained models. d Dot plot of actual versus predicted Young’s Modulus values for the validation datasets across 25 trained models. n = 4768, Pearson r = 0.687. e Saliency maps reflecting image regions that influenced model predictions. 50 Saliency maps were generated obtaining reproducible results. Scale bar, 20 μm. Source data are provided as a Source Data file.
Fig. 3
Fig. 3. STIFMap predict high elasticity regions within tissues.
a Deconstruction of a CNA- and DAPI-stained image into squares of ~50 × 50 μm. The Young’s Modulus of each square is predicted. b Elasticity predictions are aggregated and overlaid over collagen to produce the overall STIFMap for both a normal TDLU and triple negative breast cancer. c Representative images of immunofluorescent staining for pMLC (top) and activated β1 integrin (bottom) (60 total FOVs from 10 patient samples were imaged). d Scatterplots of STIFMap intensity vs stain intensity for each pixel shown in c indicating the 99th percentile of stain intensity for each STIFMap percentile. e STIFMap percentiles versus the 99th percentile of stain intensity for all acquired fields of view (FOVs). Error bars indicate a 95% confidence interval. n = 60 FOVs from 10 different patient tumor samples. Median Spearman r values activated β1 integrin = 0.696, pMLC = 0.364. f Violin plots of the Spearman correlation for each FOV comparing the 99th percentile of staining intensity versus percentiles of DAPI, predicted elasticity, or collagen stain intensity. Internal gray bars indicate a Box-plot. The box plots indicate the median, and extreme values. n = 60 FOVs from 10 different patient tumor samples. p(Elasticity vs DAPI; p-MLC) = 2.60E−6. p(Elasticity vs Collagen; p-MLC) = 5.28E−6. p(Elasticity vs DAPI; beta1-integrin) = 2.17E−8. p(Elasticity vs Collagen; beta1-integrin) = 2.36E−5. Scale bar, 50 μm. Statistical analyses were performed using two-sided Mann–Whitney U test, ****P < 10−5. Source data are provided as a Source Data file.
Fig. 4
Fig. 4. Matrix elasticity associates with EMT in PDX models of HER2+ breast cancer.
a Schematic showing the strategy for implantation of HER2-positive patient-derived xenograft (PDX) breast cancer tissues. Representative images of immunofluorescent staining of active β1 integrin (b), phospho-FAK (c) and YAP (d) in SOFT or STIFF HER2-positive PDX tumors (left). Scale bar, 50 μm. Quantification of average active β1 integrin (b), phospho-FAK (c) and YAP (d) positive cell or nuclear area for all HER2-positive PDX tumors (right). SOFT; n = 6, STIFF; n = 6. e Average number of lung metastases for mice bearing BCM-3963 PDX tumors in SOFT and STIFF ECM stroma as determined by histological analysis. SOFT; n = 10, STIFF; n = 10. f Average size of the metastatic lesions corresponding to the analysis in e. g Analysis as in e for mice bearing BCM-3143B PDX tumors. SOFT; n = 10, STIFF; n = 10. h Analysis as in f for metastatic lesions corresponding to the analysis in g (left). Images of lung metastases for mice bearing BCM-3143B PDX tumors in SOFT and STIFF ECM stroma (right). Scale bar, 100 μm. i Gene ontology (GO) terms from among the top 23 most significantly upregulated, using RNAseq data derived from all HER2-positive PDX tumors generated in SOFT (n = 9) and STIFF (n = 9) ECM stroma (n = 3 for each PDX and condition). j Volcano plot of p-value (-log10) vs. log fold change (logFC) for gene expression from the HALLMARK_epithelial-to-mesenchymal transition gene set for RNAseq data of HER2-positive PDX tumors developed in SOFT and STIFF ECM stroma. kn qRT-PCR arrays designed to examine EMT related gene expression to analyze RNA isolated from PDX tumors in SOFT and STIFF ECM stroma. SOFT; n = 7, STIFF; n = 7. Bar plots for the average relative expression of the indicated mesenchymal genes. All graphs are presented as mean +/− S.E.M. Statistical tests used were two-sided Mann–Whitney U test (c, f, kn) and two-sided unpaired t-test (b, d, e, g, h), *P < 0.03, **P < 0.002, ***P < 0.0002, ****P < 0.0001, ns non-significant. Source data are provided as a Source Data file.
Fig. 5
Fig. 5. EMT markers spatially overlap with high tension matrix and associate with poor survival in patient tumors.
a Pearson correlation between GSVA scores for collagen genes and hallmark pathway genes in the Nuvera dataset. b Scatterplot of GSVA scores for collagen genes and hallmark EMT genes. Each point represents one patient. N = 508 patients. Pearson r = 0.880. c FOVs for Twist1 staining within FFPE tumors (left). Scale bar, 50 μm. Inset scale bar, 10 μm. Scatterplots of STIFMap intensity vs stain intensity for each pixel shown in (i) indicating the 99th percentile of stain intensity for each STIFMap percentile (right). N = 22 imaged FOVs. df Violin plots of the Spearman correlation for each FOV comparing the 99th percentile of staining intensity versus percentiles of DAPI, predicted elasticity, or collagen stain intensity. Internal gray bars indicate a box-plot. N = 22 Twist1 FOVs, n = 5 ZEB1 FOVs, and n = 25 SLUG FOVs. g Representative whole slide image (WSI) and regions of interest (ROIs) of ZEB1 stain with STIFMap in HER2+ breast cancer cohort. Scale bar (WSI), 1 mm. Scale bar (ROIs), 100 μm. N = 21 patient tumor samples. h Spearman correlation for each whole tissue section comparing the 99th percentile of staining intensity versus percentiles of predicted elasticity and collagen stain intensity. N = 21 patient tumor samples. i Box and whiskers plots to show the association between metastatic recurrence and spatial autocorrelation (Moran’s I) for tissue markers and STIFMaps in the HER2+ breast cancer cohort (n = 84 breast tumors). Kaplan–Meier curves comparing survival between the upper and lower quartiles of EMT (j) and collagen (k) GSVA scores within the Nuvera cohort. N = 127 patients in each group. Boxes denote 25th to 75th percentile with median line. Whiskers mark the minima and the maxima excluding outliers. Statistical analyses were performed using two-sided Mann–Whitney U test (df, h, i) and logrank test (j, k), *P < 0.05, **P < 0.01, ***P < 0.001 ****P < 10−5. Source data are provided as a Source Data file.

Similar articles

Cited by

References

    1. Li Z, Seehawer M, Polyak K. Untangling the web of intratumour heterogeneity. Nat. Cell Biol. 2022;24:1192–1201. doi: 10.1038/s41556-022-00969-x. - DOI - PubMed
    1. Turashvili G, Brogi E. Tumor heterogeneity in breast cancer. Front. Med. 2017;4:227. doi: 10.3389/fmed.2017.00227. - DOI - PMC - PubMed
    1. Biffi G, Tuveson DA. Diversity and biology of cancer-associated fibroblasts. Physiol. Rev. 2021;101:147–176. doi: 10.1152/physrev.00048.2019. - DOI - PMC - PubMed
    1. Azizi E, et al. Single-cell map of diverse immune phenotypes in the breast tumor microenvironment. Cell. 2018;174:1293–1308.e1236. doi: 10.1016/j.cell.2018.05.060. - DOI - PMC - PubMed
    1. Caswell DR, Swanton C. The role of tumour heterogeneity and clonal cooperativity in metastasis, immune evasion and clinical outcome. BMC Med. 2017;15:133. doi: 10.1186/s12916-017-0900-y. - DOI - PMC - PubMed

Publication types