. 2023 Jun 15;12(1):147.
doi: 10.1038/s41377-023-01191-6.

Mid-infrared chemical imaging of intracellular tau fibrils using fluorescence-guided computational photothermal microscopy

Affiliations

Mid-infrared chemical imaging of intracellular tau fibrils using fluorescence-guided computational photothermal microscopy

Jian Zhao et al. Light Sci Appl. .

Abstract

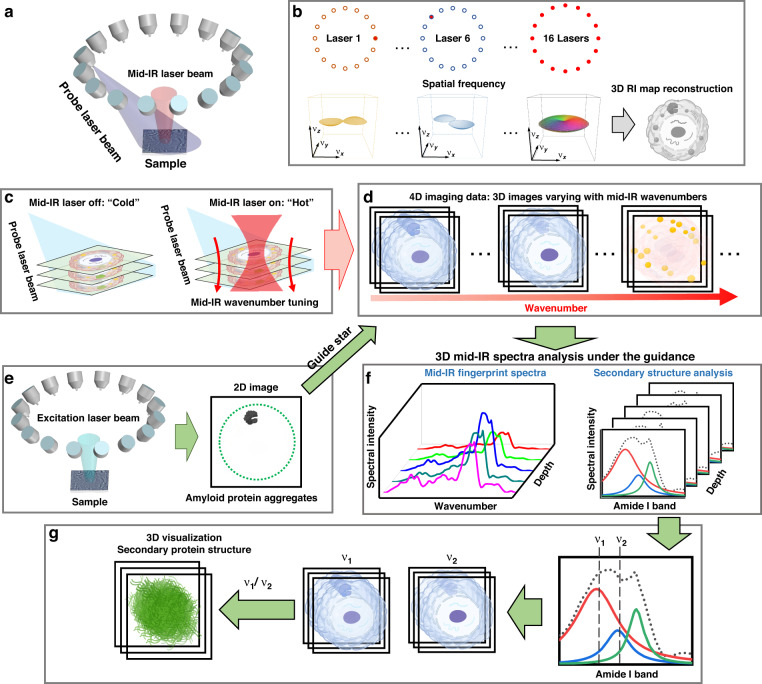
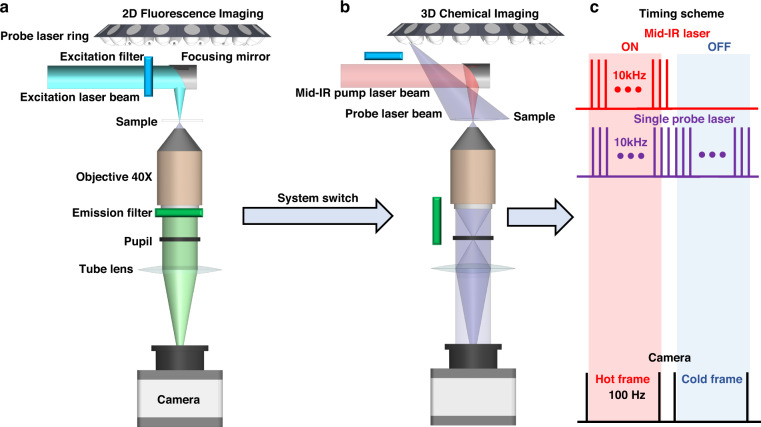
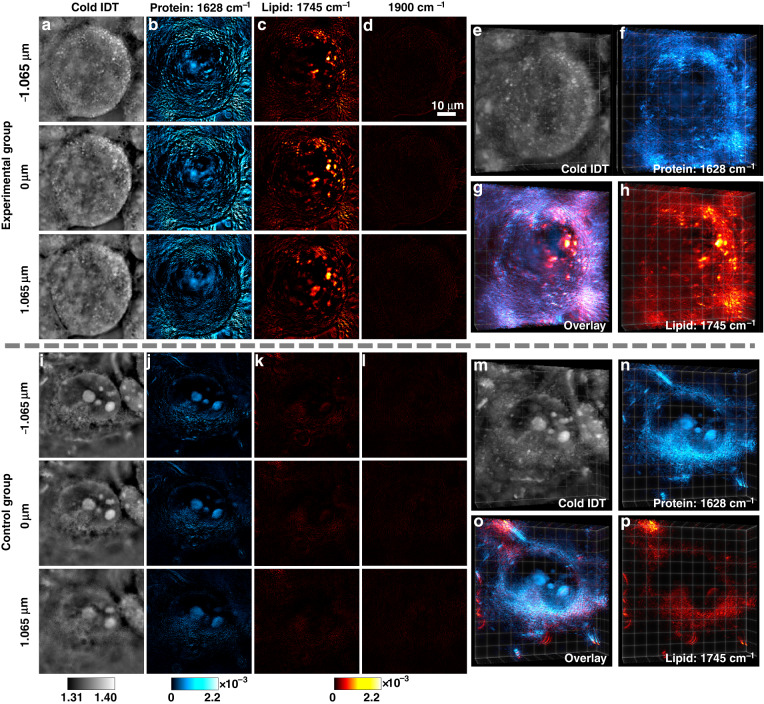
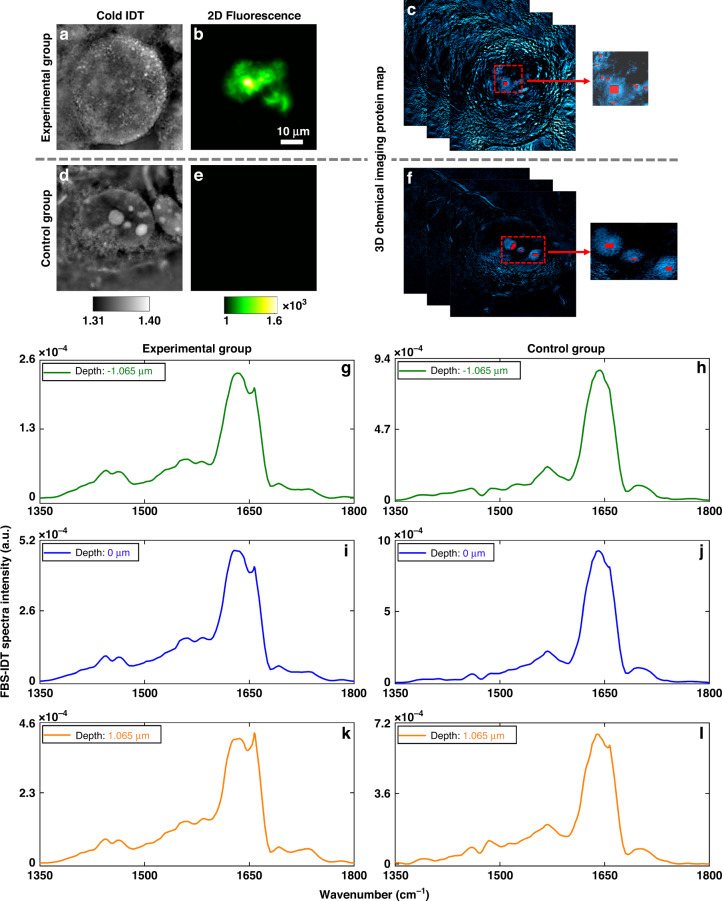
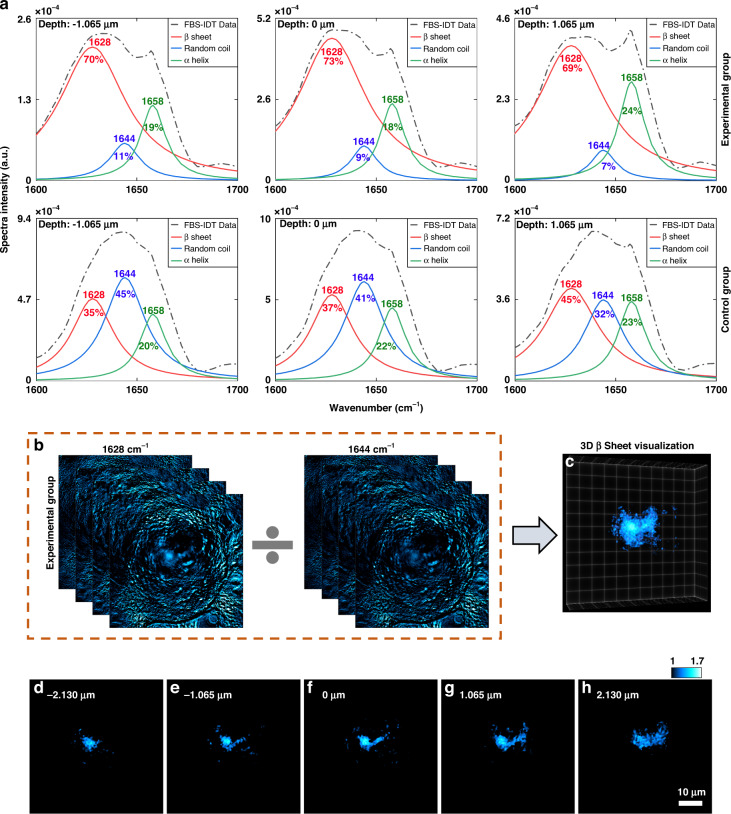
Amyloid proteins are associated with a broad spectrum of neurodegenerative diseases. However, it remains a grand challenge to extract molecular structure information from intracellular amyloid proteins in their native cellular environment. To address this challenge, we developed a computational chemical microscope integrating 3D mid-infrared photothermal imaging with fluorescence imaging, termed Fluorescence-guided Bond-Selective Intensity Diffraction Tomography (FBS-IDT). Based on a low-cost and simple optical design, FBS-IDT enables chemical-specific volumetric imaging and 3D site-specific mid-IR fingerprint spectroscopic analysis of tau fibrils, an important type of amyloid protein aggregates, in their intracellular environment. Label-free volumetric chemical imaging of human cells with/without seeded tau fibrils is demonstrated to show the potential correlation between lipid accumulation and tau aggregate formation. Depth-resolved mid-infrared fingerprint spectroscopy is performed to reveal the protein secondary structure of the intracellular tau fibrils. 3D visualization of the β-sheet for tau fibril structure is achieved.


Conflict of interest statement

The authors declare no competing interests.

Figures

Fig. 1
Fig. 1. FBS-IDT principle and workflow.
a Pump-probe 3D chemical imaging scheme. Each oblique pulsed probe beam (~450 nm) from a ring laser array illuminates the sample sequentially. A loosely focused pulsed mid-IR laser pump beam heats the sample periodically. b 3D RI map reconstruction scheme. Intensity imaging data from each probe beam illumination are mapped into the frequency domain. 3D RI map can be reconstructed by the inverse Fourier transform of the synthesized frequency domain information from all 16 probe beam detections. c “Cold” state: imaging without mid-IR pump beam illumination; “Hot” state: imaging with mid-IR pump beam illumination. d 4D hyperspectral chemical imaging. 3D chemical maps under different mid-IR wavenumbers are obtained in two steps: (1) subtracting “Hot” 3D RI maps from the “Cold” 3D RI maps under a particular wavenumber; (2) tuning the wavenumber to obtain 3D maps for different chemical compounds of interest. e Single-photon 2D fluorescence intensity imaging. To obtain the 2D guide star, both probe and pump beams are turned off while an excitation laser beam illuminates the sample. The 2D fluorescence images highlight the boundary of the amyloid protein aggregates. f Depth-resolved mid-IR fingerprint spectra generation and related protein secondary structure spectroscopic analysis. The depth-resolved mid-IR spectra are extracted from the 4D hyperspectral chemical imaging data under the guidance of the 2D image in (e). Secondary structures are analyzed by the deconvolution of the mid-IR amide I band. g 3D visualization of protein secondary structure for the amyloid protein aggregates. Based on the spectroscopic analysis results in (f), spectral positions for specific secondary protein structures are selected. 3D visualization of the secondary protein structures is obtained by extracting the mid-IR spectral ratio map between two 3D chemical images. Cell and protein aggregate icons in (be) and (g) are created and adapted from ref.
Fig. 2
Fig. 2. FBS-IDT instrumentation.
FBS-IDT is based on a widefield transmission microscope consisting of a ×40 microscope objective, a tube lens, a CMOS camera, and add-on modalities that include a probe laser ring, a mid-IR pump laser, and an excitation laser. a 2D single-photon fluorescence intensity imaging mode. Under this mode, both the excitation filter and the emission filter are turned on. The 488 nm excitation laser beam is loosely focused on the sample using an off-axis parabolic mirror. b 3D chemical imaging mode. The oblique illumination of each probe beam matches the objective’s NA. The pump beam shares the same beam path with the 488-nm excitation laser beam. Under this mode, both pump and probe lasers are turned on and illuminating the sample while the excitation laser is switched off. c Time synchronization scheme for 3D chemical imaging. Both probe laser and mid-IR laser are running at 10 kHz with a pulse duration of ~1 µs. Each probe pulse is synchronized with a mid-IR laser pulse with a time delay of ~0.5 µs. An additional 50 Hz on/off duty-cycle modulation is imposed on the mid-IR laser to generate “Hot” and “Cold” frames on the camera. The camera is running with a frame rate of 100 Hz. Additional details on the timing scheme can be found in the Supplementary Information: Timing scheme
Fig. 3
Fig. 3. FBS-IDT chemical imaging on human epithelial cells (Tau RD P301S FRET Biosensor cells).
ah 3D chemical imaging of the experimental group with fibrillar tau aggregates. ip 3D chemical imaging of the control group without fibrillar tau aggregates. The fixed cells for both groups are immersed in D2O PBS. The scale bar in (d) is applicable to (ad) and (il). a, i Depth-resolved cold imaging results. b, j Protein imaging results with 1628 cm−1 mid-IR wavenumber. c, k Lipid imaging results with 1745 cm−1 mid-IR wavenumber. The wavenumber at 1745 cm−1 corresponds to the peak of the lipid ester C = O,,. d, l Off-resonance imaging results with 1900 cm−1 mid-IR wavenumber. Most biochemical compounds have significantly weak or no absorptions at this cell-silent wavenumber. e, f, h 3D rendering of the cells in the experimental group shown in (ac). g Overlay chemical imaging results of (f) and (h). m, n, p 3D rendering of the cells in the control group shown in (ik). o Overlay chemical imaging results of (n) and (p). Extended data can be found in Fig. S1 in the Supplementary Information
Fig. 4
Fig. 4. Fluorescence-guided depth-resolved mid-IR fingerprint spectra of tau fibrils.
a Cold IDT image at −1.065 µm depth for the cell with tau fibrils. b 2D single-photon fluorescence intensity image of the cell shown in (a). c Select areas within the tau fibrils from the 3D chemical protein map at 1628 cm−1. The selection is guided by the 2D image in (b) and highlighted in red. d Cold IDT image at −1.065 µm depth for the cell without tau fibrils. e 2D single-photon fluorescence intensity image of the cell shown in (d). f Select areas that show protein signals from the 3D chemical protein map at 1628 cm−1. The selection is highlighted in red. gk Depth-resolved mid-IR spectra extracted from the areas shown in (c). hl Depth-resolved mid-IR spectra extracted from the areas shown in (f). The axial depth value of each spectrum is shown in the top left of each plot for (g) to (l). Extended data can be found in Fig. S2 in the Supplementary Information
Fig. 5
Fig. 5. Protein secondary structure analysis and 3D visualization of β-sheet structure.
a Protein secondary structure analysis based on amide I bands for cells in the experimental and the control groups. The amide I band spectra are extracted from the mid-IR fingerprint spectra shown in Fig. 4. Three main protein secondary structures, the α helix, β sheet, and random coil, are quantified using the deconvolution method. The percentage and the peak positions for each secondary structure are indicated in each plot. b 3D protein maps of the cell with tau fibrils in the amide I band. These two images are selected according to the spectral positions of the β sheet and random coil. c 3D visualization of β sheet structure based on mid-IR spectral ratio map of two 3D images in (b). dh Depth-resolved demonstration of the 3D rendering image in (c). The axial depth value is indicated in each image. The scale bar in (h) is applicable from (d) to (h). Extended data can be found in Fig. S3 in the Supplementary Information

Update of

Similar articles

Cited by

References

    1. GBD 2016 Dementia Collaborators. Global, regional, and national burden of Alzheimer’s disease and other dementias, 1990-2016: a systematic analysis for the global burden of disease study 2016. Lancet Neurol. 2019;18:88–106. doi: 10.1016/S1474-4422(18)30403-4. - DOI - PMC - PubMed
    1. Wang YP, Mandelkow E. Tau in physiology and pathology. Nat. Rev. Neurosci. 2016;17:22–35. doi: 10.1038/nrn.2015.1. - DOI - PubMed
    1. Giovannini J, et al. Tau protein aggregation: key features to improve drug discovery screening. Drug Discovery Today. 2022;27:1284–1297. doi: 10.1016/j.drudis.2022.01.009. - DOI - PubMed
    1. Lu M, Kaminski CF, Schierle GSK. Advanced fluorescence imaging of in situ protein aggregation. Phys. Biol. 2020;17:021001. doi: 10.1088/1478-3975/ab694e. - DOI - PubMed
    1. Li D, Liu C. Hierarchical chemical determination of amyloid polymorphs in neurodegenerative disease. Nat. Chem. Biol. 2021;17:237–245. doi: 10.1038/s41589-020-00708-z. - DOI - PubMed