. 2023 Jun 15;14(1):3563.
doi: 10.1038/s41467-023-39322-7.

Attributed causes of excess mortality during the COVID-19 pandemic in a south Indian city

Affiliations

Attributed causes of excess mortality during the COVID-19 pandemic in a south Indian city

Joseph A Lewnard et al. Nat Commun. .

Abstract

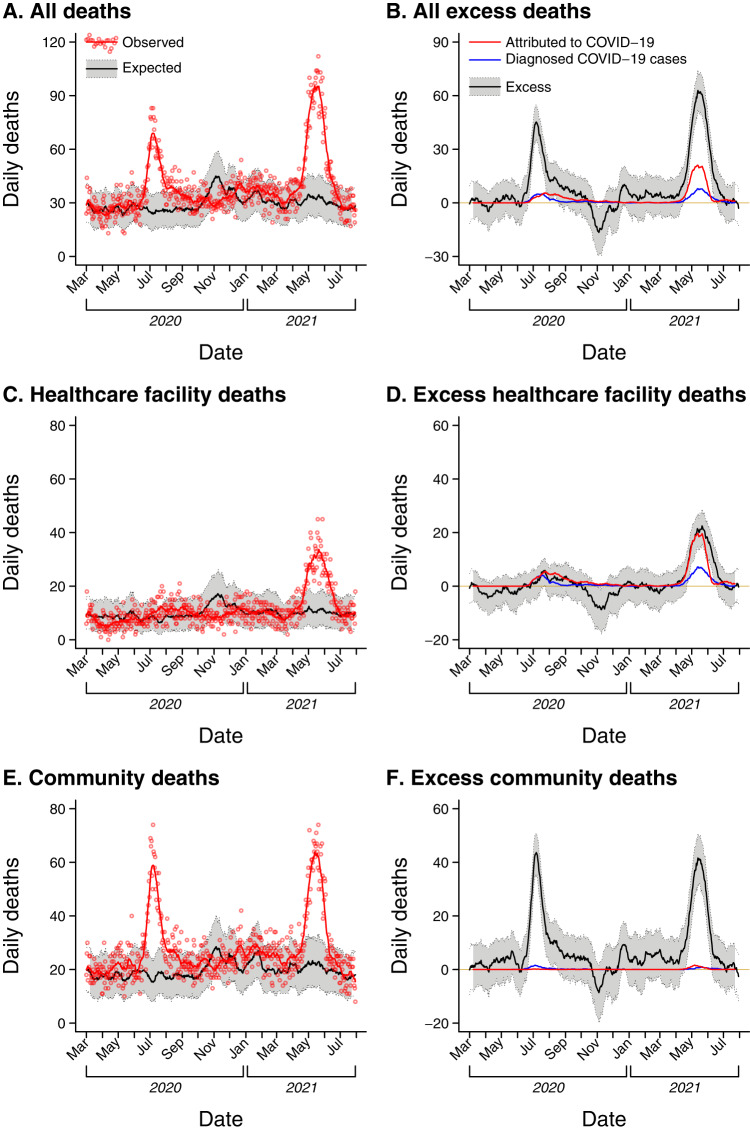
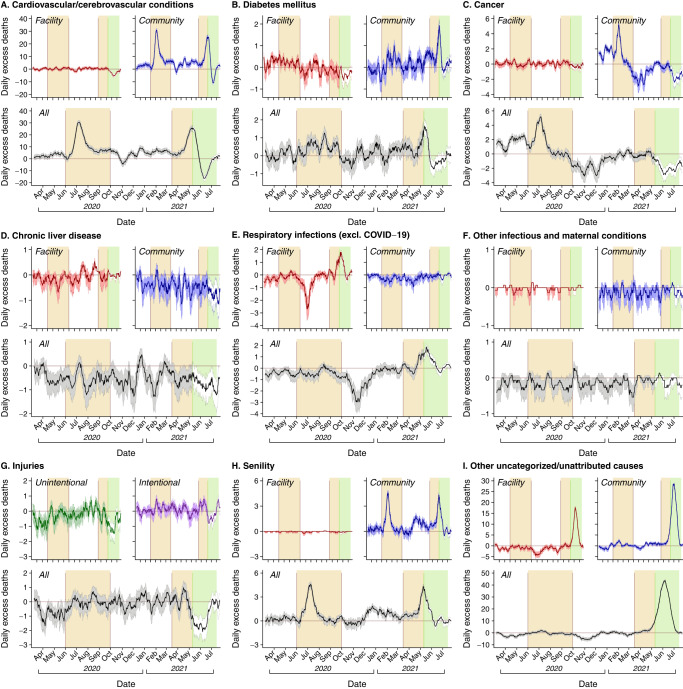
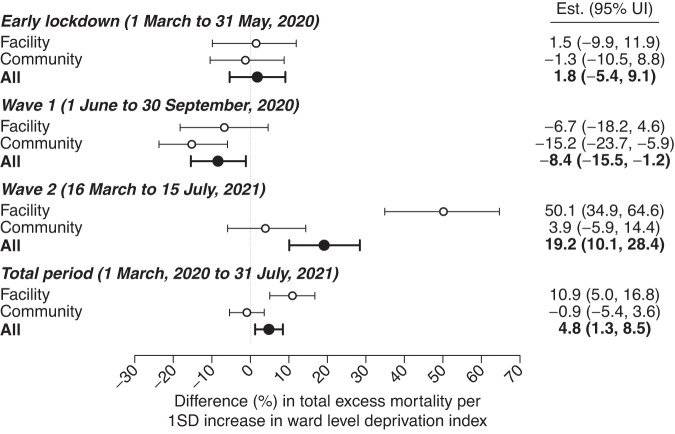
Globally, excess deaths during 2020-21 outnumbered documented COVID-19 deaths by 9.5 million, primarily driven by deaths in low- and middle-income countries (LMICs) with limited vital surveillance. Here we unravel the contributions of probable COVID-19 deaths from other changes in mortality related to pandemic control measures using medically-certified death registrations from Madurai, India-an urban center with well-functioning vital surveillance. Between March, 2020 and July, 2021, all-cause deaths in Madurai exceeded expected levels by 30% (95% confidence interval: 27-33%). Although driven by deaths attributed to cardiovascular or cerebrovascular conditions, diabetes, senility, and other uncategorized causes, increases in these attributions were restricted to medically-unsupervised deaths, and aligned with surges in confirmed or attributed COVID-19 mortality, likely reflecting mortality among unconfirmed COVID-19 cases. Implementation of lockdown measures was associated with a 7% (0-13%) reduction in all-cause mortality, driven by reductions in deaths attributed to injuries, infectious diseases and maternal conditions, and cirrhosis and other liver conditions, respectively, but offset by a doubling in cancer deaths. Our findings help to account for gaps between documented COVID-19 mortality and excess all-cause mortality during the pandemic in an LMIC setting.


Conflict of interest statement

J.A.L. discloses receipt of grants and honoraria from Pfizer unrelated to this research. The remaining authors declare no competing interest.

Figures

Fig. 1
Fig. 1. Observed and expected deaths.
We plot observed and expected deaths as well as total excess deaths estimated to have occurred during the analysis period of March 2020 to July 2021, including for all settings (A, B), deaths in healthcare facilities (C, D), and deaths in community settings (E, F). Panels illustrating observed and expected deaths (A, C, E) present observed deaths as red points with accompanying red lines indicating 14-day moving average values. Expected deaths (sampled via Poisson distributions fitted with 2-week moving-average mortality rates from 2018–19, accounting for changes in population size [Table S19]) are presented as black lines (median estimates) along with 95% uncertainty intervals (gray shading). Panels illustrating total excess deaths (difference of observed deaths minus expected deaths; B, D, F) present 14-day moving average values as black lines (median estimates) along with 95% uncertainty intervals (gray shading). Accompanying red lines illustrate 2-week moving averages of total deaths attributed to COVID-19 in the medically certified cause of death data; blue lines indicate 2-week moving averages of deaths among individuals with confirmed SARS-CoV-2 infection occurring within <30 days of the positive test date. We plot corresponding age- and sex-stratified comparisons of observed and expected deaths in Fig. S1.
Fig. 2
Fig. 2. Excess deaths by attributed cause.
We illustrate 2-week moving average estimates of excess deaths attributed to various causes: A cardiovascular and cerebrovascular conditions; B diabetes mellitus; C cancer; D cirrhosis and chronic liver diseases; E respiratory infections (excluding COVID-19); F other infectious and maternal conditions, besides respiratory infections; G injuries, H senility; and I other uncategorized or unattributed causes. Within each panel, top-left and top-right subpanels illustrate excess deaths in healthcare facilities and community (non-facility) settings, while lower subpanels illustrate all excess deaths; for injuries (G), we distinguish intentional and unintentional deaths in the subpanels. Lines denote median estimates; shaded areas delineate accompanying 95% uncertainty intervals, generated as draws from Poisson distributions fitted with 2-week moving-average mortality rates from 2018–19, accounting for changes in population size (Table S19). Areas with shaded backgrounds delineate the periods of the first wave (1 June to 30 September 2020) and second wave (16 March to 15 July, 2021); the green shaded area illustrates the period from 3 May 2021 onward, when uncategorized/unattributed deaths exceeded typical levels by a threefold or greater factor. To best illustrate variation in the cause-specific death attributions on the relative scale, y-axes are allowed to vary across panels due to variation in the number of deaths attributed to each cause.
Fig. 3
Fig. 3. Association of excess deaths with ward-level deprivation indicators.
We illustrate estimates of the association between excess deaths and a ward-level measure of community deprivation, constructed as the first principal component of 15 socioeconomic indicators measured in the 2011 Census of India (Table S14). Values correspond to the absolute difference (in percentage-point units) in excess mortality, measured relative to expected deaths, associated with an increase by one standard deviation in the principal component-based measure of community deprivation. Lines denote 95% uncertainty intervals surrounding point estimates (medians), as estimated across regression models fitted across 10,000 independent draws from the distribution of the excess mortality outcome variable.

References

    1. Karlinsky A, Kobak D. Tracking excess mortality across countries during the COVID-19 pandemic with the World Mortality Dataset. eLife. 2021;10:e69336. doi: 10.7554/eLife.69336. - DOI - PMC - PubMed
    1. World Health Organization. Global excess deaths associated with COVID-19, January 2020 - December 2021. Available from: https://www.who.int/data/stories/global-excess-deaths-associated-with-co.... (2023).
    1. Jha P, et al. COVID mortality in India: National survey data and health facility deaths. Science. 2022;375:667–671. doi: 10.1126/science.abm5154. - DOI - PMC - PubMed
    1. Msemburi W, et al. The WHO estimates of excess mortality associated with the COVID-19 pandemic. Nature. 2023;613:130–137. doi: 10.1038/s41586-022-05522-2. - DOI - PMC - PubMed
    1. Mishra V, et al. Drought and famine in India, 1870–2016. Geophys. Res. Lett. 2019;46:2075–2083. doi: 10.1029/2018GL081477. - DOI

Publication types