. 2023 Jul;55(7):1221-1231.
doi: 10.1038/s41588-023-01419-6. Epub 2023 Jun 15.

A complete telomere-to-telomere assembly of the maize genome

Affiliations

A complete telomere-to-telomere assembly of the maize genome

Jian Chen et al. Nat Genet. 2023 Jul.

Abstract

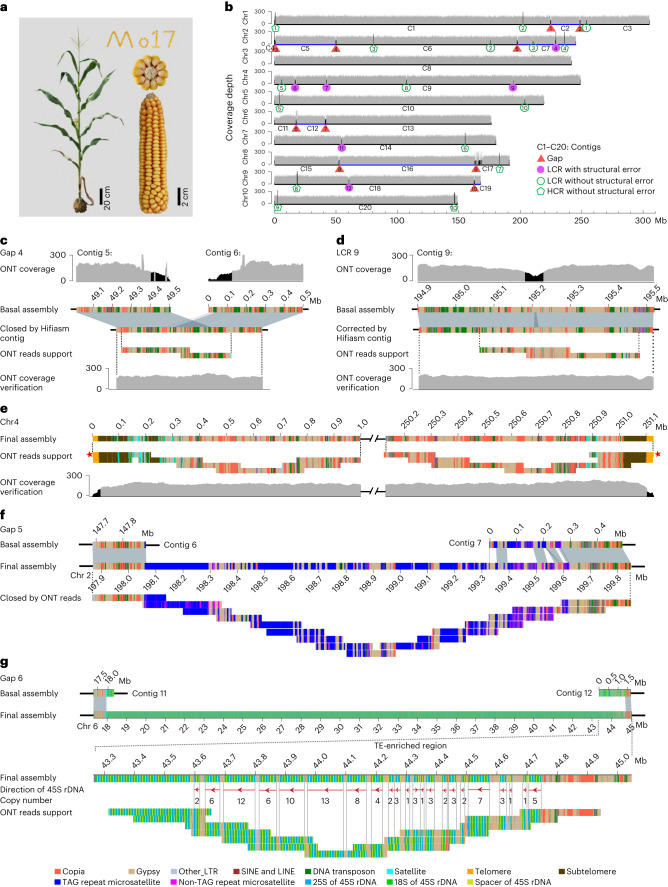
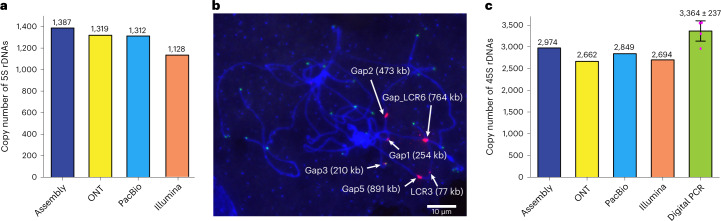
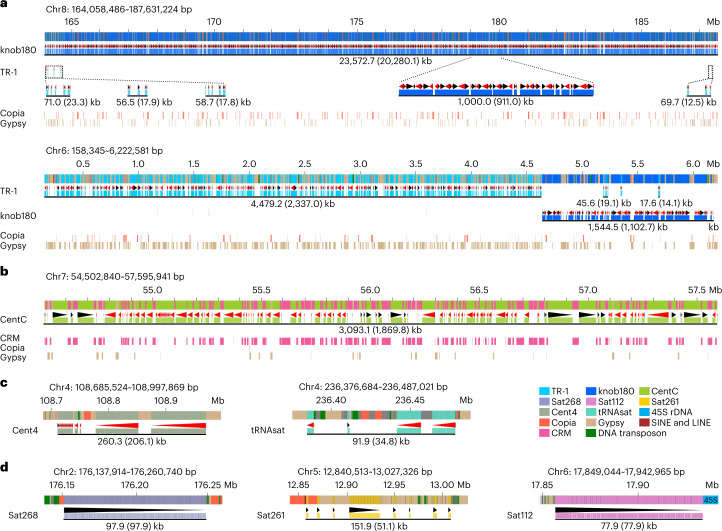
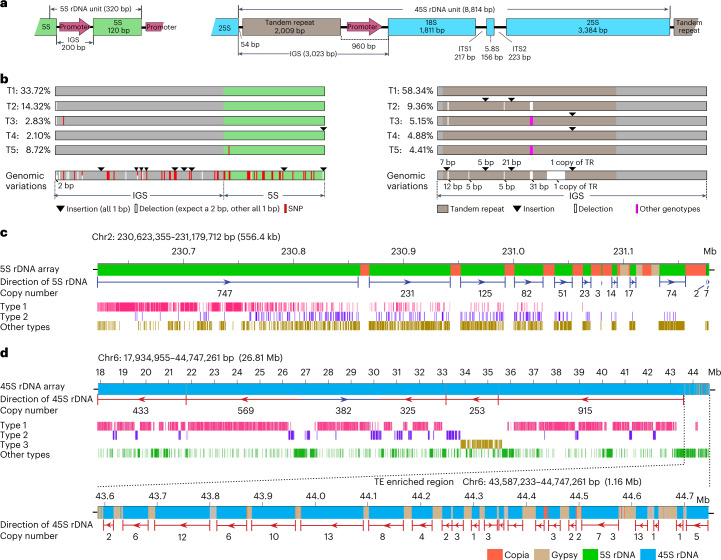
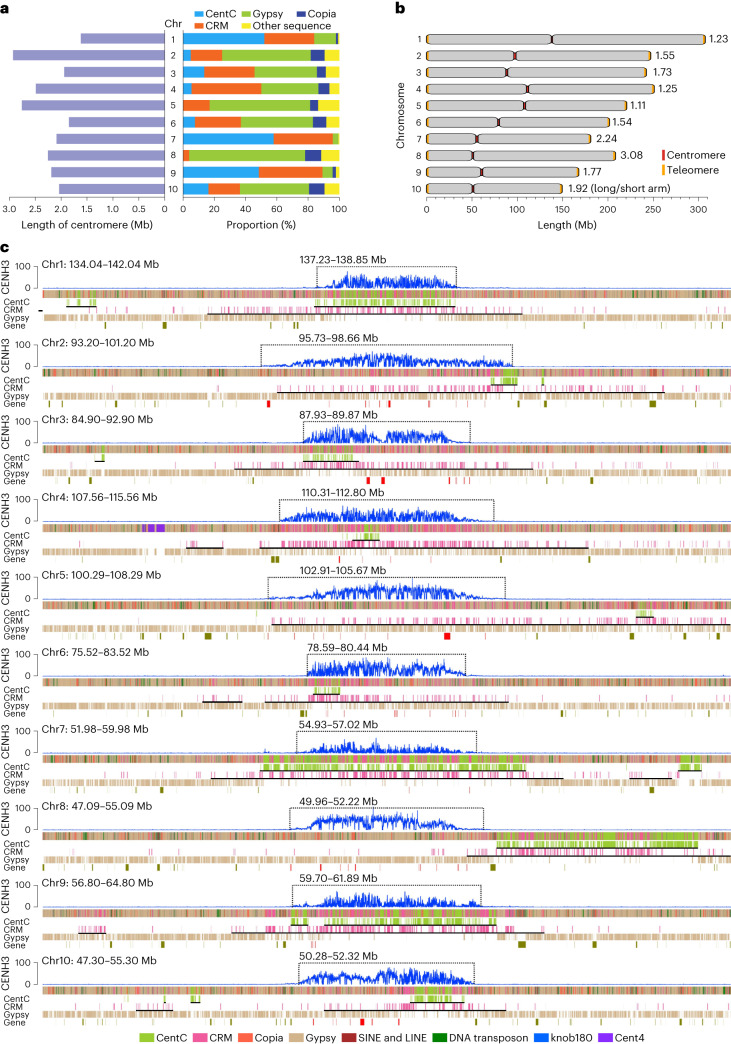
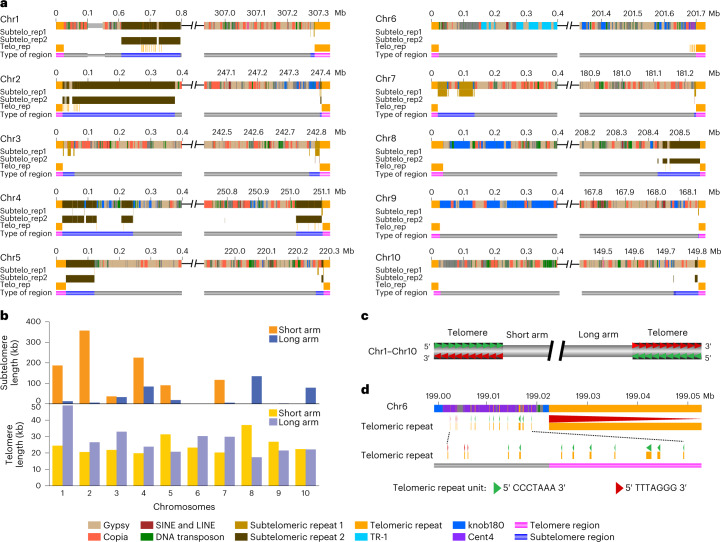
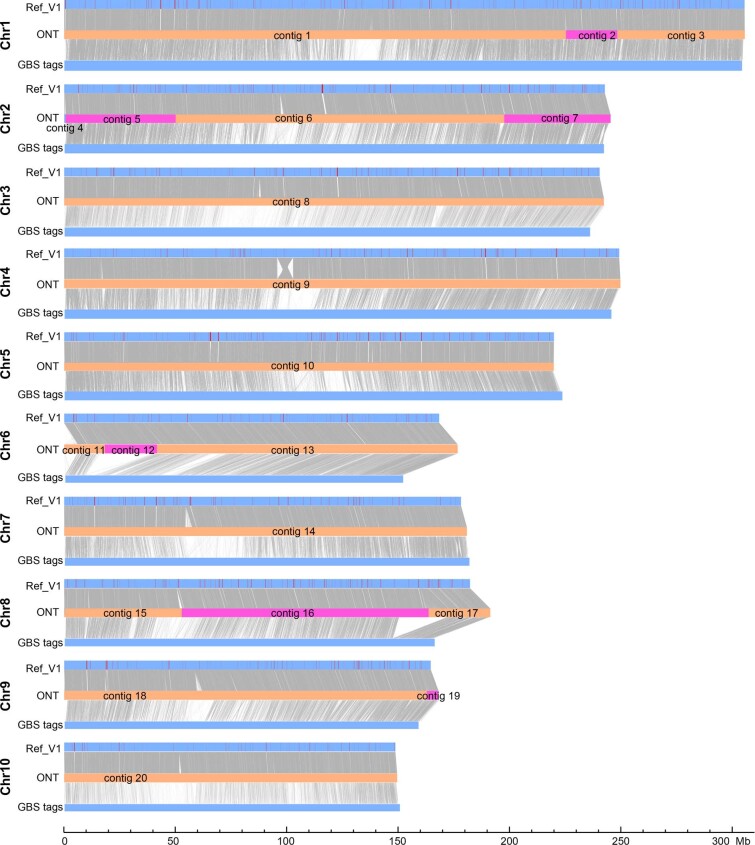
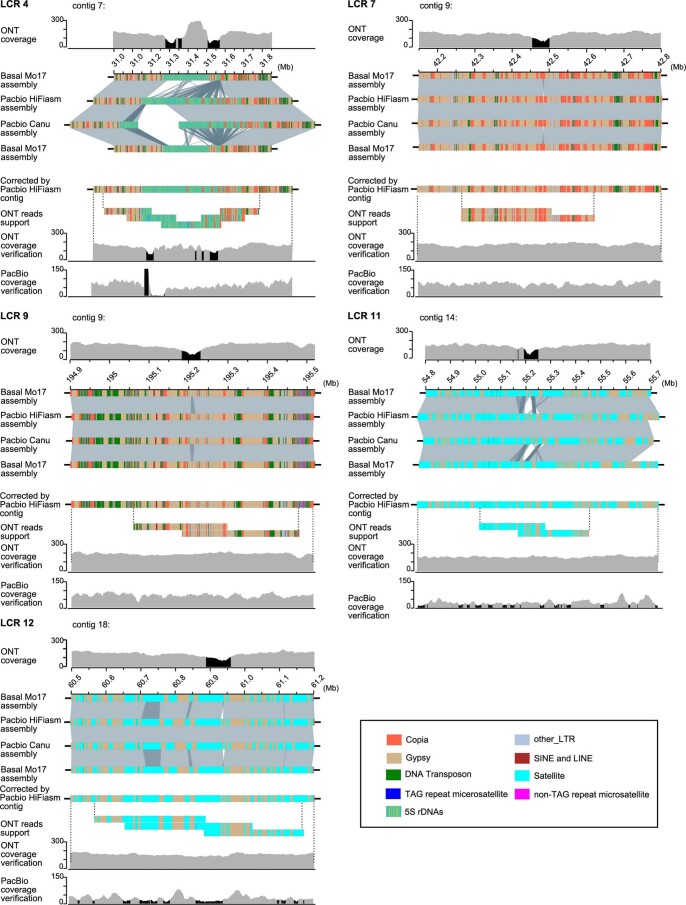
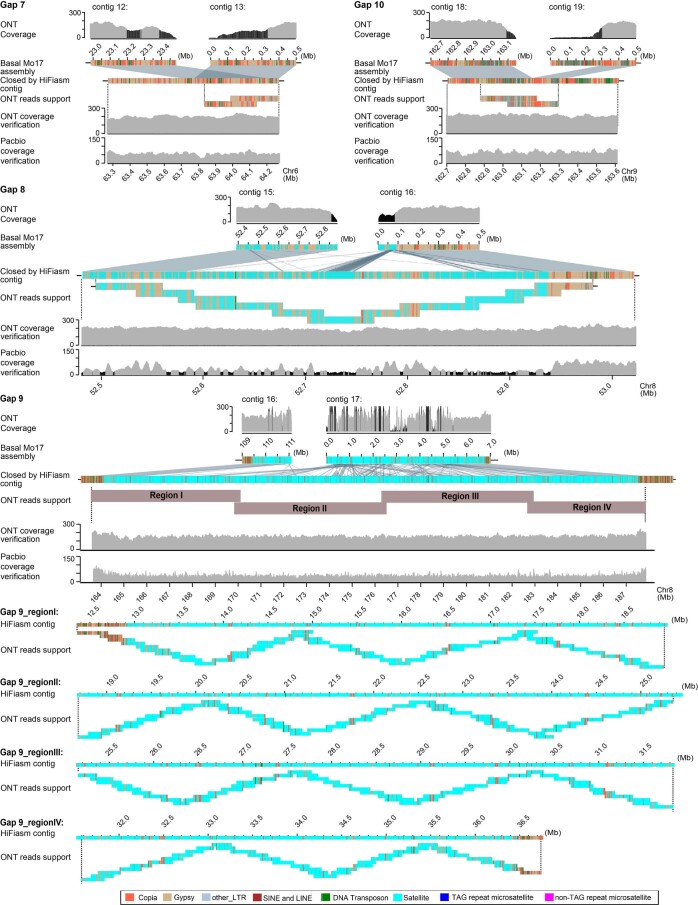
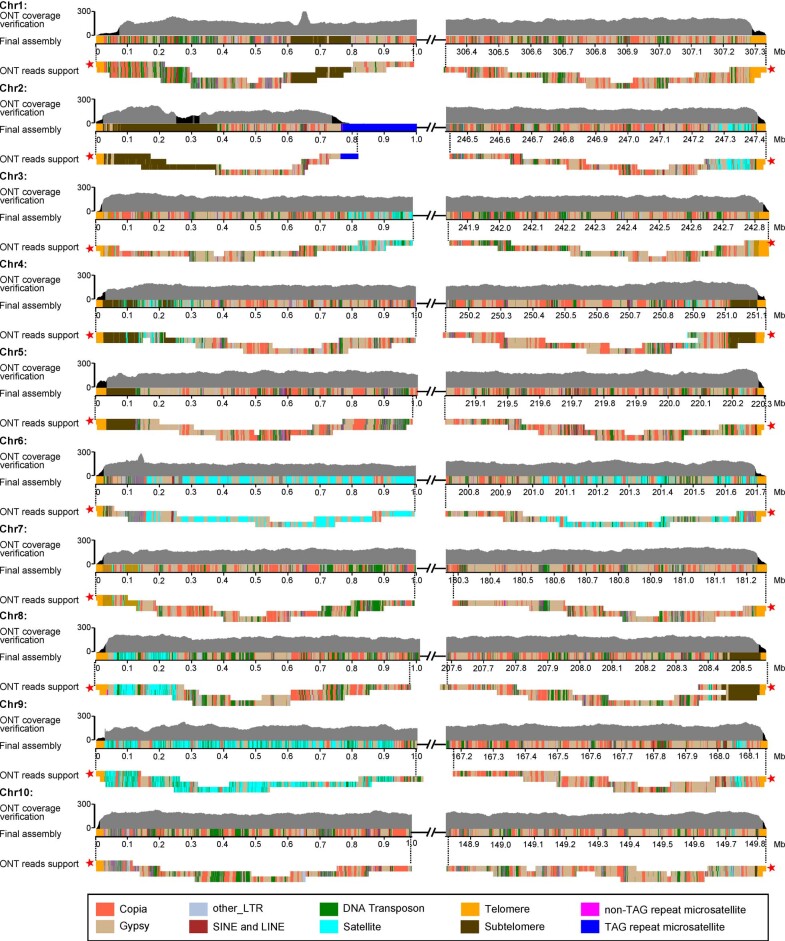
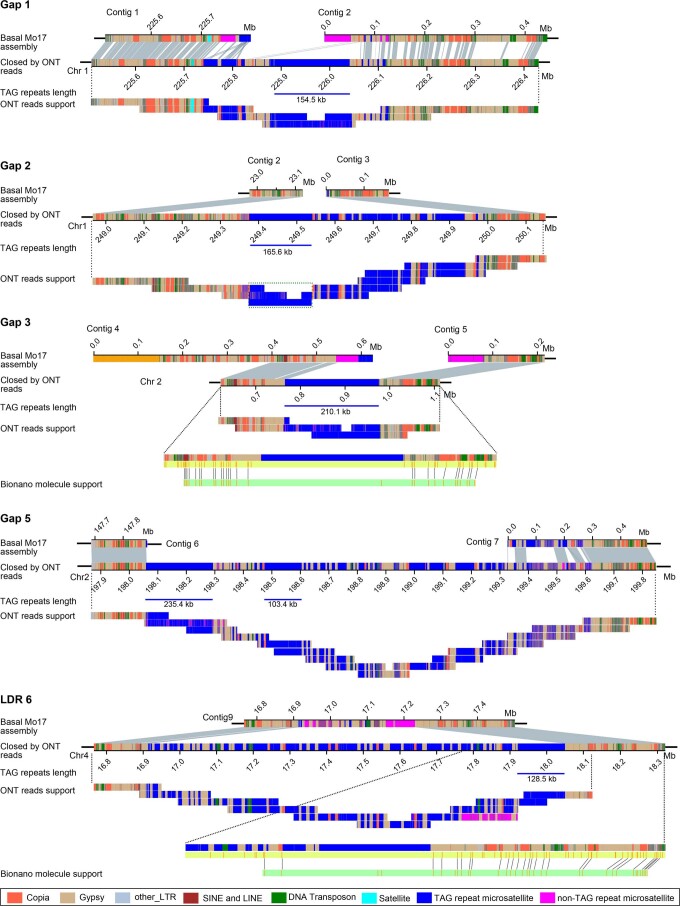
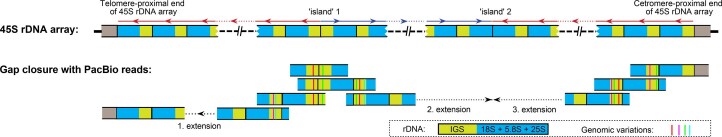
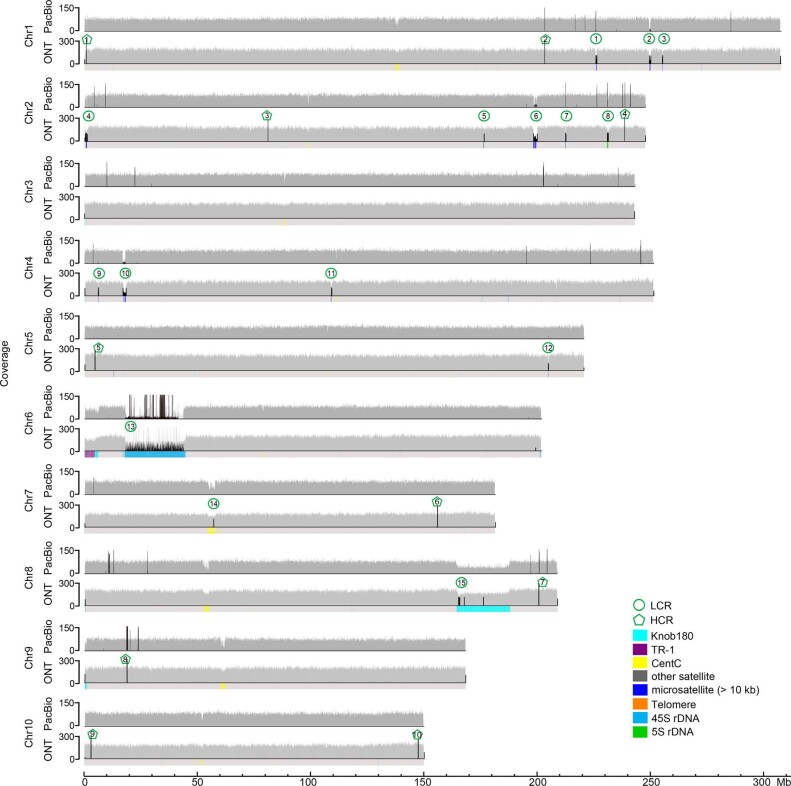
A complete telomere-to-telomere (T2T) finished genome has been the long pursuit of genomic research. Through generating deep coverage ultralong Oxford Nanopore Technology (ONT) and PacBio HiFi reads, we report here a complete genome assembly of maize with each chromosome entirely traversed in a single contig. The 2,178.6 Mb T2T Mo17 genome with a base accuracy of over 99.99% unveiled the structural features of all repetitive regions of the genome. There were several super-long simple-sequence-repeat arrays having consecutive thymine-adenine-guanine (TAG) tri-nucleotide repeats up to 235 kb. The assembly of the entire nucleolar organizer region of the 26.8 Mb array with 2,974 45S rDNA copies revealed the enormously complex patterns of rDNA duplications and transposon insertions. Additionally, complete assemblies of all ten centromeres enabled us to precisely dissect the repeat compositions of both CentC-rich and CentC-poor centromeres. The complete Mo17 genome represents a major step forward in understanding the complexity of the highly recalcitrant repetitive regions of higher plant genomes.


Conflict of interest statement

The authors declare no competing interests.

Figures

Fig. 1
Fig. 1. Telomere-to-telomere assembly of the Mo17 genome.
a, Plant and ear photos of Mo17. b, Whole-genome coverage of ONT reads across the basal Mo17 assembly. Ultralong ONT reads longer than 10 kb were used for coverage analysis. The LCRs with reads depth lower than 100 and high-coverage regions (HCRs) with reads depth higher than 250 were marked by black shades. c,d, Schematic representation showing that a gap (c) and LCR (d) on the basal Mo17 assembly were closed or corrected by the contigs of PacBio Hifiasm assembly, in which the validity was confirmed by uniform ONT reads coverage and tiling ONT reads. e, Validation of the final assembly of the terminal 1 Mb regions for chromosome 4. Red pentagrams indicated the ONT reads used to correct the telomere length for corresponding chromosomal ends, in which the telomeric repeats harbored by them were longer than other reads mapped to corresponding ends. f, Schematic representation showing the manual closing for a TAG repeat array-related gap on chromosome 2 by ONT reads. g, Validation of the assembly of the TE-rich region in the 45S rDNA array by ONT reads. The red arrows represent the transcriptional directions of 45S rDNAs.
Fig. 2
Fig. 2. Validation of the rDNA arrays and TAG repeat arrays.
a, Comparison of the copy number of 5S rDNAs in the assembly and that estimated with ultralong ONT, PacBio HiFi data and Illumina PCR-free data. b, The hybridized locations of the probes TAG repeats (red) and telomeric repeats (green) on the meiotic pachytene chromosomes of Mo17. The lengths of TAG repeats harbored by corresponding TAG repeat arrays were pointed out. Four replicates were conducted. c, Comparison of the copy number of 45S rDNAs in the assembly and that estimated by ultralong ONT data, PacBio HiFi data, Illumina PCR-free data and digital PCR. The data of digital PCR-based estimation were obtained from four replicates. The mean ± s.d. was represented.
Fig. 3
Fig. 3. Genome structure of satellite arrays.
a, Genome structure of two knobs on chromosomes 6 and 8. b, Genome structure of the longest CentC array. c, Genome structure of Cent4 and tRNAsat arrays. d, Genome structure of Sat266, Sat261 and Sat112 arrays. The length of the corresponding array was indicated below the black solid lines, in which the number in the brackets indicates the length of corresponding satellites harbored in the array. The black and red triangles under the satellites indicate the sequence direction of the corresponding satellites.
Fig. 4
Fig. 4. Genome structure of 5S and 45S rDNA arrays.
a, Sequence structure of a typical 5S and 45S rDNAs repeat unit. IGS, intergenic spacer region; ITS, internal transcribed spacer region. b, Graphical representation of the five most abundant genotypes of 5S rDNAs (left) and 45S rDNAs (right). For the 45S rDNA, only the IGS region was shown. Genomic variations used for genotype analysis were indicated. c,d, Graphical representation of the genome structure of 5S rDNA array (c) and 45S rDNA arrays (d).
Fig. 5
Fig. 5. Genome structure of the centromeric regions of ten chromosomes.
a, Comparison of the length and sequence composition of ten centromeres. b, Graphical representation of the centromeric positions on ten chromosomes. c, Schematic representation showing the distribution of different sequence compositions across ten centromeres. The CENH3 levels were represented by the enrichment level in 10 kb windows along chromosomes. The centromeres were marked by dotted boxes. The black solid lines under the tracks of CentC and CRM indicated the corresponding regions were identified as CentC arrays or CRM arrays. The red blocks for the track of gene indicated genes located in the centromeres.
Fig. 6
Fig. 6. Genome structure of the telomeric and subtelomeric regions of 20 chromosomal ends.
a, Schematic representation showing the distribution of different sequence compositions across the terminal regions of ten chromosomes. b, Comparison of the length of telomeres and subtelomeres for ten chromosomes. c, Graphical representation of the direction of telomeric repeats observed for all telomeres. d, The direction of telomeric repeats on the ends of chr6L.
Extended Data Fig. 1
Extended Data Fig. 1. Alignment of raw ONT assembly contigs with the pseudomolecules of the Mo17ref_V1 and the GBS tags.
There was a total of 20 contigs which were anchored and oriented onto ten pseudomolecules of the Mo17 genome. The contig 3 and contig 6 were generated by split of a raw ONT contig with assembly error (see Supplementary Fig. 1). The red lines on the blue blocks refer the gaps on the Mo17ref_V1.
Extended Data Fig. 2
Extended Data Fig. 2. Correction of five LCRs by the contigs of PacBio assembly.
According to the alignment with the PacBio assembly, 5 LCRs on the basal Mo17 assembly could be corrected by the contigs of PacBio Hifiasm assembly. Corrected assembly was confirmed by the uniform ONT and/or PacBio reads coverage, and tiling ONT reads. Black shades refer local coverage-anomalous regions.
Extended Data Fig. 3
Extended Data Fig. 3. Validation the assembly of gaps closed by the contigs of PacBio assembly.
The validity of four gaps closed by the contigs of PacBio Hifiasm assembly were confirmed by the uniform ONT and/or PacBio reads coverage and tiling ONT reads. Black shades refer local coverage-anomalous regions. We noted that in gaps 7 and 10, a part of the ONT contigs not aligned to HiFi contigs were removed in the final assembly. Compared to the normal gap ends (which were remained in the final assembly) with gradually decreased coverage, almost no aligned ONT reads were observed for these regions removed in the final assembly, which suggested that these removed parts of contigs were in fact redundant or misassembled fragments, and further confirmed the assemblies of these gap-closed regions.
Extended Data Fig. 4
Extended Data Fig. 4. Validation of the assembly of the terminal 1 Mb regions for 10 chromosomes of the final Mo17 assembly.
The assembly of the terminal 1 Mb regions of all 10 chromosomes were confirmed by tiling ONT reads. ONT reads coverage analysis showed that expect for the 20 telomeres of chromosomes, as well as subtelomeric regions and long TAG repeat region on chromosome 2, uniform ONT reads coverage were observed in general. Black shades of ONT coverage verification refer the regions with reads depth lower than 100. Red pentagrams refer the reads harbored with the longest telomeric repeats for corresponding chromosomal ends, which were used to correct corresponding telomeric regions.
Extended Data Fig. 5
Extended Data Fig. 5. Schematic showing the manual closing for 5 TAG repeat array related gaps by ONT reads.
The green dotted box indicated the TAG repeat region in gap2 which length was estimated (see Method).
Extended Data Fig. 6
Extended Data Fig. 6. Schematic of 45S rDNA related gap closure by PacBio HiFi reads.
The blue and red arrows indicated the transcription directions of corresponding 45S rDNAs were toward to the centromere and telomere, respectively. The black arrows indicated the direction of extension during gap closure.
Extended Data Fig. 7
Extended Data Fig. 7. Whole-genome coverage of ONT reads across the T2T assembly of Mo17 genome.
Ultra-long ONT reads longer than 10 kb and PacBio HiFi reads were used for analysis. Local coverage-anomalous regions were shown in black shades.
Extended Data Fig. 8
Extended Data Fig. 8. Validation of the completeness of the T2T Mo17 assembly by mapping of ONT reads.
a, The composition of different types of ONT reads. Quality filtered ONT reads that longer than 10 kb were used for analysis. Reads of unknown mistaken origin refer the unmapped reads which were not grouped as fused reads, symmetrical reads, microbial reads, and mitochondrial and chloroplast reads based on the thresholds we used (see Method). b, c, Box plots showing the coverage (b) and average depth (c) of PacBio reads across the reads (n = 9,518) which mistaken origin was unknown and could be mapped with PacBio reads. In box plots, the 25% and 75% quartiles are shown as lower and upper edges of boxes, respectively, and central lines denote the median. The whiskers extend to 1.5 times the interquartile range. Data beyond the end of the whiskers are displayed as outlying dots. Totally, there were 83,167 reads of unknown mistaken origin, which nearly 85% could not be supported by any of PacBio reads. There were only 15% (13,636/83,167) reads of unknown mistaken origin could be mapped with PacBio reads. However, average only 38.1% regions of these 13,636 reads of unknown mistaken origin were covered by PacBio reads. In addition, average depth of PacBio reads across these 13,636 reads of unknown mistaken origin were only 1.8×, respectively, far lower than the theoretical 69.4×. Consequently, no any reliable PacBio reads supports were found for reads of unknown mistaken origin.
Extended Data Fig. 9
Extended Data Fig. 9. Graphic representation of a threonine protein kinase related tandem gene loci on chromosome 10.
a, The validity of the assembly of corresponding region on the Mo17 genome was confirmed by uniform ONT reads coverage and tiling ONT reads. b, The locations of genes annotated in corresponding region of Mo17 genome. Green blocks represent different copies of threonine protein kinase related genes. Orange blocks represent different copies of another duplicated gene with unknown function. c, Schematic showing the genes and pseudogenes in corresponding regions of the B73 and Mo17 genomes.
Extended Data Fig. 10
Extended Data Fig. 10. Variant distances of knob180, TR-1, and CentC repeats.
a, Histograms of the variant distances relative to the genome-wide consensus for knob180, TR-1, and CentC repeats. b, Proportion of knob180 repeats with relatively low and high levels of variant distances on Knob-6S and Knob-8L. c, The distribution of knob180 repeats with relatively low and high levels of variant distances along Konb-8L.

References

    1. Dujon B. The yeast genome project: what did we learn? Trends Genet. 1996;12:263–270. doi: 10.1016/0168-9525(96)10027-5. - DOI - PubMed
    1. Adams MD, et al. The genome sequence of Drosophila melanogaster. Science. 2000;287:2185–2195. doi: 10.1126/science.287.5461.2185. - DOI - PubMed
    1. Arabidopsis Genome Initiative Analysis of the genome sequence of the flowering plant Arabidopsis thaliana. Nature408, 796 (2000). - PubMed
    1. Venter JC, et al. The sequence of the human genome. Science. 2001;291:1304–1351. doi: 10.1126/science.1058040. - DOI - PubMed
    1. Lander ES, et al. Initial sequencing and analysis of the human genome. Nature. 2001;409:860–921. doi: 10.1038/35057062. - DOI - PubMed

Publication types