. 2023 Jun;29(6):1389-1399.
doi: 10.1038/s41591-023-02345-0. Epub 2023 Jun 15.

Intratumoral dendritic cell-CD4+ T helper cell niches enable CD8+ T cell differentiation following PD-1 blockade in hepatocellular carcinoma

Affiliations

Intratumoral dendritic cell-CD4+ T helper cell niches enable CD8+ T cell differentiation following PD-1 blockade in hepatocellular carcinoma

Assaf Magen et al. Nat Med. 2023 Jun.

Abstract

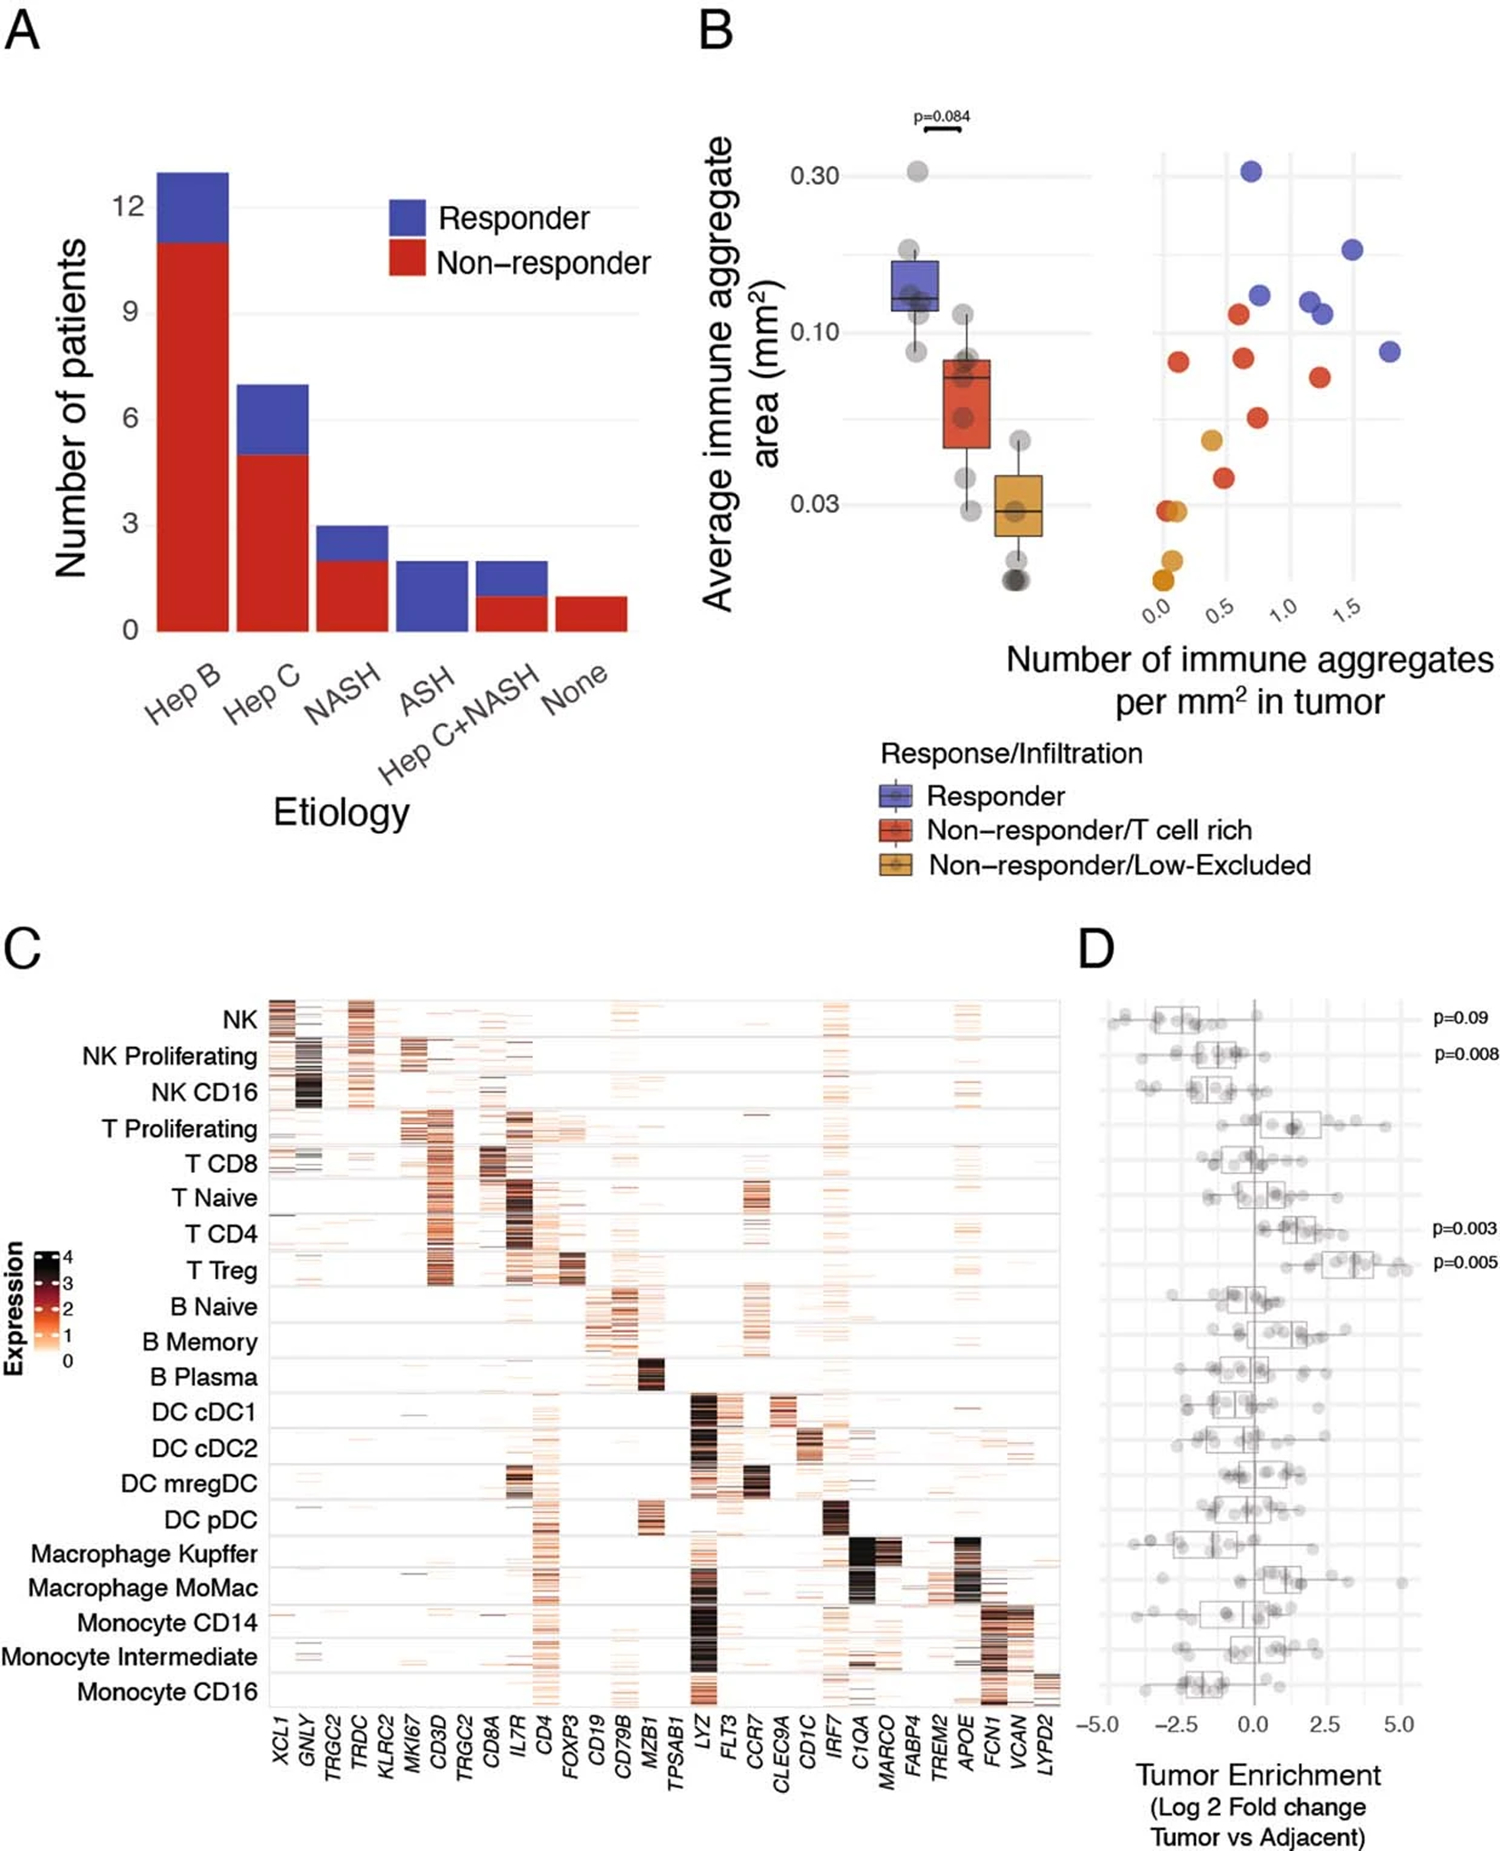
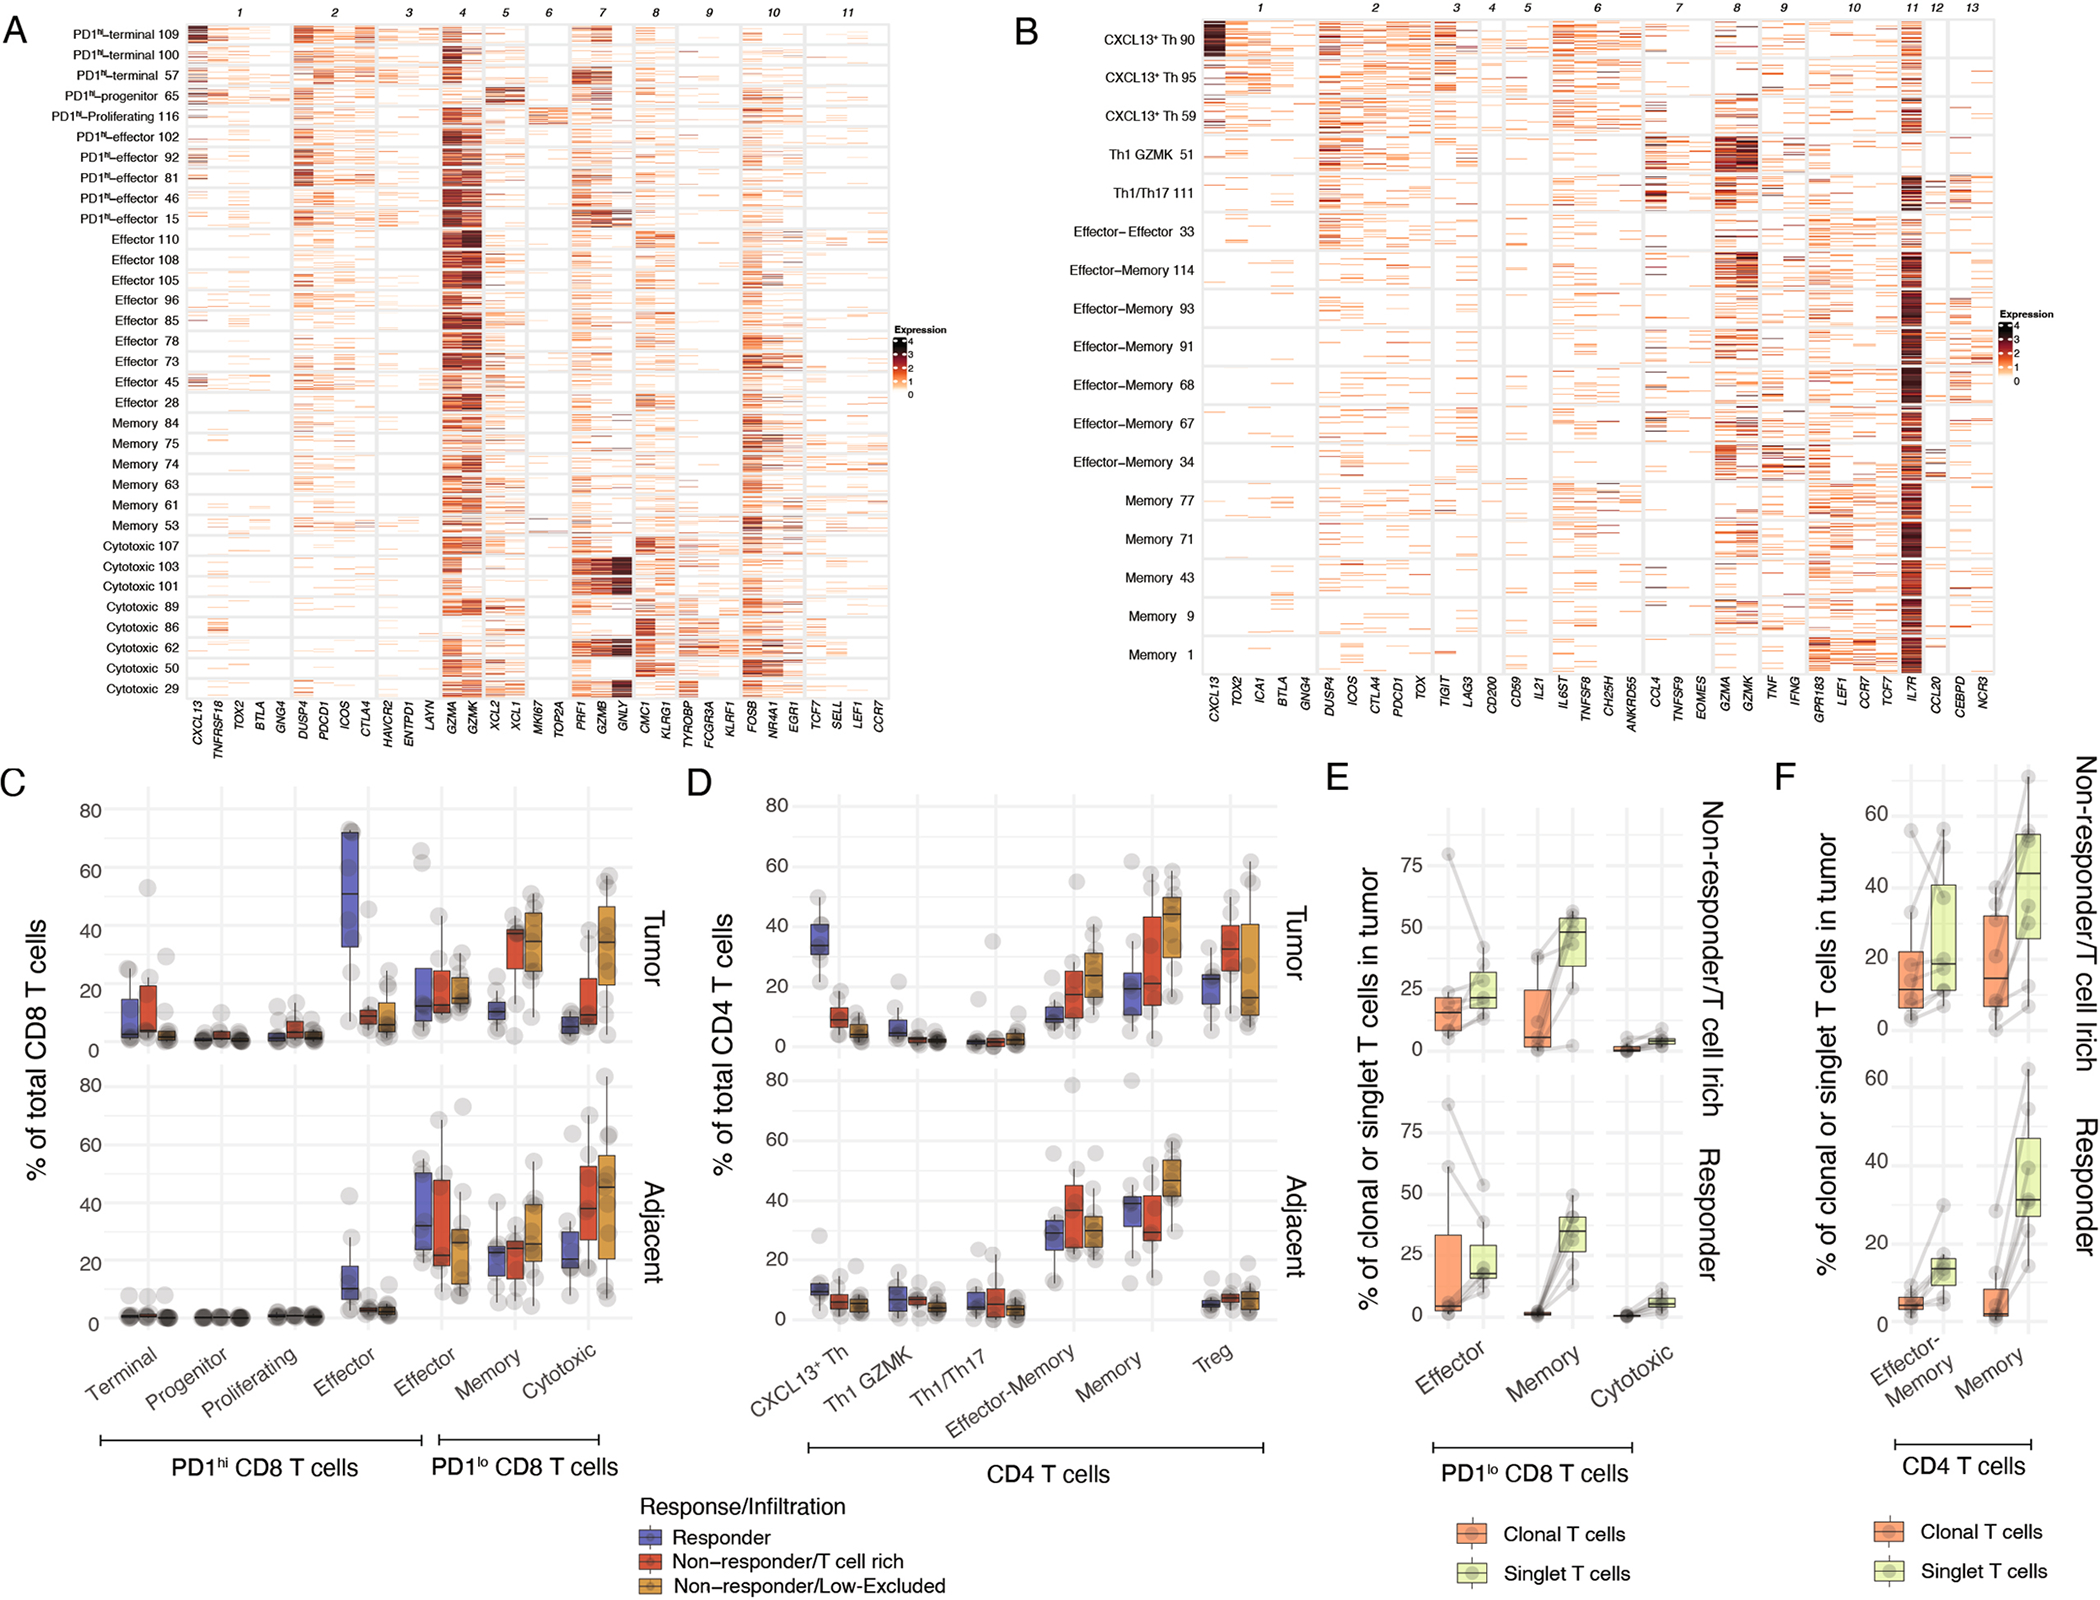
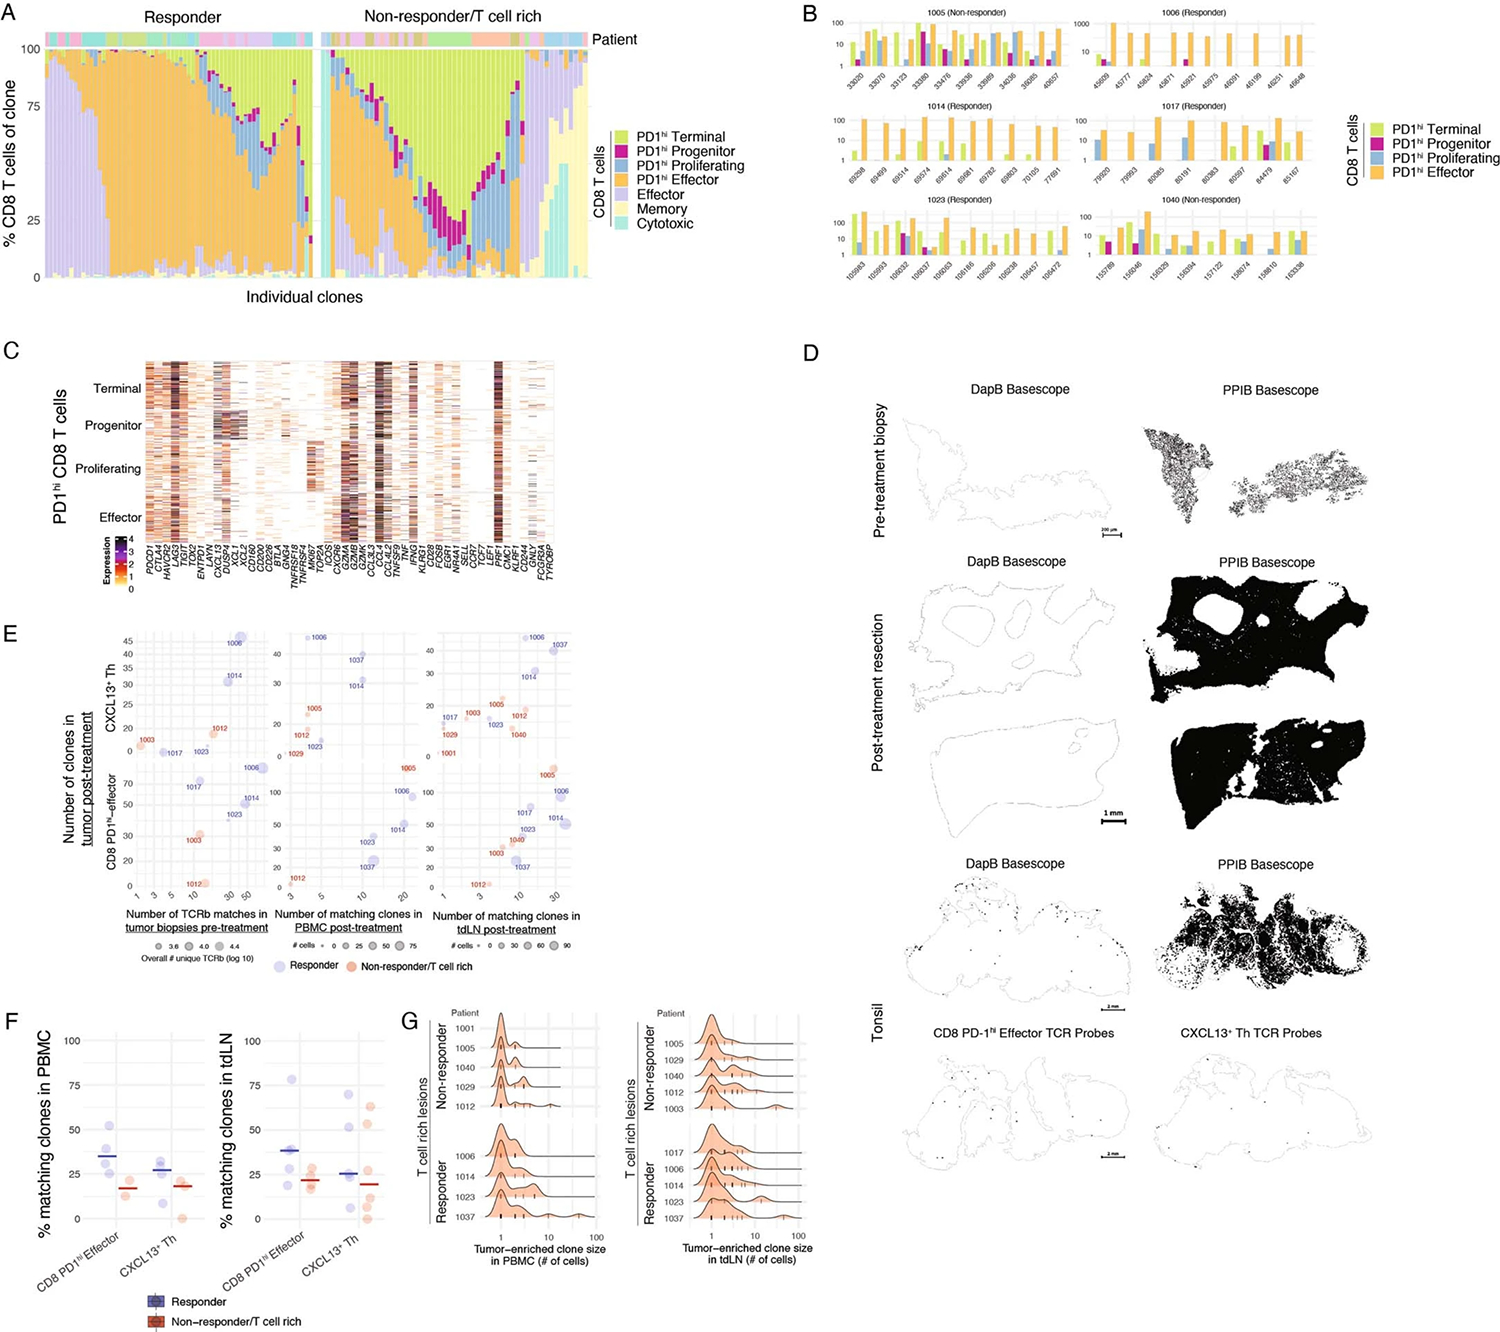
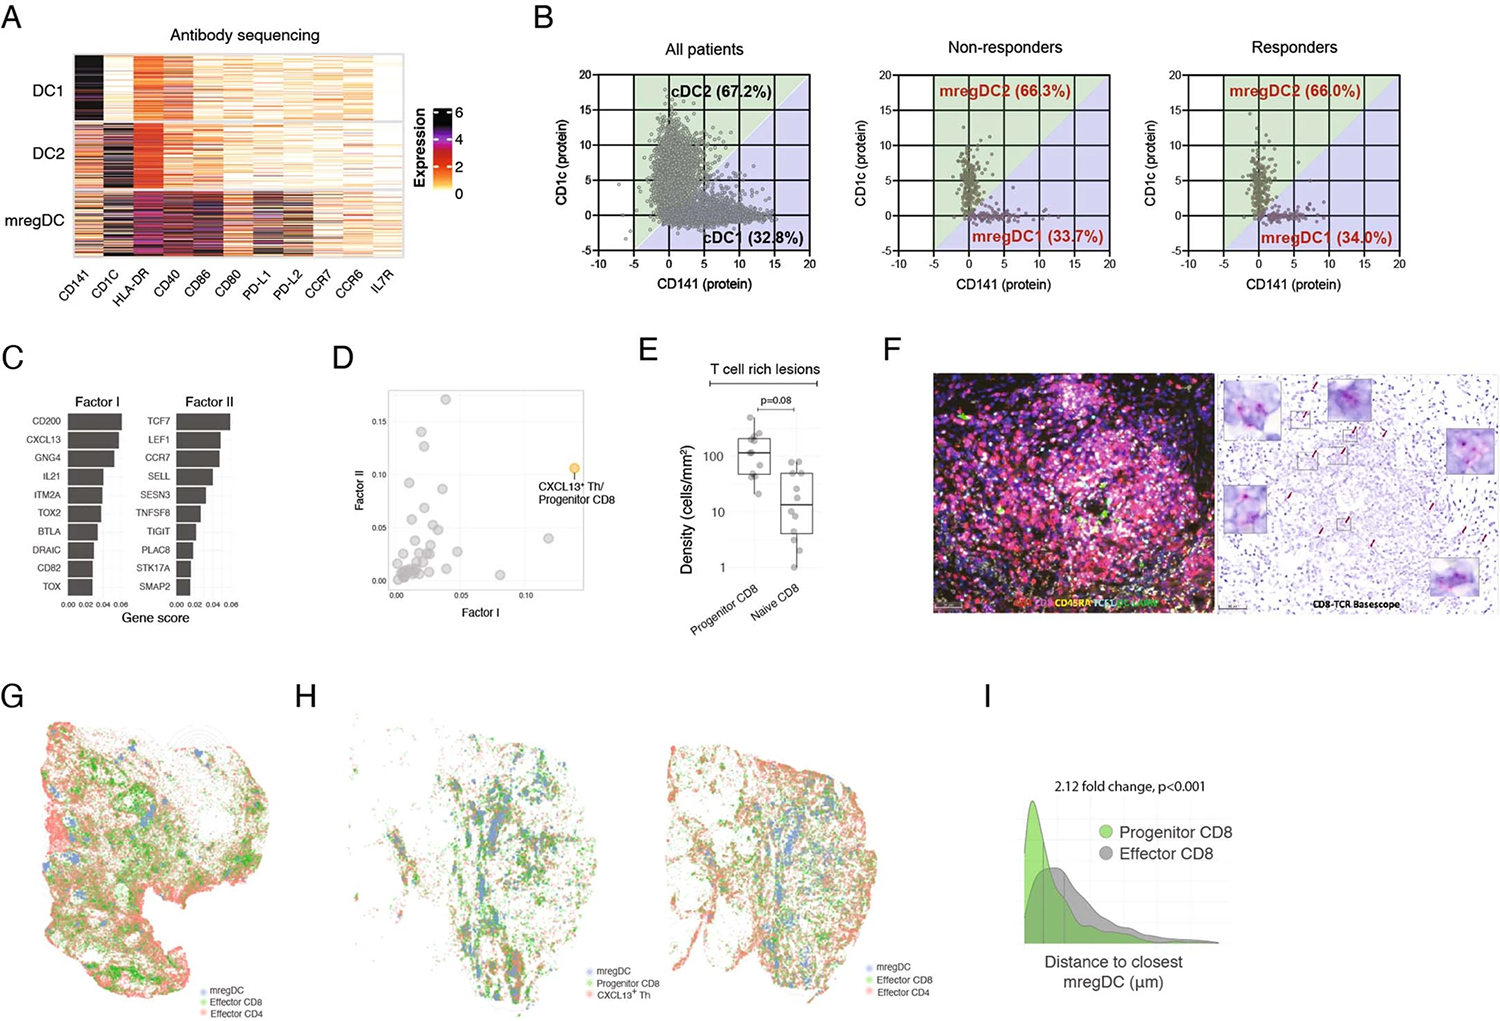
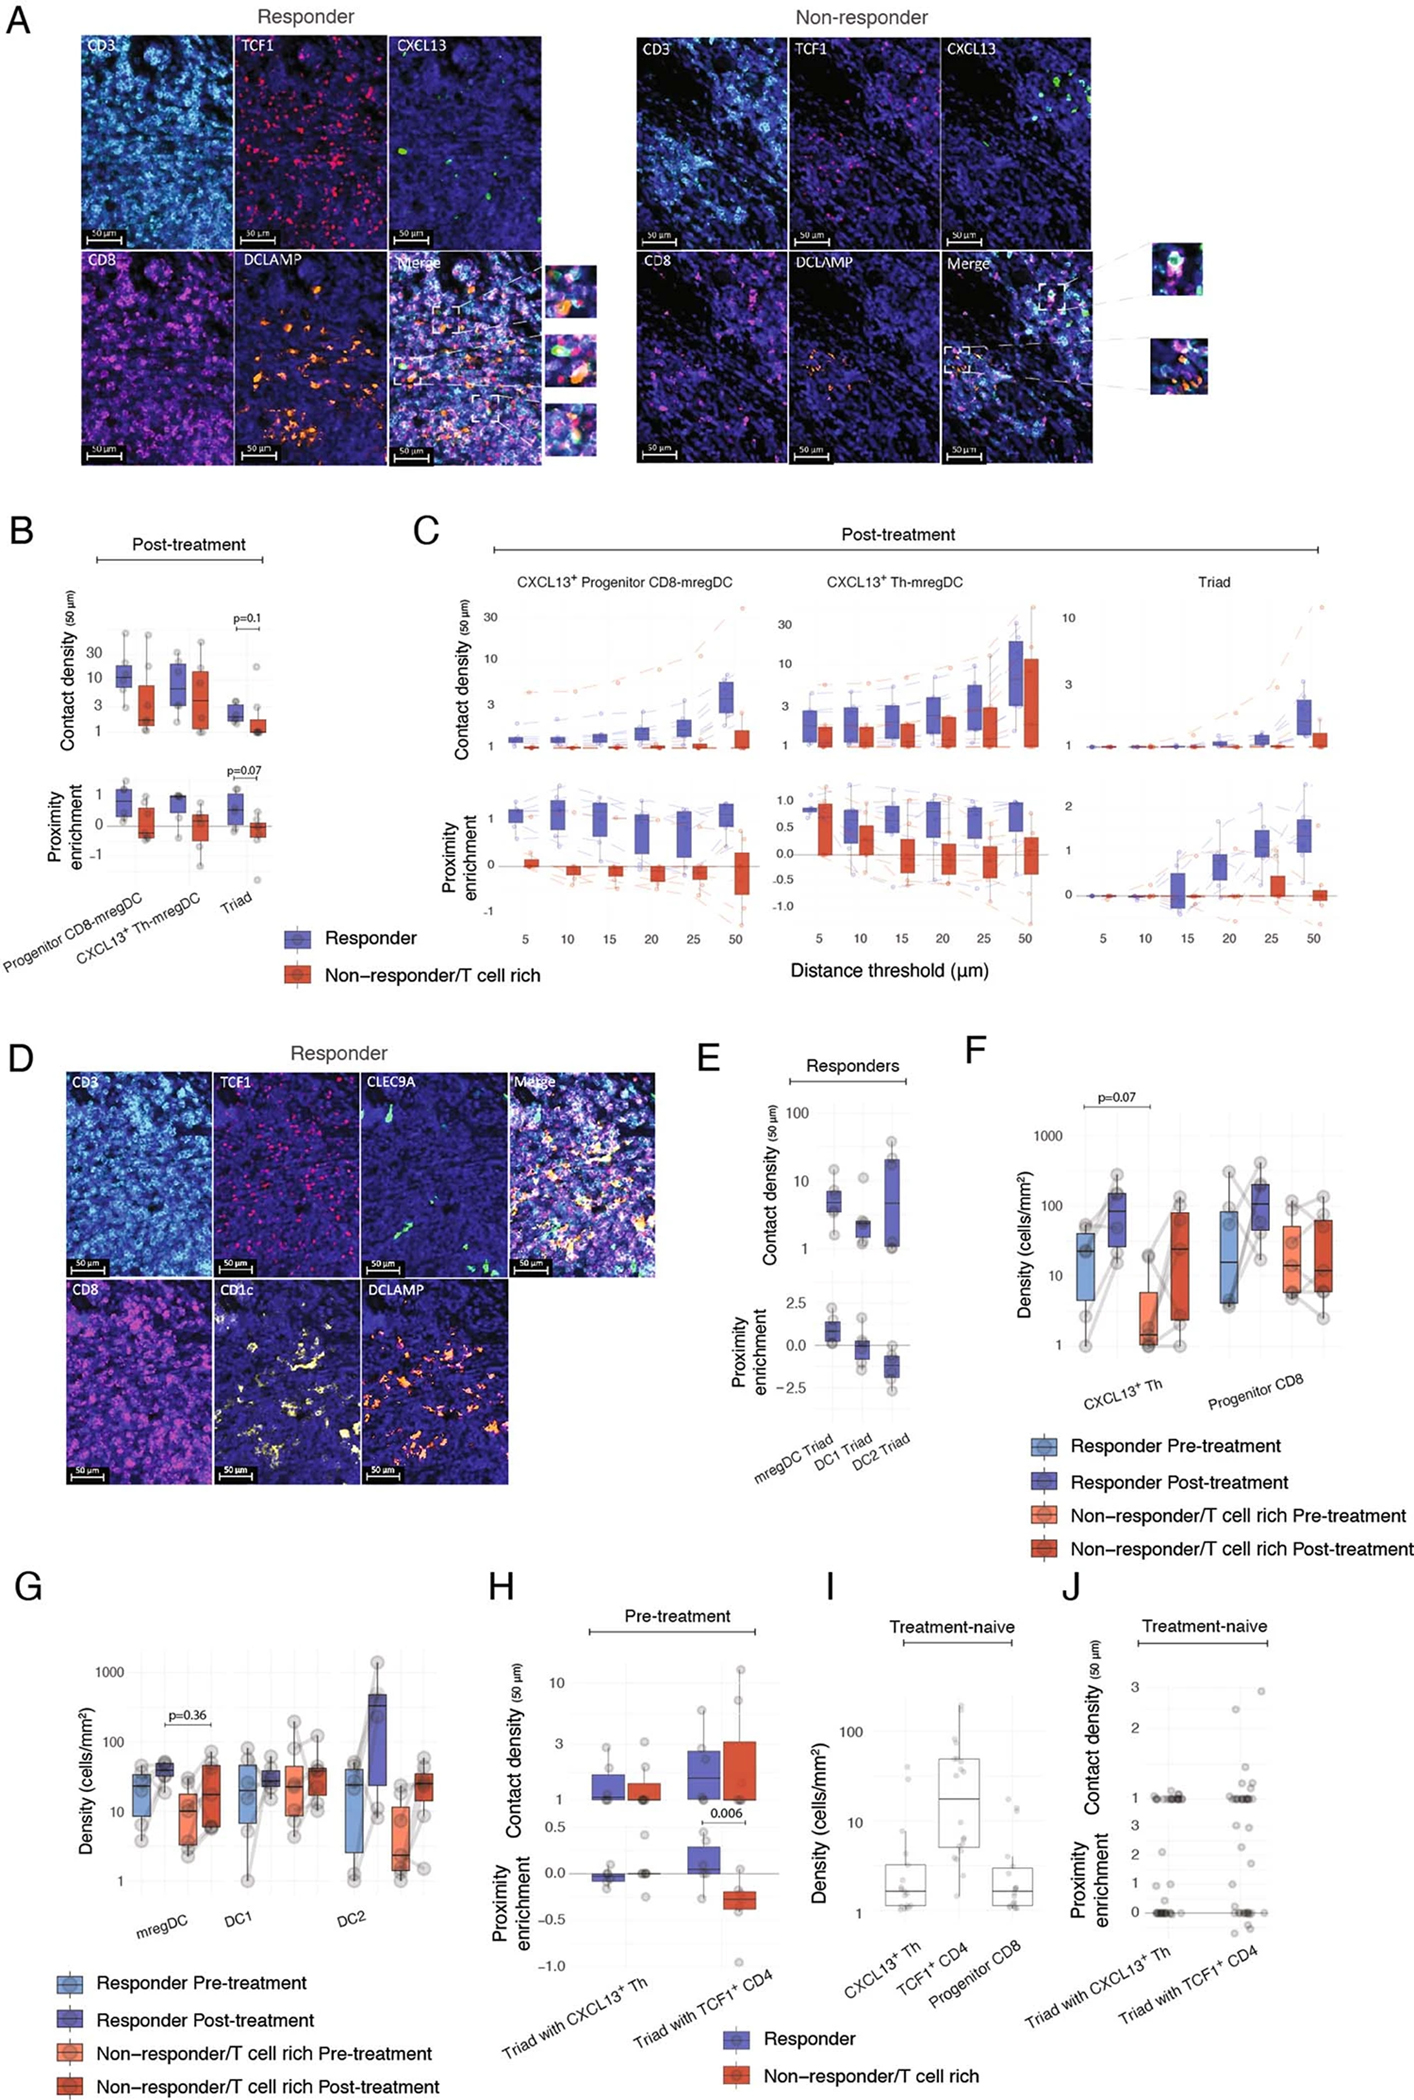
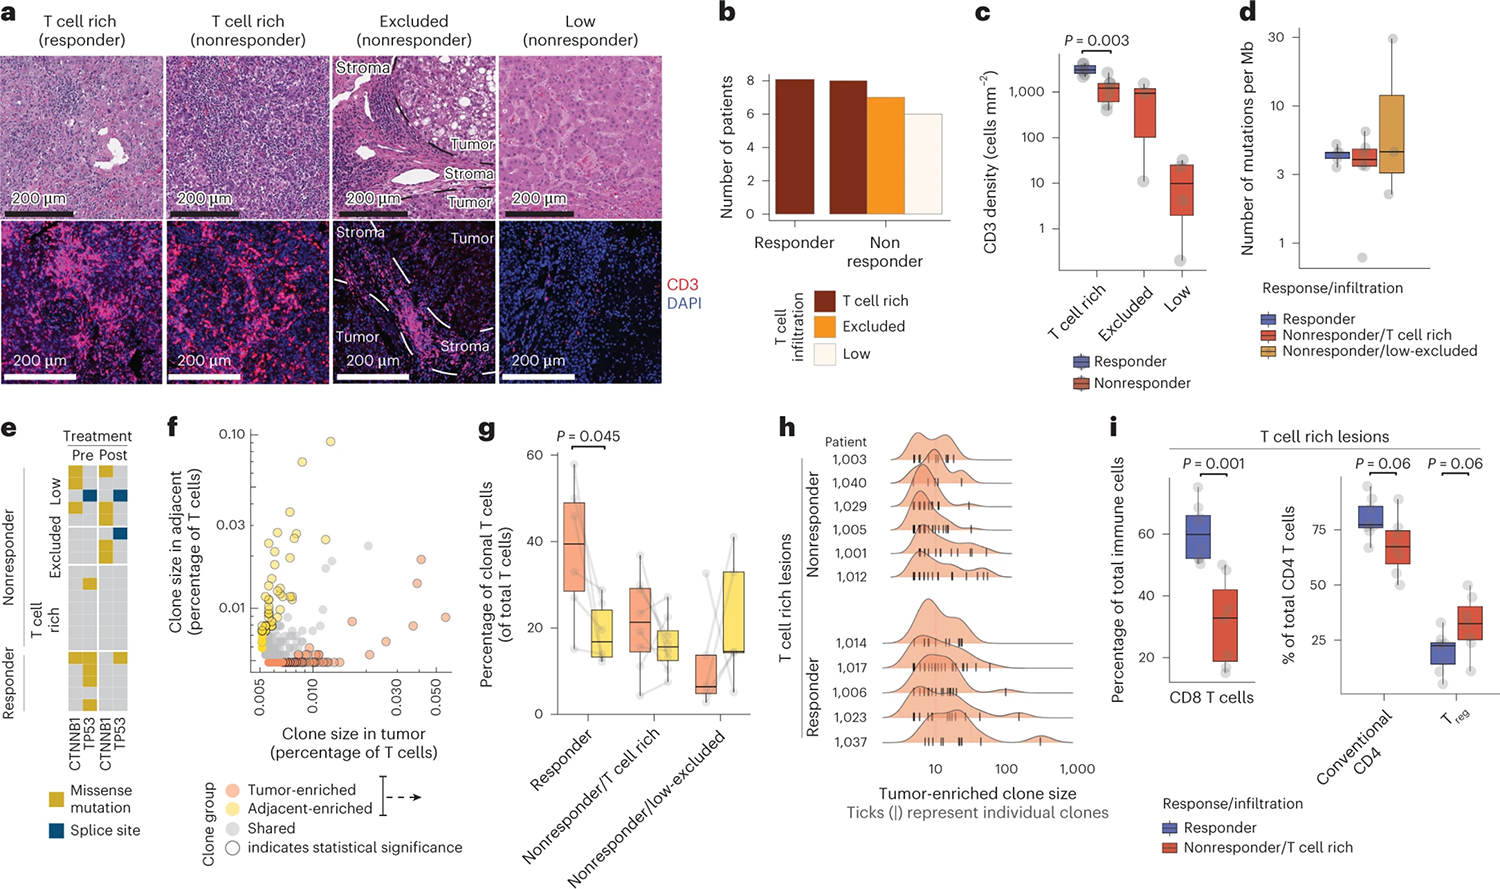
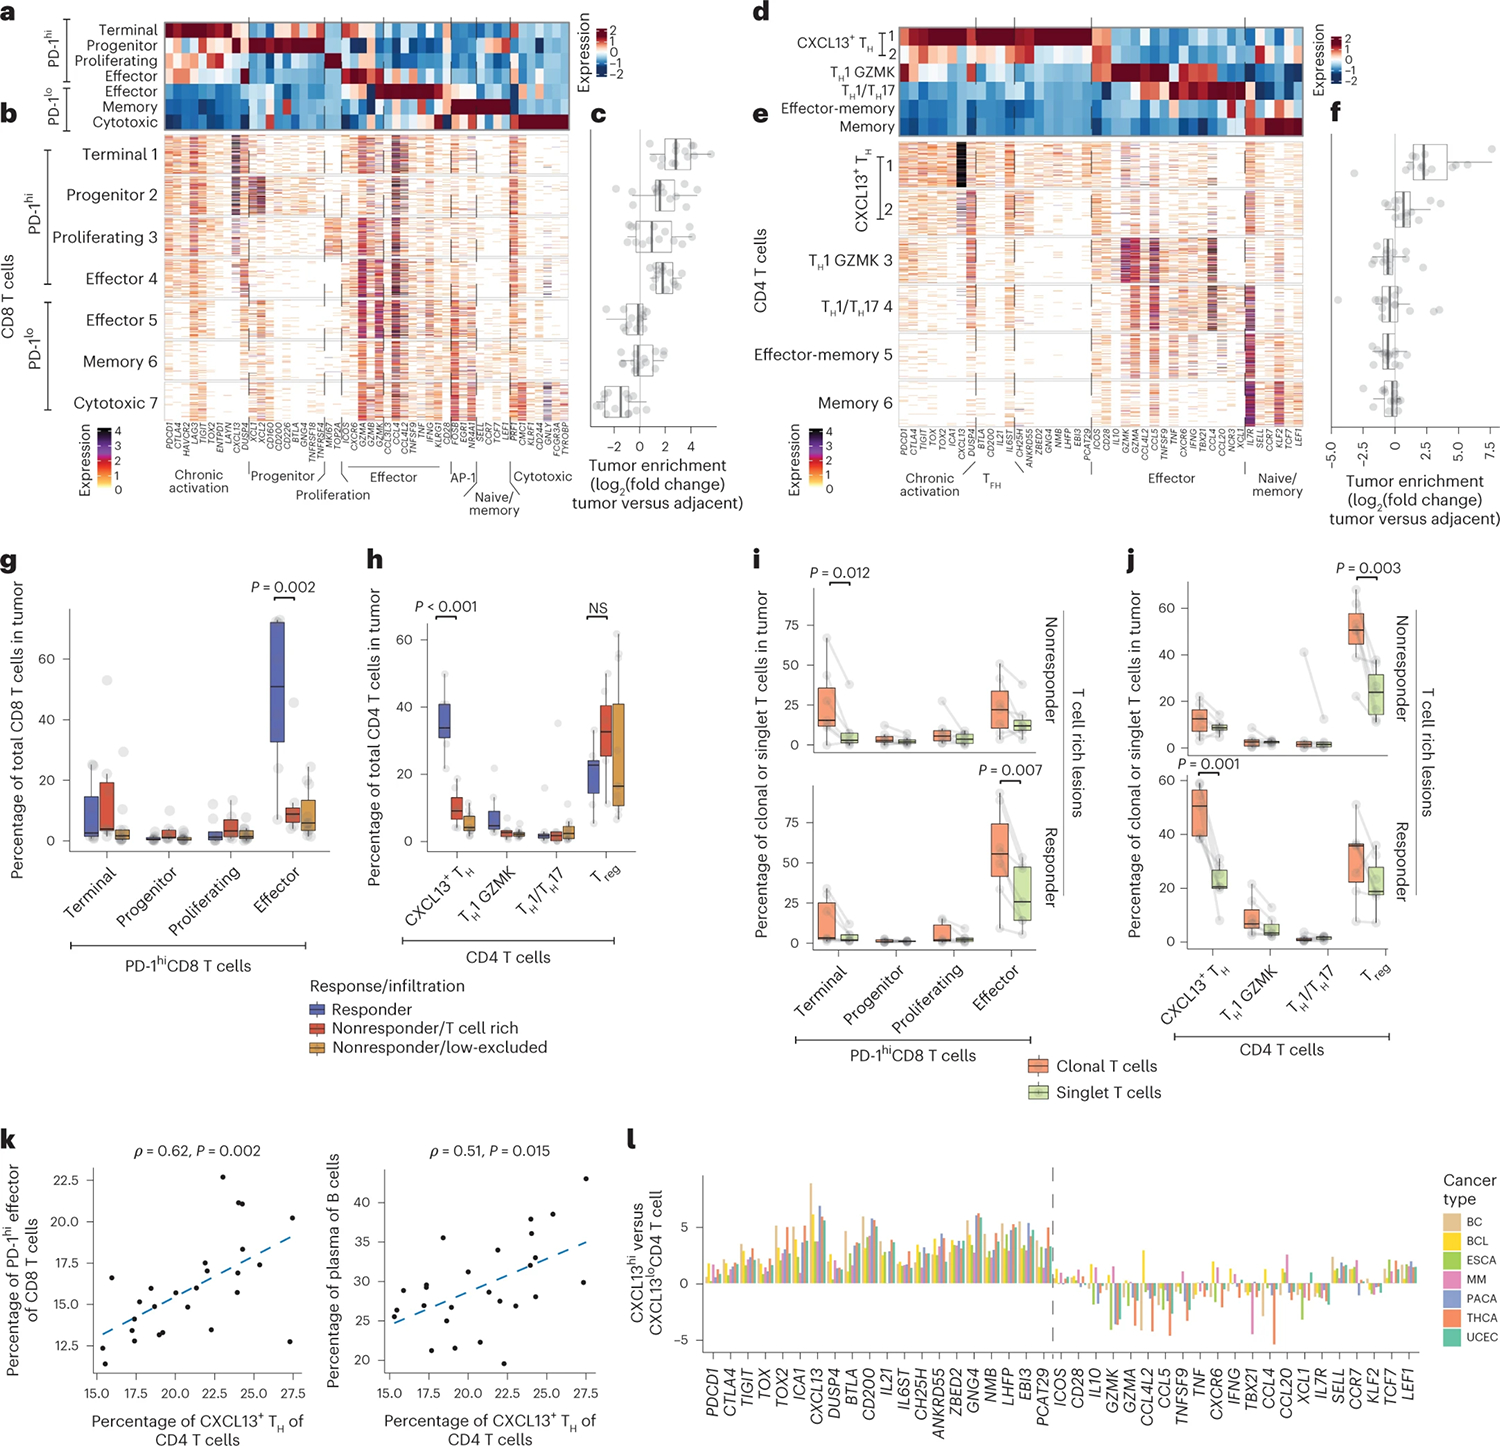
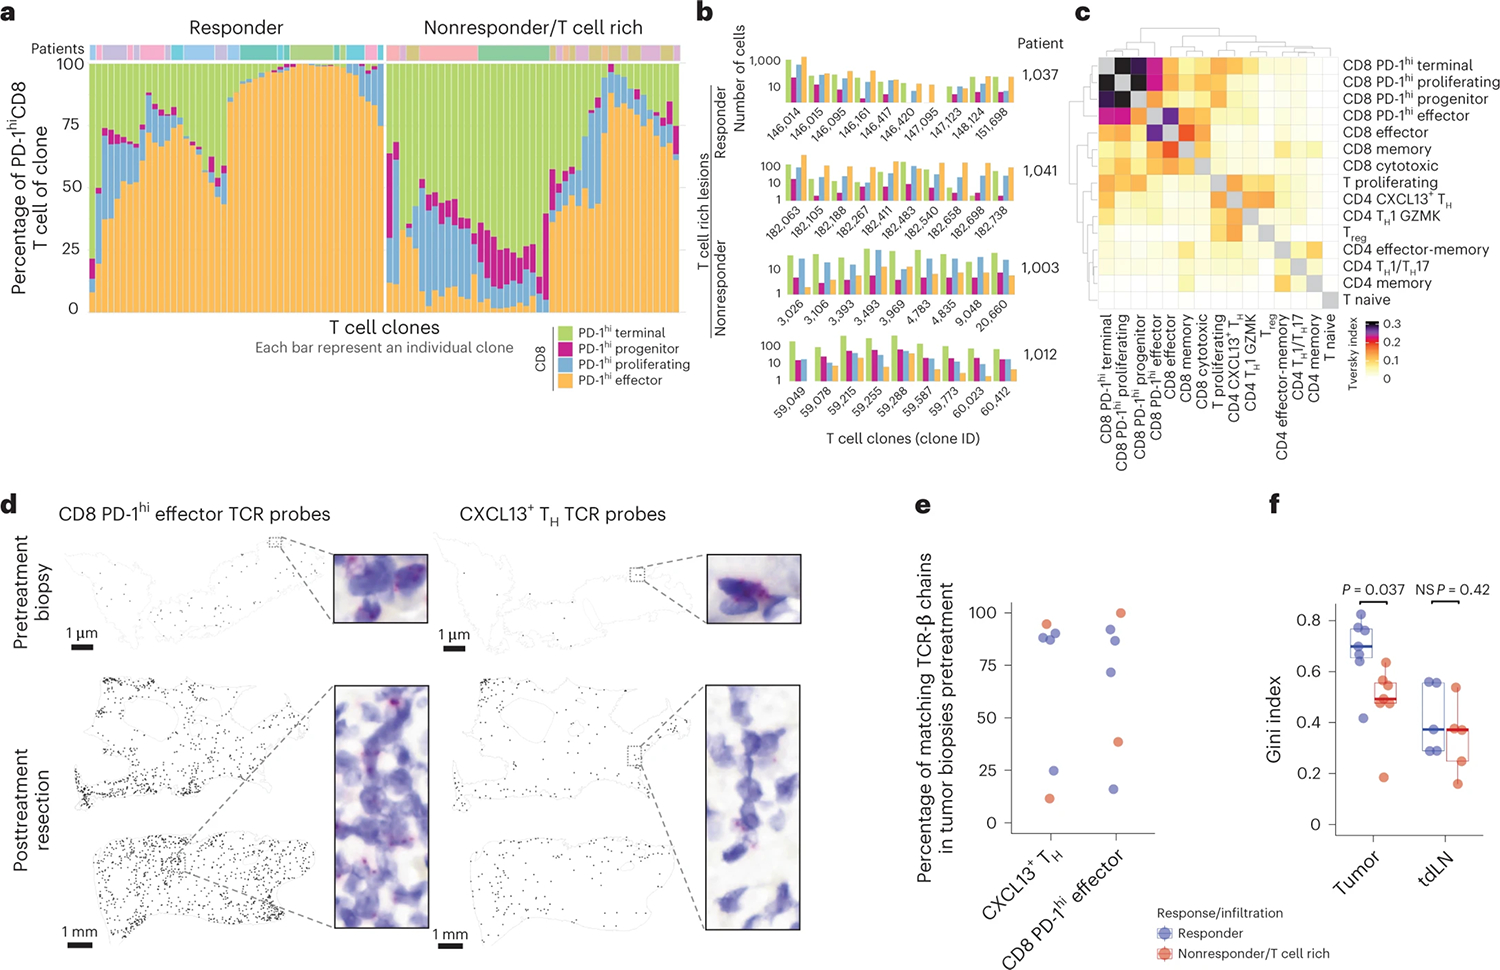
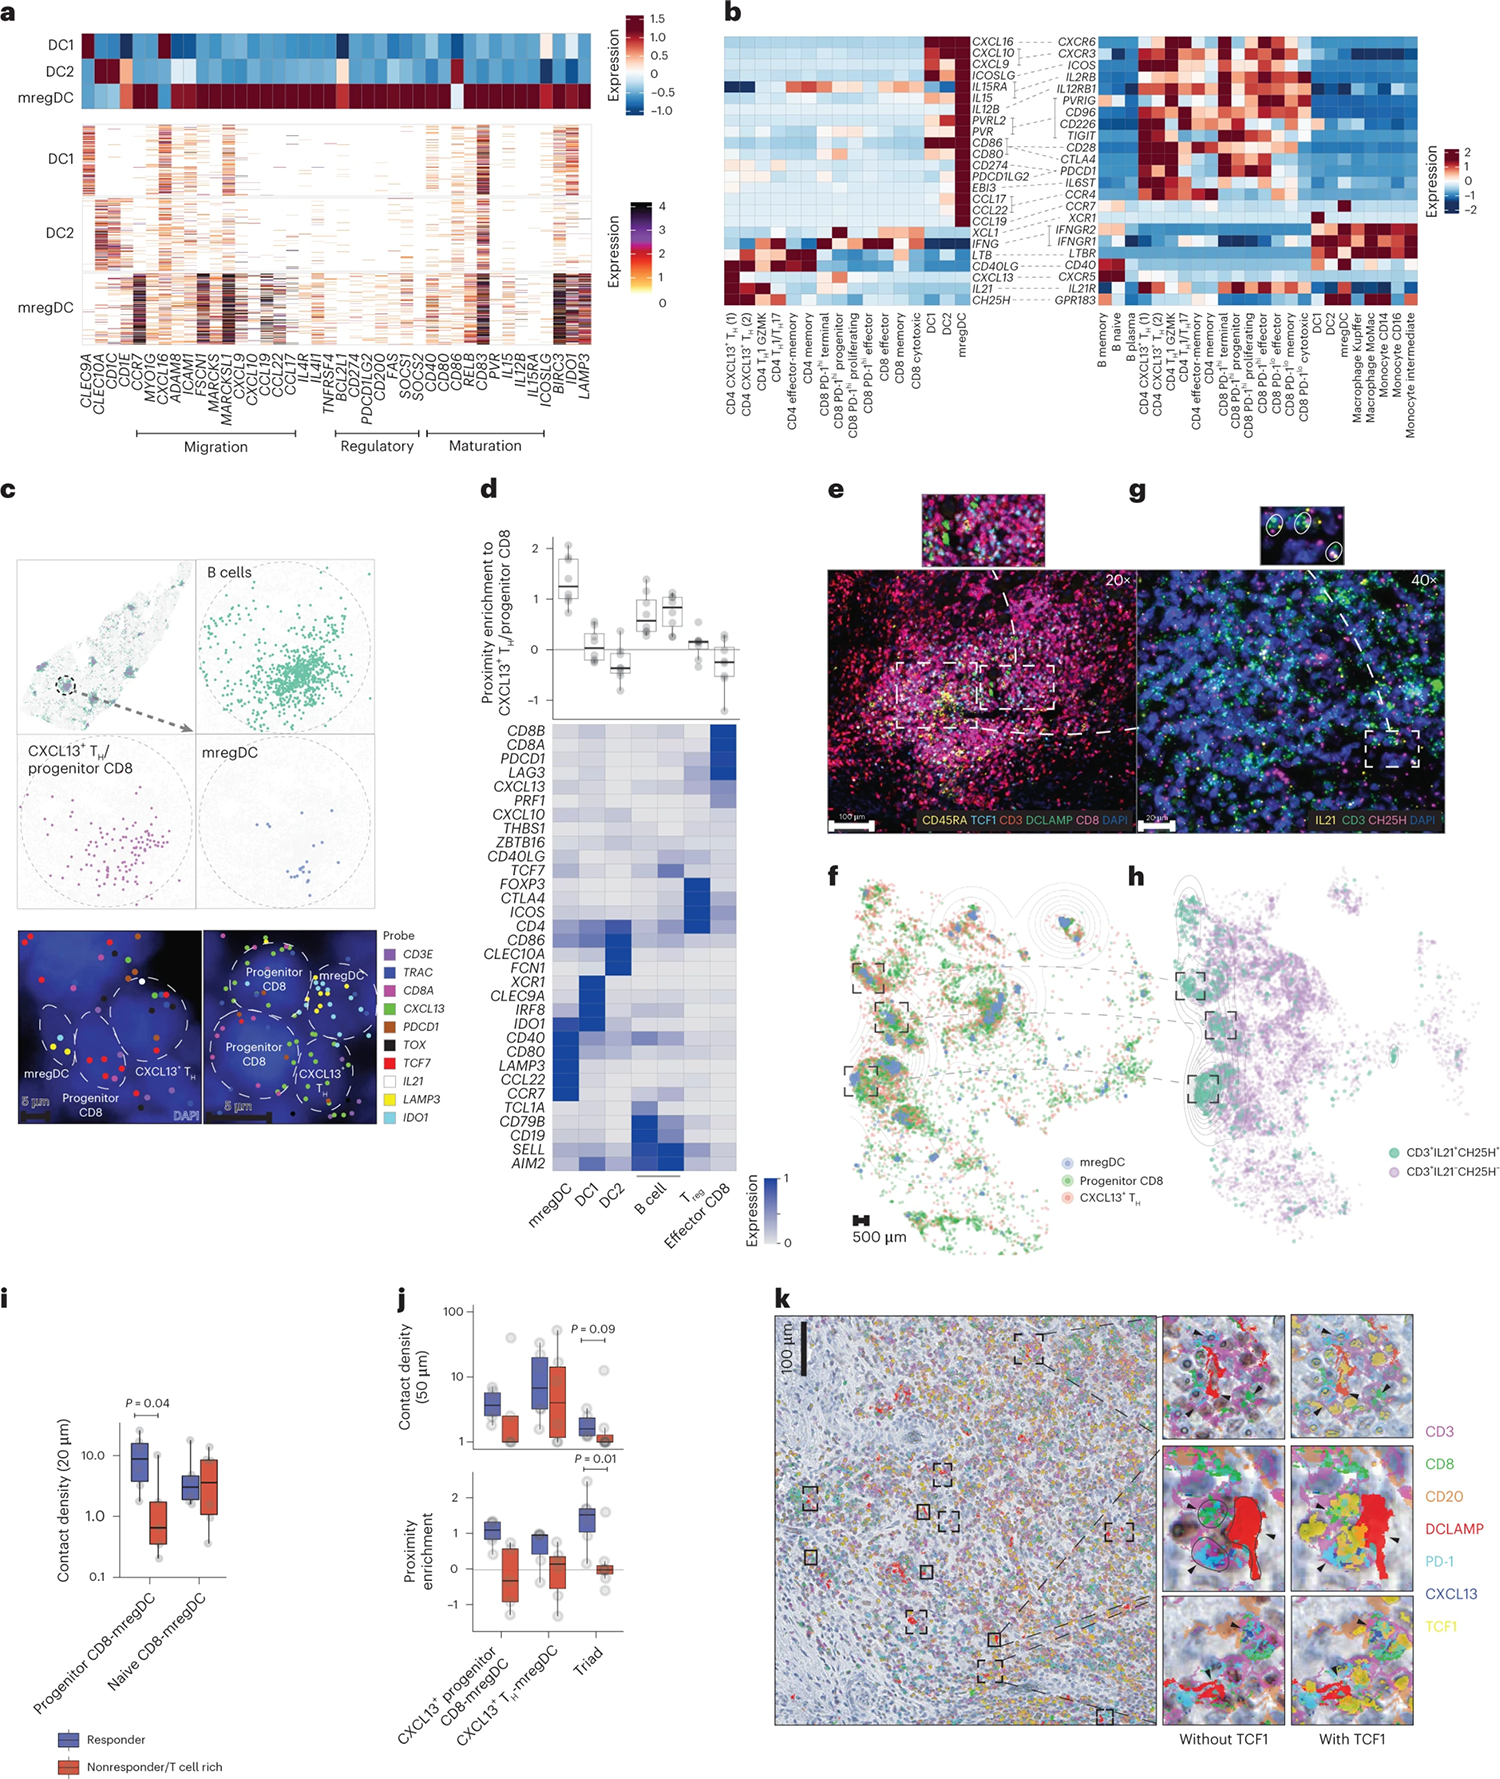
Despite no apparent defects in T cell priming and recruitment to tumors, a large subset of T cell rich tumors fail to respond to immune checkpoint blockade (ICB). We leveraged a neoadjuvant anti-PD-1 trial in patients with hepatocellular carcinoma (HCC), as well as additional samples collected from patients treated off-label, to explore correlates of response to ICB within T cell-rich tumors. We show that ICB response correlated with the clonal expansion of intratumoral CXCL13+CH25H+IL-21+PD-1+CD4+ T helper cells ("CXCL13+ TH") and Granzyme K+ PD-1+ effector-like CD8+ T cells, whereas terminally exhausted CD39hiTOXhiPD-1hiCD8+ T cells dominated in nonresponders. CD4+ and CD8+ T cell clones that expanded post-treatment were found in pretreatment biopsies. Notably, PD-1+TCF-1+ (Progenitor-exhausted) CD8+ T cells shared clones mainly with effector-like cells in responders or terminally exhausted cells in nonresponders, suggesting that local CD8+ T cell differentiation occurs upon ICB. We found that these Progenitor CD8+ T cells interact with CXCL13+ TH within cellular triads around dendritic cells enriched in maturation and regulatory molecules, or "mregDC". These results suggest that discrete intratumoral niches that include mregDC and CXCL13+ TH control the differentiation of tumor-specific Progenitor exhasuted CD8+ T cells following ICB.


Conflict of interest statement

Competing interests

M.M. serves on the scientific advisory board and holds stock from Compugen Inc., Myeloid Therapeutics Inc., Morphic Therapeutic Inc., Asher Bio Inc., Dren Bio Inc., Nirogy Inc., Oncoresponse Inc., Owkin Inc., DEMBIO and Larkspur Inc. M.M. serves on the scientific advisory board of Innate Pharma Inc., DBV Inc., Pionyr Inc., OSE Inc. and Genenta Inc. M.M. receives funding for contracted research from Regeneron Inc. and Boerhinger Ingelheim Inc. S.G. reports past consultancy or advisory roles for Merck and OncoMed; research funding from Regeneron Pharmaceuticals related to the current study, and research funding from Boehringer Ingelheim, Bristol Myers Squibb, Celgene, Genentech, EMD Serono, Pfizer and Takeda, unrelated to the current work. S.G. is a named coinventor on an issued patent (US20190120845A1) for multiplex immunohistochemistry to characterize tumors and treatment responses. The technology is filed through Icahn School of Medicine at Mount Sinai (ISMMS) and is currently unlicensed. This technology was used to evaluate tissue in this study and the results could impact the value of this technology. N. Fiaschi, B.K., M.D., L.L., C.A., M.N., Y.W., W.W., N.T.G., G.S.A., K.K., K.J.C., R.P.D. and G.T. are employees and shareholders of Regeneron Pharmaceuticals Inc. C.P., N. Fernandez and J.H. are employees and shareholders of Vizgen Inc. The remaining authors declare no competing interests.

Figures

Extended Data Fig. 1 |
Extended Data Fig. 1 |. Characterization of T cell rich HCC lesions in response to PD-1 blockade.
Surgically resected HCC lesions were isolated after two or more doses of PD-1 blockade and analyzed by H&E (N = 20 biologically independent samples) and single-cell RNA sequencing (scRNAseq N = 29 biologically independent samples). (A) Distribution of responders and nonresponders across HCC etiologies (Hep B: Hepatitis B; Hep C: Hepatitis C; NASH: Non-alcoholic steatohepatitis; ASH: Alcoholic steatohepatitis). (B) Quantification of immune aggregate areas and numbers stratified by response and T cell infiltration pattern (Two sided T test). (C) Expression of cluster-defining genes by scRNAseq of key immune populations, showing number of UMI per cell. (D) Differences of cluster frequencies between tumor and adjacent tissue (Two-sided T test, adjusted for multiple-hypotheses, Benjamini–Hochberg correction). Dots represent individual study subjects. The box plot center line represents the median; box limits represent the interquartile range (IQR); whiskers represent the minimum and maximum observations greater and lesser than the IQR plus 1.5×IQR, respectively.
Extended Data Fig. 2 |
Extended Data Fig. 2 |. Molecular profiling of expanded CD8+ and CD4+ T cell clones associated with response to PD-1 blockade.
Surgically resected HCC lesions were isolated after two or more doses of PD-1 blockade and analyzed by single-cell RNA and TCR sequencing (scRNAseq and scTCRseq, N = 29 and N = 21 biologically independent samples, respectively). (A, B) Expression of cluster-defining gene modules by scRNAseq for (A) CD8+ (B) CD4+ T cell clusters showing number of UMI per cell. (C, D) Cluster frequencies among (C) CD8+ and (D) CD4+ T cells in tumor and adjacent tissue, stratified by response and T cell infiltration pattern. (E) Cluster frequencies among PD-1lo CD8+ T cells in tumor among tumor-enriched clonal T cells and tumor singlet T cells, stratified by response and T cell infiltration pattern. (F) Cluster frequencies among CD4+ T cells in tumor among tumor-enriched clonal T cells and tumor singlet T cells, stratified by response and T cell infiltration pattern. Dots represent individual study subjects. The box plot center line represents the median; box limits represent the interquartile range (IQR); whiskers represent the minimum and maximum observations greater and lesser than the IQR plus 1.5 × IQR, respectively.
Extended Data Fig. 3 |
Extended Data Fig. 3 |. Phenotypic distribution among CD8+ T cell clones and clonality assessment in PBMC and tdLN.
(AC) Phenotypic analysis of clonotype sharing using scTCRseq. (A) Phenotypic distribution of all CD8+ T cell clusters in individual tumor-enriched clones (top 10 per patient) in responders and T cell rich non-responders. (B) Highlight of PD-1hi CD8+ phenotypic distribution for selected CD8+ clones across remaining patients not shown in Fig. 3B. (C) Expression of PD-1hi CD8+ cluster-defining genes by scRNAseq for CD8+ T cells from the selected clones of Fig. 3B for a responder patient, showing number of UMI per cell. (D) BaseScope TCR imaging using DapB (negative control) and PPIB (positive control) in pre-treatment core biopsies, surgical resection and control human tonsils. (E-G) Dynamic TCRseq of tumor lesions, PBMC and tdLN in responders and non-responders. (E) Number of post-treatment tumor-enriched clones present in pre-treatment tumor lesions analyzed using bulk TCRseq, and in PBMC and tdLN analyzed using scTCRseq, across responders and T cell rich non-responders. (F) Percent of post-treatment tumor-enriched clones in PBMC and tdLN, across responders and T cell rich non-responders (N = 7 PBMC and N = 11 tdLN biologically independent samples). (G) Histograms of clone size (number of cells per clone) distribution per patient, stratified by response and T cell infiltration pattern, separately in PBMC and tdLN. Each bar represents an individual clone.
Extended Data Fig. 4 |
Extended Data Fig. 4 |. Spatial localization of CXCL13+ Th, Progenitor CD8+ T cells and mregDC.
(A, B) CITEseq antibody sequencing analysis of DCs. (A) Expression of DC cluster-defining proteins by showing number of UMI per cell. (B) Gating of CD141 (as a marker of DC1) and CD1c (as a marker of DC2) among resting DC (left) and mregDCs (middle and right). (CI) Post treatment HCC tissue sections analyzed by MERFISH, multiplex IHC, IF and BaseScope for spatial distribution of T cell subsets and mregDC. (C) MERFISH factor analysis gene scores for selected factors, showing top 10 genes per factor. (D) Quantification of factor activation from (C), defined as average gene expression per cluster. (E) Densities of Progenitor (CD3+CD8+TCF1+ CD45RA) and naive (CD3+CD8+TCF1+ CD45RA+) CD8+ T cells among T cell rich lesions (N = 12 biologically independent samples. Two-sided T test. Dots represent individual study subjects. The box plot center line represents the median; box limits represent the interquartile range (IQR); whiskers represent the minimum and maximum observations greater and lesser than the IQR plus 1.5 × IQR, respectively). (F) IHC (left) and BaseScope analysis (right) of a representative immune aggregate in responder patient showing CD8+ clones accumulation (N = 1). (G, H) Spatial distribution of mregDC (DCLAMP+), Effector CD8+ T cell (CD3+CD8+TCF1 CD45RA), Effector CD4+ (CD3+CD8TCF1 CD45RA) and CXCL13+ Th (CD3+CD8TCF1+ CD45RA), and Progenitor CD8+ (CD3+CD8+TCF1+ CD45RA) and CXCL13+ Th (CD3+CD8TCF1+ CD45RA) in two different responder patients, showing computational rendering of IF with density contour annotation for mregDC (DCLAMP+). (I) Distribution of Progenitor (CD3+CD8+TCF1+ CD45RA) and Effector (CD3+CD8+TCF1 CD45RA) CD8+ T cell proximities to mregDC (DCLAMP+), showing histograms of individual cells from a representative responder, vertical gray bars represent the median.
Extended Data Fig. 5 |
Extended Data Fig. 5 |. Spatial localization of CXCL13+ Th, Progenitor CD8+ T cells and mregDC.
(AJ) Multiplex IF analysis of treatment-naïve HCC lesions (N = 20 biologically independent samples), Surgically resected HCC lesions during treatment with PD-1 blockade (N = 13 biologically independent samples) and HCC tumor biopsies (N = 13 biologically independent samples). (A) Representative images of an mregDC niche, analyzed by IF for T cell markers, in a representative responder (left) and T cell rich non-responder (right). (B) Spatial proximity enrichment analysis of Progenitor CD8+ (CD3+CD8+TCF1+), CXCL13+ Th (CD3+CD8CXCL13+) and mregDC (DCLAMP+) post-treatment (Two-sided Mann–Whitney U test). (C) Robustness analysis showing spatial proximity patterns across increasing distance thresholds, for pairs and triads post-treatment. (D) Representative images of a niche, analyzed by IF for DC subsets including DC1 (CLEC9A), DC2 (CD1c) and mregDC (DCLAMP). (E) Spatial proximity enrichment analysis showing contact densities (top) and relative enrichment (bottom) at distance of up to 50 μm between Progenitor CD8+ T cell (CD3+CD8+TCF1+) and CXCL13+ Th (CD3+CD8TCF1+) triads with mregDC (DCLAMP+), DC1 (CLEC9A+) and DC2 (CD1C+), in 6 responders post-treatment. (F-G) Cellular densities of (F) Progenitor CD8+ T cells (CD3+CD8+TCF1+) and CXCL13+ Th (CD3+CD8CXCL13+) and (G) mregDC (DCLAMP+), DC1 (CLEC9A+) and DC2 (CD1C+) across responders, T cell rich non-responders, pre and post-treatment (Two-sided Mann–Whitney U test). (H) Spatial proximity enrichment analysis of Progenitor CD8+ T cells (CD3+CD8+TCF1+) and mregDC (DCLAMP+) with CXCL13+ Th (CD3+CD8CXCL13+) or TCF1+ CD4+ T cells (CD3+CD8TCF1+) in pre-treatment biopsies (Two-sided Mann–Whitney U test). (I) Cellular densities of CXCL13+ Th (CD3+CD8CXCL13+), TCF1+ CD4+ T cells (CD3+CD8TCF1+) and Progenitor CD8+ T cells (CD3+CD8+TCF1+) in treatment-naive patients. (J) Spatial proximity enrichment analysis of Progenitor CD8+ T cells (CD3+CD8+TCF1+) and mregDC (DCLAMP+) with CXCL13+ Th (CD3+CD8CXCL13+) or TCF1+ CD4+ T cells (CD3+CD8TCF1+) in treatment-naive patients. Dots represent individual study subjects. The box plot center line represents the median; box limits represent the interquartile range (IQR); whiskers represent the minimum and maximum observations greater and lesser than the IQR plus 1.5×IQR, respectively.
Fig. 1 |
Fig. 1 |. A subset of T cell rich tumors failed to respond to PD-1 blockade.
ai, Surgically resected HCC lesions were isolated after two or more doses of PD-1 blockade and analyzed by H&E (n = 20 biologically independent samples), IF (n = 20 biologically independent samples), scRNA-seq and scTCR-seq (n = 28 and n = 21 biologically independent samples, respectively), and whole-exome sequencing (WES, n = 20 biologically independent samples). HCC tumor biopsies (n = 20 biologically independent samples) were collected before neoadjuvant PD-1 blockade and analyzed by WES. ac, Assessment of T cell spatial distribution patterns in HCC by H&E and IF. a, H&E (upper) and CD3 IF (lower) of representative tumor lesions across distinct T cell infiltration patterns. b, Distribution of T cell infiltration pattern across responders and nonresponders. c, Distribution of CD3+ T cell density by IF across responders and nonresponders stratified by T cell infiltration pattern (two-sided t-test). d,e, Mutational analysis of tumor lesions using WES. d, TMB quantification across responders and nonresponders stratified by T cell infiltration pattern. e, Mutational status of β-catenin (CTNNB1) and p53 (TP53) across patient groups, pre- and post-treatment. fi, scRNA-seq and scTCR-seq analysis of T cell clonality across the tumor and adjacent tissues. f, Frequencies and classification of unique TCR observed by scTCR-seq in tumor (x axis) or adjacent tissues (y axis) in a representative sample. g, Frequencies of clonal T cells mapping to tumor and adjacent tissues enriched from f, stratified by response and immune infiltration pattern (two-sided t-test). h, Histograms of clone size (number of cells per clone) distribution in tumor per patient, stratified by response and T cell infiltration pattern. Ticks represent individual clones. i, Cellular abundances by scRNA-seq for CD8+ T cells (left) and conventional and regulatory CD4+ T cells (right) across responders and T cell rich nonresponders (two-sided t-test, adjusted for multiple hypotheses, Benjamini–Hochberg correction). Dots represent individual study participants. The box plot center line represents the median; box limits represent the interquartile range (IQR); whiskers represent minimum and maximum observations greater and less than the IQR plus 1.5× IQR, respectively.
Fig. 2 |
Fig. 2 |. Responders are characterized by a distinct molecular phenotype of CD8+ and CD4+ T cells clonally expanded in a tumor-specific manner.
al, Surgically resected HCC lesions were isolated after two or more doses of PD-1 blockade and analyzed by scRNA-seq and scTCR-seq (n = 28 and n = 21 biologically independent samples, respectively). ac, Expression profiling of CD8+ T cell cluster-defining genes by scRNA-seq showing (a) column-standardized average expression, (b) number of unique molecular identifiers (UMIs) per cell and (c) CD8+ cluster frequency enrichment in tumor versus adjacent tissue. df, Expression profiling of CD4+ T cell cluster-defining genes by scRNA-seq showing (d) column-standardized average expression, (e) number of UMI per cell and (f) CD4+ cluster frequency enrichment in tumor versus adjacent tissue. g,h, Cluster frequencies stratified by response and immune infiltration pattern in tumor samples for (g) PD-1hiCD8+ T cells and (h) CD4+ T cells (two-sided t-test, adjusted for multiple hypotheses, Benjamini–Hochberg correction), NS, not significant. i,j, Cluster frequencies among tumor-enriched and tumor singlet clones stratified by response and T cell infiltration pattern in tumor samples for key (i) CD8+ T cells and (j) CD4+ T cell clusters (two-sided t-test, adjusted for multiple hypotheses, Benjamini–Hochberg correction). k, Correlation between cellular abundances of CXCL13+ TH to PD-1hi Effector CD8+ T and B cells by scRNA-seq (two-sided t-test). l, Analysis of CXCL13+ TH transcriptional pattern across cancer types from external datasets. Showing log2(fold change) between CXCL13hi TH and CXCL13lo TH, for CD4+ molecules from de by scRNA-seq. BC, breast cancer; BCL, B cell lymphoma; ESCA, esophageal cancer; MM, multiple myeloma; PACA, pancreatic cancer; UCEC, uterine corpus endometrial carcinoma; THCA, thyroid carcinoma. Dots represent individual study participants. The box plot center line represents the median; box limits represent the IQR; whiskers represent the minimum and maximum observations greater and less than the IQR plus 1.5× IQR, respectively.
Fig. 3 |
Fig. 3 |. Local expansion of CD4+ and CD8+ T cells in the tumor upon PD-1 blockade.
ac, Phenotypic analysis of clonotype sharing by scTCR-seq. a, Phenotypic distribution of PD-1hi CD8+ T cells in individual tumor-enriched clones (top ten per patient), separately for responders and T cell rich nonresponders. b, Highlight of CD8+ phenotypic distribution for selected CD8+ clones from selected patients. c, Trevsky index of TCR sharing across T cell clusters in tumor. d, BaseScope TCR imaging analysis of eight selected tumor-enriched clones in a responder patient (n = 1). Spatial distribution of four CD8+ T cell and four CD4+ T cell clones across biopsy and resection sample. e,f, Pretreatment biopsies analyzed by Bulk TCR-seq and scTCR-seq of tdLN from time of resection. e, Percent of post-treatment tumor-enriched clones present in pretreatment tumor lesions by Bulk TCR-seq and tdLN by scTCR-seq, across responders and T cell rich nonresponders. f, Gini inequality index measure for T cell clonal expansion for clonal expansion in tumor and tdLN across responders and T cell rich nonresponders (n = 14 tumor and n = 10 tdLN biologically independent samples; two-sided t-test). Dots represent individual study participants. The box plot center line represents the median; box limits represent the IQR; whiskers represent the minimum and maximum observations greater and less than the IQR plus 1.5× IQR, respectively.
Fig. 4 |
Fig. 4 |. Cellular triads of mregDC, Progenitor CD8 and CXCL13+ TH producing IL-21 and CH25H associate with response to PD-1 blockade.
a, scRNA-seq analysis of DC cluster-defining genes, showing relative expression among DC (upper) and number of UMI per cell (lower). b, Ligand–receptor pair expression analysis across CXCL13+ TH, Progenitor CD8 T cells, DC and B cell clusters, showing average gene expression by scRNA-seq. c,d, MERFISH analysis of tumor slides across three responders and three nonresponders. c, Spatial distribution of selected phenotypes at different magnification levels, showing computational rendering of cell localization (upper) and raw probe detection (lower) in two representative responder patients. d, Expression of cluster-characteristic genes, showing average expression (lower) and proximity enrichment of mregDC, DC1, DC2, B cell, Treg, Effector CD8 to CXCL13+ TH/Progenitor CD8 cells across patients per cluster (upper). n = 6 biologically independent samples. ek, Characterization of the cellular triads using multiplex IF (e,f,i,j), RNAscope (g,h), IHC using MICSSS (k). e,f, Representative multiplex IF image analysis showing mregDC and T cell phenotypes in a representative responder (e) and whole-slide computational rendering of mregDC (DC-LAMP+), Progenitor CD8 T cell (CD3+CD8+TCF1+CD45RA) and CXCL13+ TH (CD3+CD8TCF1+CD45RA) from e (f). g, Characterization of CXCL13+ TH phenotypes by RNAscope in a representative niche from e (of n = 19 biologically independent samples). h, Spatial distribution of CD3+IL21+CH25H+ T cell phenotypes and CD3+IL21CH25H/CD3IL21+CH25H+ controls in a representative patient from f, showing computational rendering of RNAscope with density contour annotation for CD3+IL21+CH25H+ cells. i, Quantification of contact (distance of up to 20 μm) density of Progenitor (CD3+CD8+TCF1+CD45RA) and naive (CD3+CD8+TCF1+CD45RA+) CD8 T cells with mregDC (DC-LAMP+) in six responders and six nonresponders analyzed as in e (n = 12 biologically independent samples. Two-sided t-test). j, Spatial proximity enrichment analysis showing contact densities (upper) and relative enrichment (lower) at a distance of up to 50 μm between CXCL13+ Progenitor CD8 (CD3+CD8+TCF1+CXCL13+) and CXCL13+ TH (CD3+CD8CXCL13+) to mregDC (DC-LAMP+) post-treatment (n = 13 biologically independent samples. Two-sided Mann–Whitney U-test). k, MICSSS analysis of the spatial distribution of Progenitor CD8 (CD3+CD8+TCF1+PD-1+) and CXCL13+ TH (CD3+CD8CXCL13+) triads with mregDC (DC-LAMP+) in a representative responder patient (of n = 20 biologically independent samples). Dots represent individual study participants. The box plot center line represents the median; box limits represent the IQR; whiskers represent the minimum and maximum observations greater and less than the IQR plus 1.5× IQR, respectively.

Similar articles

Cited by

References

    1. Tabrizian P, Jibara G, Shrager B, Schwartz M & Roayaie S Recurrence of hepatocellular cancer after resection: patterns, treatments, and prognosis. Ann. Surg. 261, 947–955 (2015). - PubMed
    1. Shindoh J et al. Risk factors of post-operative recurrence and adequate surgical approach to improve long-term outcomes of hepatocellular carcinoma. HPB (Oxford) 15, 31–39 (2013). - PMC - PubMed
    1. Chalabi M et al. Neoadjuvant immunotherapy leads to pathological responses in MMR-proficient and MMR-deficient early-stage colon cancers. Nat. Med. 26, 566–576 (2020). - PubMed
    1. Forde PM et al. Neoadjuvant PD-1 blockade in resectable lung cancer. N. Engl. J. Med. 378, 1976–1986 (2018). - PMC - PubMed
    1. Huang AC et al. A single dose of neoadjuvant PD-1 blockade predicts clinical outcomes in resectable melanoma. Nat. Med. 25, 454–461 (2019). - PMC - PubMed

MeSH terms

Substances