. 2023 Jun;29(6):1520-1529.
doi: 10.1038/s41591-023-02372-x. Epub 2023 Jun 15.

Antigen-driven colonic inflammation is associated with development of dysplasia in primary sclerosing cholangitis

Affiliations

Antigen-driven colonic inflammation is associated with development of dysplasia in primary sclerosing cholangitis

Dustin G Shaw et al. Nat Med. 2023 Jun.

Abstract

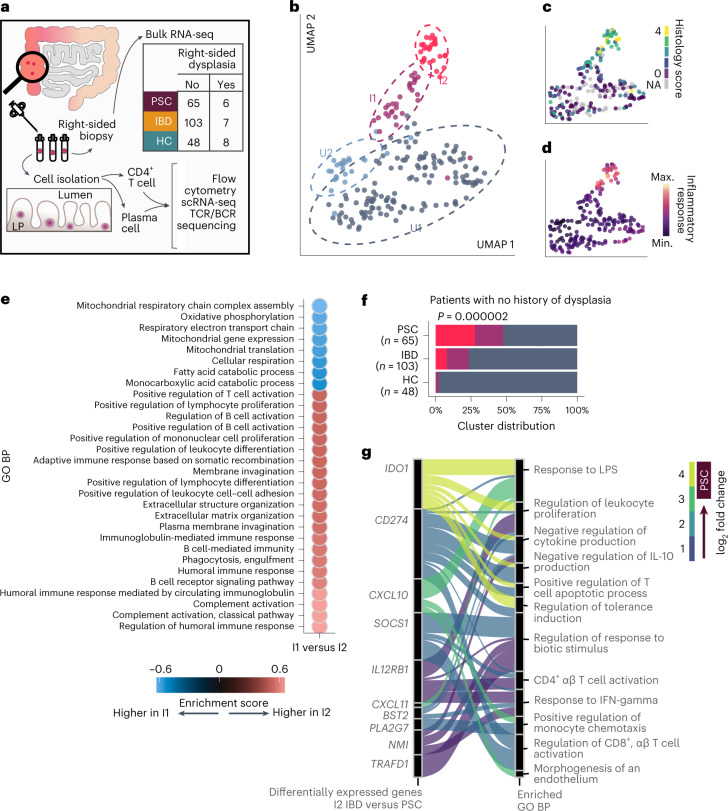
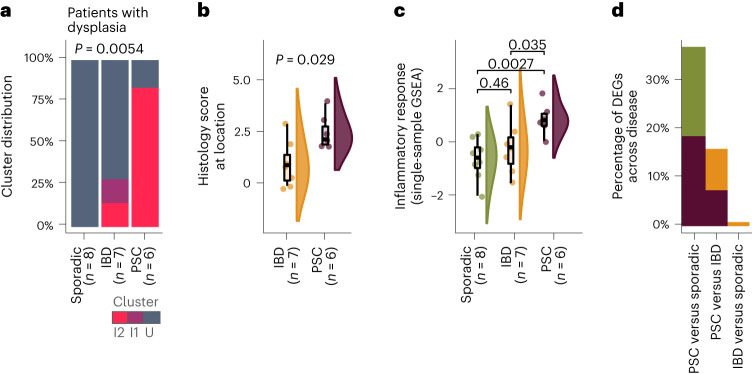
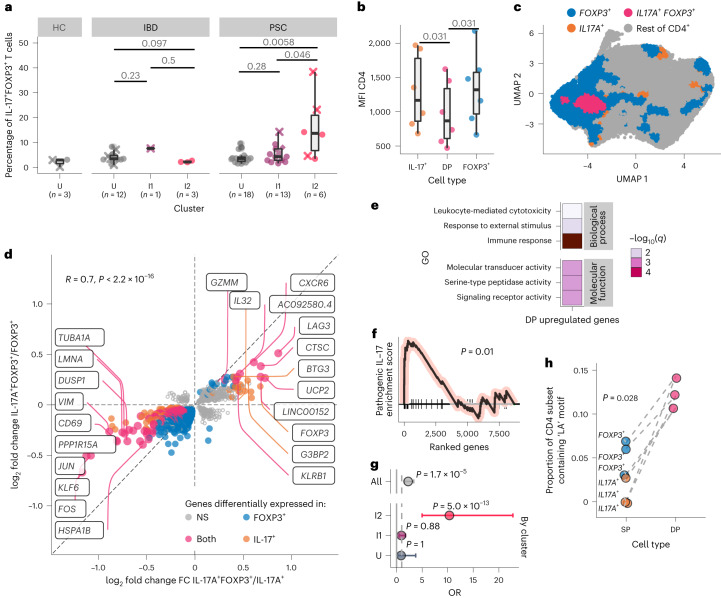
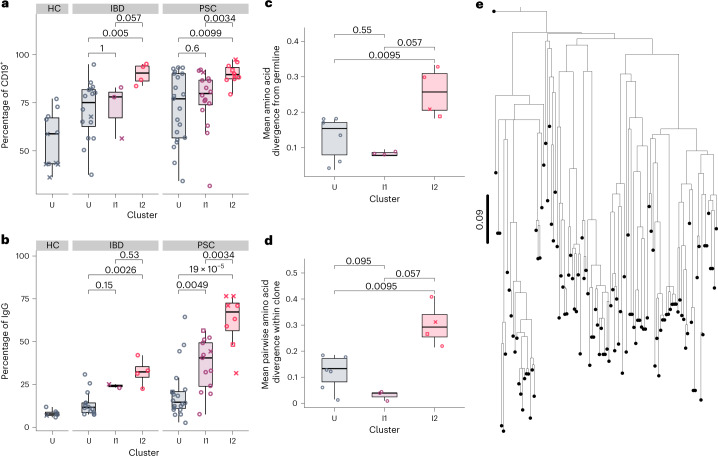
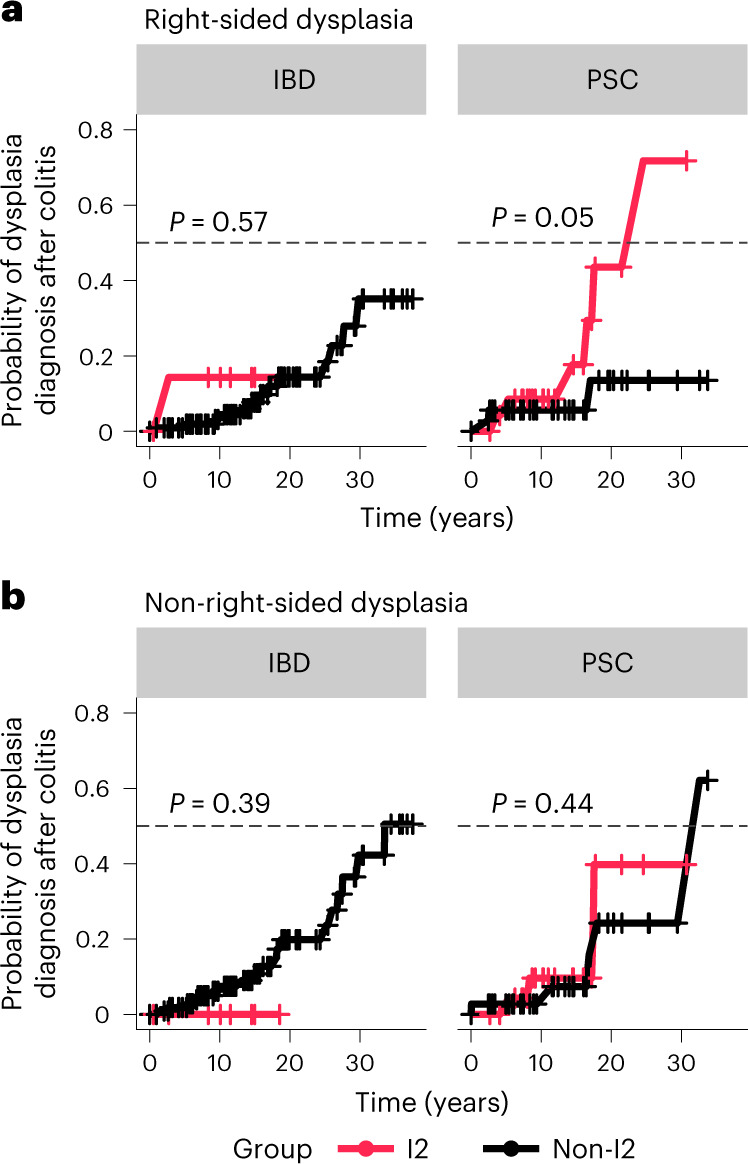
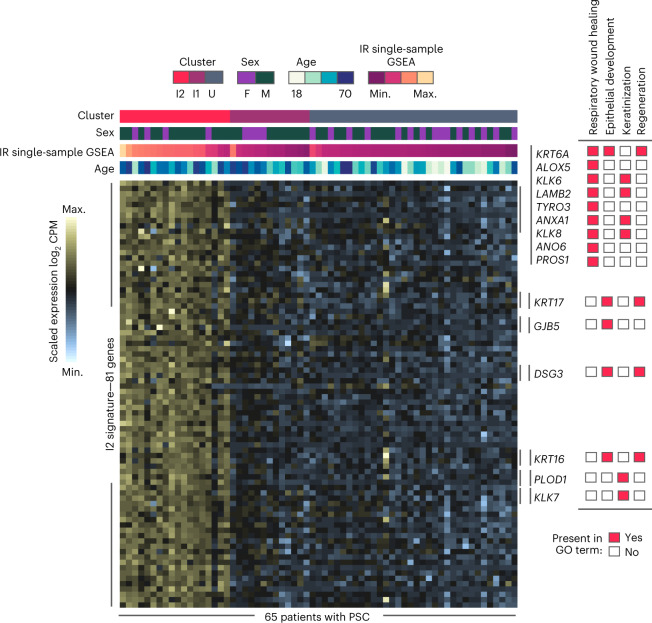
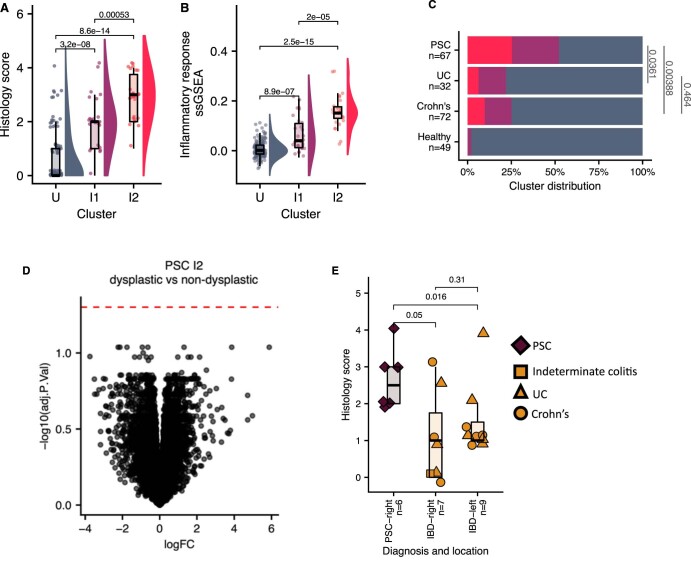
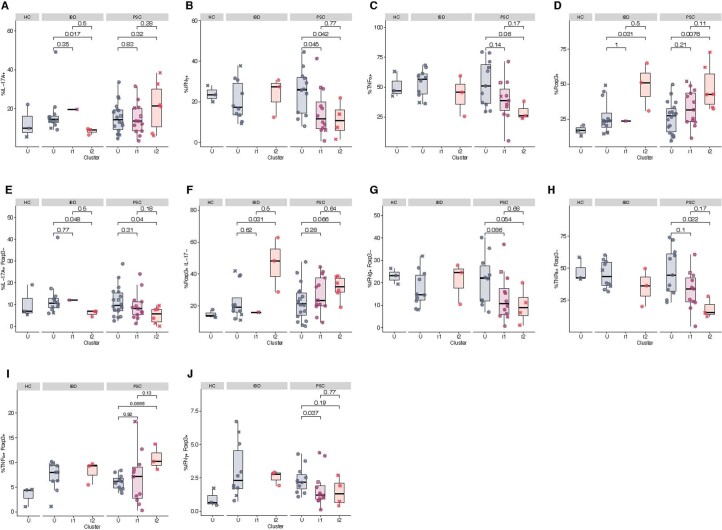
Primary sclerosing cholangitis (PSC) is an immune-mediated disease of the bile ducts that co-occurs with inflammatory bowel disease (IBD) in almost 90% of cases. Colorectal cancer is a major complication of patients with PSC and IBD, and these patients are at a much greater risk compared to patients with IBD without concomitant PSC. Combining flow cytometry, bulk and single-cell transcriptomics, and T and B cell receptor repertoire analysis of right colon tissue from 65 patients with PSC, 108 patients with IBD and 48 healthy individuals we identified a unique adaptive inflammatory transcriptional signature associated with greater risk and shorter time to dysplasia in patients with PSC. This inflammatory signature is characterized by antigen-driven interleukin-17A (IL-17A)+ forkhead box P3 (FOXP3)+ CD4 T cells that express a pathogenic IL-17 signature, as well as an expansion of IgG-secreting plasma cells. These results suggest that the mechanisms that drive the emergence of dysplasia in PSC and IBD are distinct and provide molecular insights that could guide prevention of colorectal cancer in individuals with PSC.


Conflict of interest statement

The authors declare no competing interests.

Figures

Fig. 1
Fig. 1. A subset of patients with PSC with no history of dysplasia show a unique and highly inflamed transcriptional profile.
a, Graphical representation of the methodology of this study. To control for biological differences across the span of the colon, we collected 8–10 tissue biopsies only from the right colon. Our patient cohort included patients with PSC, patients with IBD with a history of right-sided colitis and patients with no history of IBD or PSC (HCs). Patients were retrospectively determined to have right-sided dysplasia. From one biopsy, we isolated RNA for whole-tissue bulk RNA-seq. The remainder of the biopsies were mechanically and enzymatically disrupted to isolate lamina propria CD4+ T cells and plasma cells for analysis via flow cytometry, scRNA-seq, and TCR and B cell receptor (BCR) analysis. bd, Uniform manifold approximation and projection (UMAP) plots using right colon tissue samples from individuals with no history of dysplasia at the time of sample collection (n = 65 with PSC, n = 103 with IBD, n = 48 HCs). Samples are annotated by transcriptionally determined cluster (b), histologically scored inflammation (c) or inflammatory response gene set enrichment score (d). e, Dot plot showing the top 30 most significantly enriched GO biological processes (BPs) (GSEA test q < 0.1 × 10−9) between the I2 and I1 clusters; the color represents the enrichment score and direction of effect. f, Distribution of individuals across clusters among individuals without dysplasia; statistical significance was determined using a chi-squared test. Red corresponds to cluster I2, purple to cluster I1 and blue to cluster U (combined U1 and U2). g, Alluvial plot connecting the top enriched GO BPs with the significantly upregulated genes in I2 PSC versus I2 IBD; connections are colored according to fold change. Max., maximum; min., minimum.
Fig. 2
Fig. 2. The colonic dysplasia landscape of PSC is enriched in the I2 signature and differs from that of IBD.
ad, Patients with active right-sided dysplasia were analyzed (n = 6 with PSC, n = 7 with IBD, n = 8 sporadic). a, Distribution of individuals with right colon dysplasia across clusters; statistical significance was determined using a chi-squared test. b, Histologically scored inflammation at the site of dysplasia within the right colon using the UCM histological criteria for grading disease activity: 0, no diagnostic abnormality; 1, quiescent or minimally active; 2, mild; 3, moderate; and 4, severe. The right colon includes the cecum, ascending colon and hepatic flexure. Significance was determined using a double-sided Wilcoxon rank-sum test. c, Single-sample gene set enrichment analysis (GSEA) inflammatory response score calculated from the transcriptome of the right colon tissue biopsy. Significance was determined using a double-sided Wilcoxon rank-sum test without adjustment for multiple comparisons. The center line represents the median; the hinges indicate the first and third quartiles; the upper and lower whiskers extend to the largest and smallest values that are within 1.5 times the interquartile range (IQR) from the first and third quartiles, respectively (b,c). d, Bar graph quantifying the percentage of differentially expressed genes (DEGs) (adjusted P < 0.05) in each comparison (the proportion of genes upregulated in PSC are shown in purple, genes upregulated in sporadic dysplasia are shown in green, and genes upregulated in IBD are shown in orange).
Fig. 3
Fig. 3. PSC inflammation is characterized by IL-17A+FOXP+ CD4 T cells enriched for TCRs containing LA.
a, Percentage of right colon lamina propria CD4 T cells positive for IL-17A and FOXP3 (n = 6 PSC I2, n = 13 PSC I1, n = 18 PSC U, n = 3 IBD I2, n = 1 IBD I2, n = 12 IBD U, n = 3 NC U). Significance was determined using a double-sided Wilcoxon rank-sum test without adjustment for multiple comparisons. The ‘x’ denotes patients with dysplasia at the time of sampling. b, Mean fluorescence intensity (MFI) of surface CD4 expression of cells from patients in the I2 PSC group (n = 6). Significance was determined using a double-sided Wilcoxon matched-pairs signed-rank test without adjustment for multiple comparisons (n = 6). The center line represents the median; the hinges indicate the first and third quartiles; the upper and lower whiskers extend to the largest and smallest values that are within 1.5 times the IQR from the first and third quartiles, respectively (a, b). c, UMAP of CD4 T cells from patients with PSC, annotated according to cell type (n = 15 patients, n = 25,942 cells). d, log2 fold change of gene expression comparing DP to FOXP3+ CD4 T cells (x axis) or IL17A+ CD4 T cells (y axis) among I2 PSC individuals (n = 4 patients with PSC I2). Each gene is a circle colored if significantly (P < 0.1) changed across a comparison. NS, not significant. The highest fold change genes are labeled on the graph. e, Most significantly enriched gene sets upregulated in DP CD4 T cells versus either IL17A+ or FOXP3+ CD4 (n = 4 patients with PSC I2). f, Enrichment plot for a pathogenic IL-17 signature based on ranking the genes on their changes in expression in DP CD4 versus IL17A+ CD4 cells. The GSEA nominal P value is shown (n = 4 patients with PSC I2). g, Top and bottom 10% of DP cells by enrichment for pathogenic IL-17 signature were identified and ORs of top vs bottom 10% by cluster are presented as a Forest plot with the 95% confidence intervals and labeled P value (Fisher exact test). (I2, I1 or U, n = 15 PSC patients, n = 25,942 cells). h, Proportion of I2 PSC TCRβ chains containing the LA motif (n = 4). The dashes denote values from the same patient. Significance was determined using a double-sided, unpaired Wilcoxon rank-sum test.
Fig. 4
Fig. 4. PSC inflammation is characterized by an influx of IgG plasma cells and plasma cells show signs consistent with an antigen drive.
a, Proportion of right colon plasma cells positive for surface CD19 by flow cytometry (n = 10 PSC I2, n = 16 PSC I1, n = 21 PSC U, n = 4 IBD I2, n = 3 IBD I1, n = 16 IBD U, n = 11 HC U). b, Proportion of IgG-secreting plasma cells among total right colon plasma cells as determined by enzyme-linked immunosorbent spot (ELISpot) (n = 8 PSC I2, n = 13 PSC I1, n = 20 PSC U, n = 4 IBD I2, n = 2 IBD I1, n = 14 IBD U, n = 6 HC U). c, Mean amino acid divergence from the inferred germline within CDR3 of the largest clones identified in each patient (n = 4 PSC I2, n = 3 PSC I1, n = 6 PSC U). d, Mean pairwise amino acid divergence within CDR3 of the largest clones identified in each patient (n = 4 PSC I2, n = 3 PSC I1, n = 6 PSC U). Each symbol represents an individual patient (open circles denote patients without dysplasia at the time of sampling; ‘x’ denotes patients with dysplasia at the time of sampling; open squares denote patients indefinite for dysplasia at the time of sampling). The center line represents the median; the hinges indicate the first and third quartiles; the upper and lower whiskers extend to the largest and smallest values within 1.5 times the IQR from the first and third quartiles, respectively (ad). e, Dendrogram of heavy chain sequences within the top clone of an I2 patient (n = 110 sequences). This clone demonstrates a ‘lop-sided’ branching pattern, which is consistent with nonrandom mutation accumulation and antigen drive. The origin point represents the inferred germline sequence. The scale bar represents the codon substitutions per codon.
Fig. 5
Fig. 5. I2 status is associated with a greater risk and shorter time to dysplasia in PSC but not IBD.
a, Kaplan–Meier-estimated curves for the risk of right-sided dysplasia over time. Patients were classified as I2 (red) or non-I2 (I1 or U, black), according to their transcriptional cluster (n = 64 PSC, n = 127 IBD). The gray dashed line marks the 0.5 probability of the event (dysplasia diagnosis after colitis). For patients who were sampled at multiple time points, they were classified as I2 if at any point they had an I2 signature, otherwise they were classified as non-I2. Time (years) was calculated from the diagnosis of intestinal colitis to either the first incidence of right-sided colitis or the last colonoscopy recorded. Patients are subset according to diagnosis, that is, IBD (left) or PSC (right). b, Kaplan–Meier curves as in a, but showing the risk of non-right-sided dysplasia over time (n = 64 PSC, n = 127 IBD). Statistical outliers for time of follow-up were removed from the analysis before calculating the Kaplan–Meier estimates and P value. Individuals are subset according to diagnosis, that is, IBD (left) or PSC (right). Censored points (no dysplasia diagnosed) are marked as +.
Fig. 6
Fig. 6. Genes of the I2 PSC classifier model.
Heatmap of the expression of the 81 core I2 PSC genes (rows) among PSC patients (columns). Top, the annotation represents the patient characteristics: cluster, sex, age, inflammatory response (IR) and single-sample GSEA score. Annotated on the right are the genes present in wound healing-related GO BPs enriched with the 81 genes from the I2 signature (n = 65 patients with PSC).
Extended Data Fig. 1
Extended Data Fig. 1. I2 subjects are inflamed.
a, Histologically-scored inflammation in the right colon of patients without a history of dysplasia, separated by transcriptionally-determined cluster. 0 = no diagnostic abnormality, 1 = quiescent inflammation, 2 = mild inflammation, 3 = moderate inflammation, 4 = severe inflammation. Significance determined by two-sided, unpaired Wilcoxon test without adjustment for multiple comparisons. b, Single sample gene set analysis (ssGSEA) score for the Inflammatory Response gene set (HALLMARK_INFLAMMATORY_RESPONSE, Molecular Signatures Database v7.5.1) calculated from the right colon tissue transcriptome of patients without a history of dysplasia, separated by transcriptionally-defined cluster. Significance determined by two-sided, unpaired Wilcoxon test without adjustment for multiple comparisons. n = 34 I2, 26 I1, 156 U (a, b). c, Distribution of subjects with no history of dysplasia across clusters, statistical significance determined by two-sided Fisher t-test. d, Volcano plot summarizing the differentially expressed gene analysis of PSC I2 subjects with right-sided dysplasia versus PSC I2 subjects with no history of dysplasia (n = 5 PSC I2 with dysplasia, 17 PSC I2 without dysplasia). 0 genes passed the threshold of significance (red dashed line, adjusted p-value > 0.05), suggesting that the transcriptional profile of PSC I2 subjects is identical whether or not the patient has right-sided dysplasia. e, Histologically-scored inflammation in patients with PSC and IBD that have dysplasia, separated by the location of dysplasia (n = 6 PSC-right, 7 IBD right-sided dysplasia, 9 IBD left-sided dysplasia. Significance determined by two-sided, unpaired Wilcoxon test without adjustment for multiple comparisons. Center line represents the median value; hinges indicate the 1st and 3rd quartiles; upper and lower whiskers extend to the largest and smallest values that are within 1.5 times the interquartile range from 1st and 3rd quartiles, respectively (a,b,e).
Extended Data Fig. 2
Extended Data Fig. 2. Cytokines secreted by CD4 T cells across transcriptional clusters.
a–d, Proportion of right colon lamina propria CD4 T cells expressing IL-17A (a), IFNγ (b), TNFα (c), or FOXP3 (d) after 3 hours of stimulation with PMA/ionomycin. e, Proportion of right colon lamina propria CD4 T cells that are IL-17A+ FOXP3negative after 3 hours of stimulation with PMA/ionomycin. f, Proportion of right colon lamina propria CD4 T cells that are FOXP3+ IL-17Anegative after 3 hours of stimulation with PMA/ionomycin. g, h, Proportion of right colon lamina propria cells that are FOXP3negative and IFNγ+ (g) or TNFα+ (h) after 3 hours of stimulation with PMA/ionomycin. i, j, Proportion of right colon lamina propria cells that are FOXP3+ and IFNγ+ (i) or TNFα+ (j) after 3 hours of stimulation with PMA/ionomycin. a–j, Significance determined by two-sided, unpaired Wilcox test without adjustment for multiple comparisons. A total of 6 PSC I2, 13 PSC I1, 18 PSC U, 3 IBD I2, 1 IBD I1, 12 IBD U, and 3 HC were included in the intracellular flow cytometry analysis. Not all samples were stained with every marker, resulting in a lower number than the total samples being included in the plots above. Center line represents the median value; hinges indicate the 1st and 3rd quartiles; upper and lower whiskers extend to the largest and smallest values that are within 1.5 times the interquartile range from 1st and 3rd quartiles, respectively.
Extended Data Fig. 3
Extended Data Fig. 3. Gating strategy used for sorting of CD4 T cells and plasma cells.
CD45+ live cells were gated for lymphocytes, and then singlets. CD4 T cells were sorted from this singlet population as CD3+ CD19 negative, CD4+ CD8 negative. Plasma cells were sorted from this singlet population as CD3 negative, CD27+ CD38+.
Extended Data Fig. 4
Extended Data Fig. 4. Transcriptional identification of the IL17-A+ FOXP3+ CD4 T cells.
a, Correlation of proportion of IL-17A+ FOXP3+ cells by flow cytometry versus scRNAseq at each quantile cutoff value used to identify positive (IL17A+ FOXP3+) cells. b, Normalized sum of differences in proportions between proportion of IL-17A+ FOXP3+ cells by flow cytometry and scRNAseq at each quantile cutoff value used to identify positive (IL17A+ FOXP3+) cells. c, Correlation of proportion of IL-17A+ FOXP3+ cells by flow cytometry versus scRNAseq at the quantile cutoff value used in Fig. 3 (0.94). Significance and correlation determined by two-sided Pearson correlation test. d, Proportion of each transcriptionally-determined cell type within total CD4 cells by patient (n = 4 PSC I2, 7 PSC I1, 4 PSC U). A-C, n = 2 PSC I2, 6 PSC I1, 4 PSC U. D, Log 2 fold change of cytokine expression of double positive cells as compared to IL17A single positive (orange), FOXP3 single positive (blue), or IL17A FOXP3 double negative (gray) (n = 4 PSC I2). Filled circles represent genes significantly changed at adjusted p < 0.1, and open circles represent genes that are not significantly changed adjusted p < 0.1.
Extended Data Fig. 5
Extended Data Fig. 5. V(D)J usage by cell type in I2 PSC.
a-e, TRBV (a), TRBD (b), TRBJ (c), TRAV (d) and TRAJ (e) gene usage by cell type amongst CD4 T cells from I2 PSC patients. f, Proportion of cells containing amino acid motif ‘LA’ in the TCR beta chain by cell type amongst I2 PSC patients using TRBD2. Gray lines denote paired values from the same patients. SP = ‘single positive’, DP = ‘double positive’ i.e. IL17A+ FOXP3+. Significance determined by two-sided, unpaired Wicoxon text. a-f, Datapoints and box plot color denotes cell type (pink = IL17A+ FOXP3+ DP, orange = IL17A+ SP, blue = FOXP3+ SP, gray = negative for IL17A and FOXP3). n = 3 PSC I2, 1,858 cells. ae, Center line represents the median value; hinges indicate the 1st and 3rd quartiles; upper and lower whiskers extend to the largest and smallest values that are within 1.5 times the interquartile range from 1st and 3rd quartiles, respectively. Significance test using two-sided, unpaired Wilcoxon test without adjustment for multiple comparisons. No test reached significance (p < 0.05).
Extended Data Fig. 6
Extended Data Fig. 6. V(D)J gene usage amongst IL17A+FOXP3+ CD4 T cells containing ‘LA’ motif.
a–d, TRBV (a), TRBJ (b), TRAV (c), and TRAJ (d) gene usage amongst IL17A+ FOXP3+ CD4 T cells stratified by whether the Beta chain contains the ‘LA’ amino acid motif. Significance determined by Chi-squared test. n = 3 PSC I2, 1,858 cells.
Extended Data Fig. 7
Extended Data Fig. 7. Features of the top plasma cell clones in PSC patients.
a, Volcano plot of the negative log base 10 adjusted p-value versus log base 2 fold change of the genes differentially expressed in the whole tissue biopsies of I2 versus U patients (n = 34 I2, 133 U). Closed circles denote genes coding for immunoglobulin constant region; heavy chain V, D, or J segments; or light chain V or J segments. b, Mean forward scatter (FSC) of right colon plasma cells across clusters as determined by flow cytometry. c, Proportion of IgA-secreting plasma cells amongst total right colon plasma cells as determined by ELISpot. d, Proportion of IgM-secreting plasma cells amongst total right colon plasma cells as determined by ELISpot. e, Proportion of the total repertoire made up by the top clone within each subject. f, Proportion of plasma cells of each isotype by clone. g, Mean amino acid divergence from inferred germline across entire heavy chain sequence of largest clones identified in each patient. h, Mean pairwise amino acid divergence across entire heavy chain sequence of largest clones identified in each patient. (b–e, g–h) Each symbol represents an individual patient (open circles denote patients without dysplasia at the time of sampling, ‘x’ denote patients with dysplasia at the time of sampling, open squares denote patients indefinite for dysplasia at the time of sampling). Center line represents the median value; hinges indicate the 1st and 3rd quartiles; upper and lower whiskers extend to the largest and smallest values that are within 1.5 times the interquartile range from 1st and 3rd quartiles, respectively. Significance determined by two-sided, unpaired Wilcoxon test without adjustment for multiple comparisons. b–h, n = 4 PSC I2, 3 PSC I1, 7 PSC U.

Comment in

References

    1. Bowlus CL, Li C-S, Karlsen TH, Lie BA, Selmi C. Primary sclerosing cholangitis in genetically diverse populations listed for liver transplantation: unique clinical and human leukocyte antigen associations. Liver Transpl. 2010;16:1324–1330. doi: 10.1002/lt.22161. - DOI - PMC - PubMed
    1. Lee Y-M, Kaplan MM. Primary sclerosing cholangitis. N. Engl. J. Med. 1995;332:924–933. doi: 10.1056/NEJM199504063321406. - DOI - PubMed
    1. Fausa O, Schrumpf E, Elgjo K. Relationship of inflammatory bowel disease and primary sclerosing cholangitis. Semin. Liver Dis. 1991;11:31–39. doi: 10.1055/s-2008-1040420. - DOI - PubMed
    1. Shah SC, et al. High risk of advanced colorectal neoplasia in patients with primary sclerosing cholangitis associated with inflammatory bowel disease. Clin. Gastroenterol. Hepatol. 2018;16:1106–1113. doi: 10.1016/j.cgh.2018.01.023. - DOI - PubMed
    1. Broomé U, Löfberg R, Veress B, Eriksson LS. Primary sclerosing cholangitis and ulcerative colitis: evidence for increased neoplastic potential. Hepatology. 1995;22:1404–1408. - PubMed

MeSH terms