. 2023 Aug;19(8):1004-1012.
doi: 10.1038/s41589-023-01318-1. Epub 2023 Jun 15.

Direct enzymatic sequencing of 5-methylcytosine at single-base resolution

Affiliations

Direct enzymatic sequencing of 5-methylcytosine at single-base resolution

Tong Wang et al. Nat Chem Biol. 2023 Aug.

Abstract

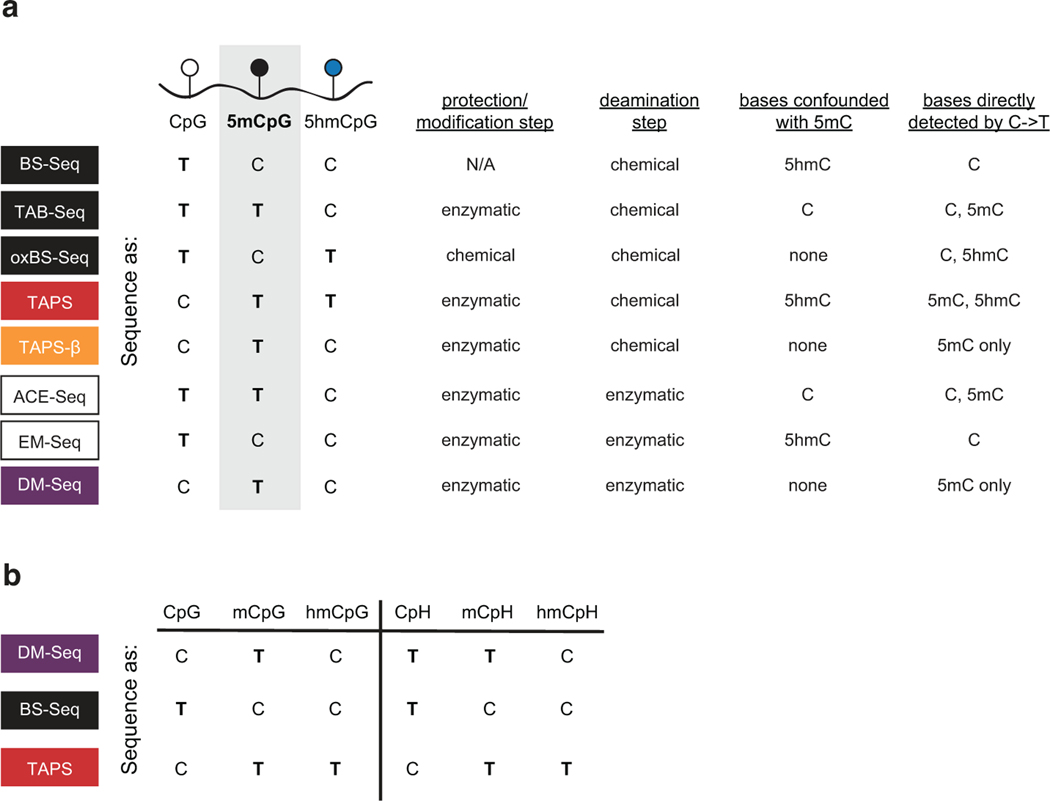
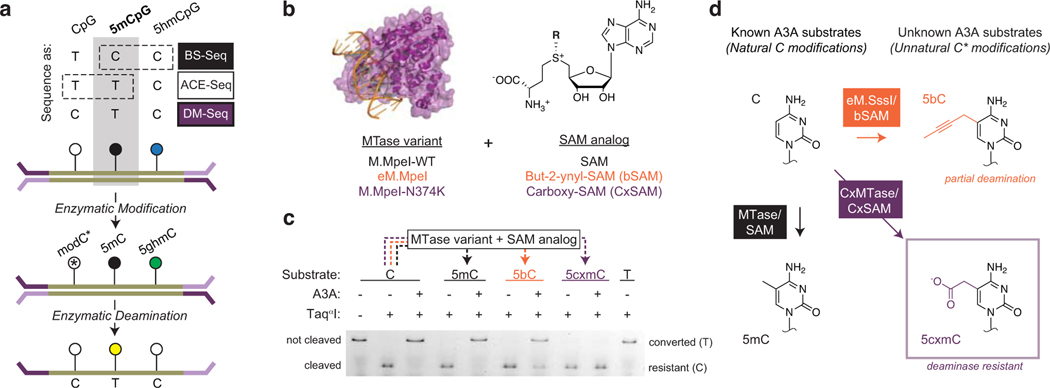
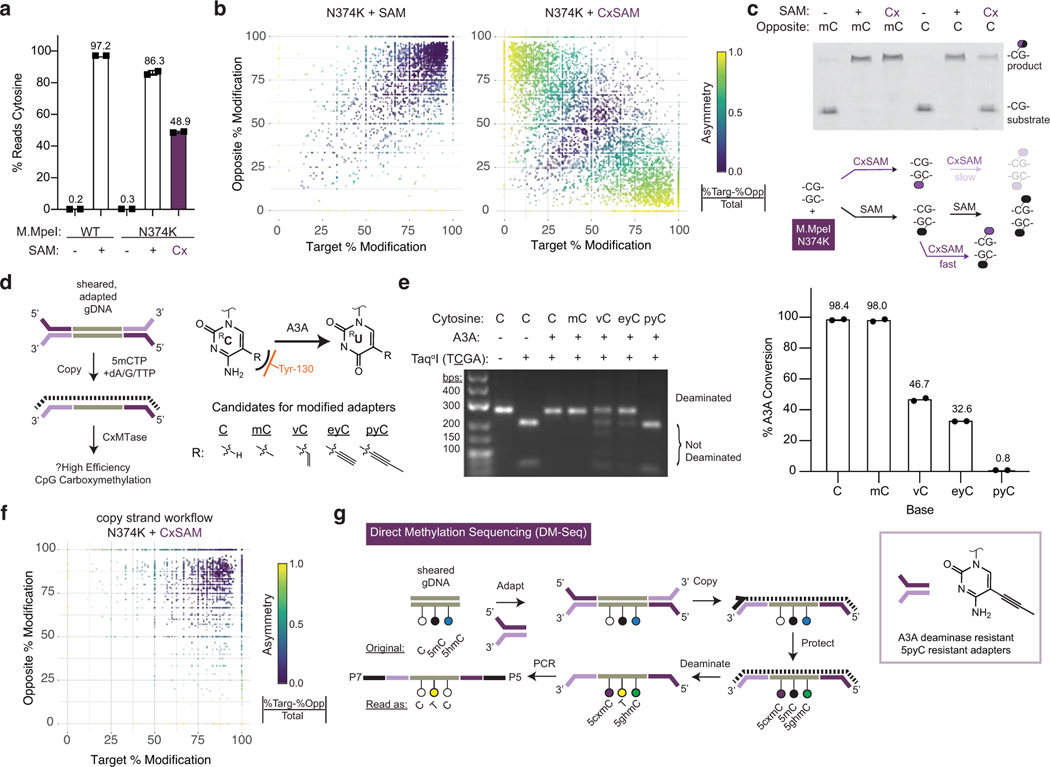
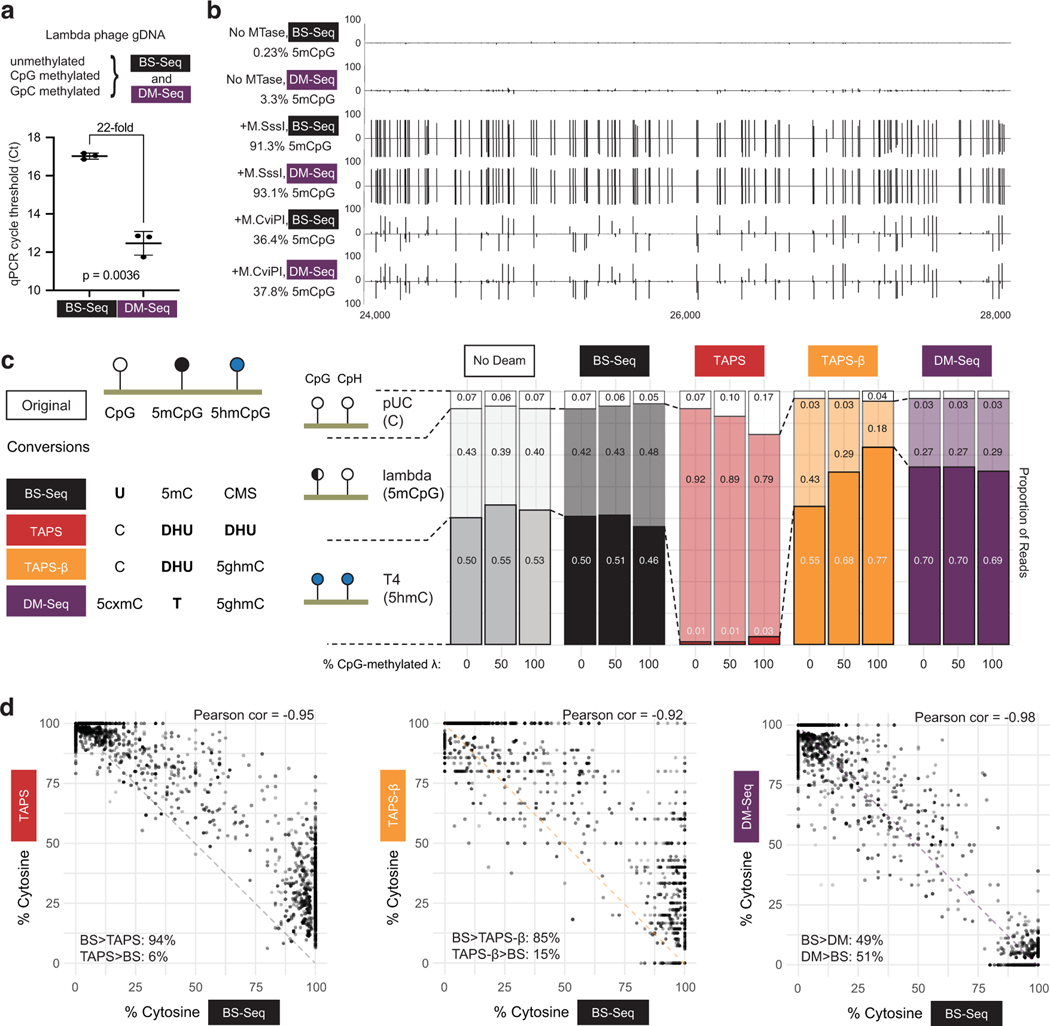
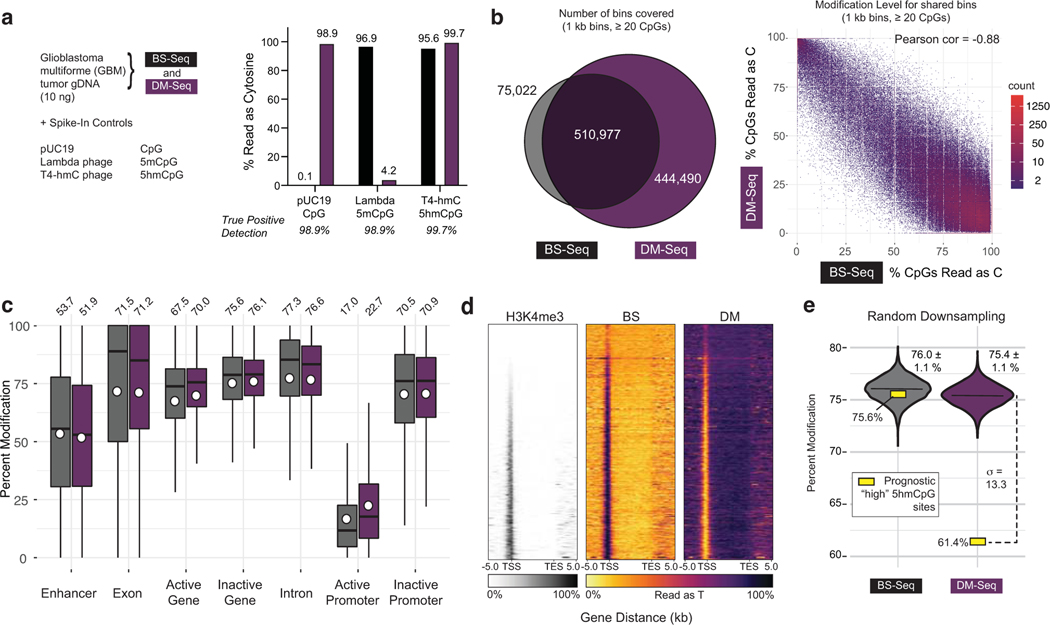
5-methylcytosine (5mC) is the most important DNA modification in mammalian genomes. The ideal method for 5mC localization would be both nondestructive of DNA and direct, without requiring inference based on detection of unmodified cytosines. Here we present direct methylation sequencing (DM-Seq), a bisulfite-free method for profiling 5mC at single-base resolution using nanogram quantities of DNA. DM-Seq employs two key DNA-modifying enzymes: a neomorphic DNA methyltransferase and a DNA deaminase capable of precise discrimination between cytosine modification states. Coupling these activities with deaminase-resistant adapters enables accurate detection of only 5mC via a C-to-T transition in sequencing. By comparison, we uncover a PCR-related underdetection bias with the hybrid enzymatic-chemical TET-assisted pyridine borane sequencing approach. Importantly, we show that DM-Seq, unlike bisulfite sequencing, unmasks prognostically important CpGs in a clinical tumor sample by not confounding 5mC with 5-hydroxymethylcytosine. DM-Seq thus offers an all-enzymatic, nondestructive, faithful and direct method for the reading of 5mC alone.


Conflict of interest statement

COMPETING INTERESTS

The University of Pennsylvania has patents pending for CxMTase enzymes, DNA deaminase-resistant adapters and the DM-Seq pipeline. R.M.K. has served as a scientific advisory board member for Cambridge Epigenetix (CEGX). W.G. is an employee of CEGX and T.W. was supported by a fellowship from CEGX. A.D. and N.D. are employees of Integrated DNA Technologies, Inc. The remaining authors declare no competing interests.

Figures

Extended Date Figure 1.
Extended Date Figure 1.. Chemical and enzymatic sequencing methods for resolving DNA modifications.
a) Methods differ in their use of protection or modification steps to alter C, 5mC or 5hmC. They differ in deamination steps with chemical or enzymatic reagents. In each method, C, 5mC, or 5hmC are detected based on the pattern of C-to-T changes in sequencing, resulting in different possible bases that can be confounded with 5mC. b) Shown are the anticipated sequencing results for C, 5mC and 5hmC in CpG versus CpH contexts.
Extended Date Figure 2.
Extended Date Figure 2.. TaqαI assay for assessment of modified cytosine deamination by A3A.
a) A fluorophore-labelled top-strand is duplexed to a complementary bottom-strand containing a methylated cytosine. The methylated cytosine is represented with a black oval. The substrate is reacted with either WT M.MpeI + SAM, eM.MpeI + bSAM, or M.MpeI N374K + CxSAM. The half-purple/half-orange oval represents a modified cytosine that can either be 5mC, 5bC, or 5cxmC after the action of the MTase variant and SAM analog. The substrate is then deaminated with A3A before duplexing a complement strand. The restriction enzyme TaqαI only cleaves DNA if C is protected from A3A deamination. b) ESI-MS validating generation of 5bC and 5cxmC substrates before A3A reaction. No unmodified C substrate was detected.
Extended Date Figure 3.
Extended Date Figure 3.. HpaII assay for assessment of opposite strand effects in carboxymethylation.
A fluorophore-labelled top-strand is duplexed to a complementary strand containing either an unmodified or methylated cytosine (represented with a black oval). The duplex is incubated with M.MpeI N374K and either no SAM, SAM, or CxSAM. The half-black/half-purple oval represents the modified cytosine on the labelled top-strand resulting after the action of the M.MpeI N374K and the SAM analog. Excess of unmodified bottom strand exchanges away the modification on the bottom strand. HpaII cleavage interrogates the modification status of the top strand.
Extended Date Figure 4.
Extended Date Figure 4.. Structurally-informed identification of both 5cxmC and 5pyC as new protected cytosines useful for A3A dependent sequencing.
a) Generation of homogenously-modified PCR substrates containing unnatural cytosines. A DNA template is amplified with a C-depleted forward primer (red) and G-depleted reverse primer (green) as well as dA/G/TTP and a modified dCTP (blue). DNA is then A3A deaminated before amplification. Amplicons are interrogated with the TaqαI restriction enzyme or by Next-Generation Sequencing quantifying all C sites. b) Active site of human A3A (PDB: 5SWW) showing gating tyrosine (orange) which abuts the C5-C6 face of the target cytosine (yellow) and is anticipated to limit the size of the 5-position substituent (dashed yellow line). A cartoon representation is also shown above. c) Summary of cytosine analogs and deamination by A3A. Left: WT MTases, TETs, and βGT make naturally-occurring modified cytosines which have different reactivities towards A3A. 5caC and 5ghmC are used in the existing methods, EM-Seq and ACE-Seq, to protect from A3A deamination. Right: 5cxmC and 5pyC are identified as novel, protected A3A substrates, both employed in DM-Seq. Despite their shared utility, 5cxmC and 5pyC also contrast in their bond types at the 5-position of cytosine, which are determined by their contrasting modes of biochemical and chemical synthesis, respectively.
Extended Date Figure 5.
Extended Date Figure 5.. 5pyC adapters improve DNA carboxymethylation efficiency through the synthesis of a 5mC copy strand.
a) Structure of 5pyC adapters. ESI-MS characterizing 5pyC adapters. Expected m/z of the two strands: 10,444.2 and 9,936.6. The phosphorothioate linkage (*) substitutes a sulfur in place of a phosphate in the backbone of the oligonucleotide to minimize nuclease degradation. b) 5pyC adapter ligation experiment. Template DNA was ligated to 5mC- or 5pyC-containing Y-shaped adapters. The template DNA was detected by amplification with internal primers (red) or successful ligation was detected by amplification with Illumina indexing primers (blue). Experiment was performed once. c) Schematic of copy strand synthesis. A copy strand is made by incubation of a copy primer, polymerase, and dA/G/TTPs with 5mdCTP.
Extended Date Figure 6.
Extended Date Figure 6.. Copy strand synthesis improves DNA carboxymethylation efficiency.
a) Experimental scheme. Sheared lambda gDNA is ligated to 5mC- or 5pyC-containing adapters. A copy strand with 5mCs is synthesized before reaction with the CxMTase and either no SAM, SAM, or CxSAM, with the product of this reaction represented by the oval with mixed colors. Subsequent BS or A3A deamination shows efficiency of DNA modification. Data are presented as mean values +/− SD (n=2 independent experiments). b) Next-Generation Sequencing quantifying efficiency of CxMTase with methylation or carboxymethylation after copy strand synthesis.
Extended Date Figure 7.
Extended Date Figure 7.. Comparison of different sequencing methods on M.CviPI-modified gDNA.
The M.CviPI-methylated lambda phage gDNA shows near complete modification at GpCpG sequencing contexts given the known GpC preference for M.CviPI. The enzyme has known off-target and heterogenous activity at CpCpG sites. The dashed line shows the readout if BS-Seq signal inversely correlates with DMSeq as anticipated. a) Correlation of BS-Seq to DM-Seq in an M.CviPI-modified substrate. b) Comparison of BS-Seq and DM-Seq modification status by 5’ sequence context. The box shows the lower quartile, median, and upper quartile. Minimum and maximum values are shown by the whiskers. Data in a-b) corresponds to experiment shown in Fig. 3a–b. c) Comparison of BS-Seq, TAPS, TAPS-β, and DM-Seq modification status by 5’ sequence context. The box shows the lower quartile, median, and upper quartile. Minimum and maximum values are shown by the whiskers. d) Percent modification in CpG contexts of BSSeq, TAPS, TAPS-β, and DM-Seq of 3 different methylated lambda phages. Data in c-d) corresponds to experiment shown in Fig. 3c–d.
Extended Date Figure 8.
Extended Date Figure 8.. Comparison of deamination methods show that TAPS bias is dependent on both TET and borane-mediated deamination.
a) Workflow for comparing deamination methods. A mixture of unmodified pUC19 DNA, 100% CpG methylated lambda phage, and T4-hmC phage (where all C bases are 5hmC) was glucosylated. Samples were then subjected to either two rounds of TET treatment or no TET treatment. DNA was ligated to the appropriate adapter and subjected to one of four conditions: no deamination, BS, pyridine borane or A3A. The pyridine borane workflow is equivalent to TAPS-β. The bases deaminated by each method (detected as T by sequencing) are noted, with structures of the deamination products at right, including the non-aromatic DHU. b) Percent reads C as determined by the methylated lambda phage spike-in. The sample with TET and bisulfite indicates efficient conversion of 5mC to 5fC/5caC by TET. c) Proportion of reads mapping to each spike-in are shown. Only borane deamination shows decreased reads mapping to the methylated lambda phage, with depletion dependent upon TET oxidation. d) qPCR detection of amplifiable DNA library after each deamination method. Shown are the p-values from paired two-tailed t-test (n = 4 for each deamination condition, 3e-4 between BS and borane, 2e-5 between BS and A3A). Data are presented as mean values +/− SD. e) Mean library size ± standard deviation for each deamination method. A representative BioAnalyzer trace is shown for each deamination method.
Extended Date Figure 9.
Extended Date Figure 9.. Existing mammalian TAPS vs BS-Seq data suggest bias.
a) Binned CpG analysis using non-overlapping 1 kB bins. Correlation between TAPS and BS-Seq in mESCs in existing datasets (GSE112520). b) Histogram showing ~2-fold as many 1 kB bins with greater modification detected by BS-Seq than TAPS. Percent Deviation = (TAPS % reads T – BS-Seq % reads C) / (BS-Seq % reads C). c) Percent deviation of TAPS vs BS-Seq as a function of % modification of CpGs in a given 1 kB bin. The box shows the lower quartile, median, and upper quartile. Minimum and maximum values are shown by the whiskers. d) ICRs show underdetection of 5mC by TAPS relative to BS-Seq. At bottom is the heatmap representation of individual ICRs. The percent modification outside of ICRs (64.2% vs 60.1%) represents the genome-wide average for each method using 1 kB bins vs just at the ICR (41.9% vs 31.6%). e) Plot of the CpG density in individual ICRs versus the percent TAPS underestimates the level of 5mC relative to BS-Seq. 28 of 29 ICRs show lower modification density by TAPS than by BS-Seq. The one exception is shown in red. The associated correlation coefficient tracks the % underestimate as a function of CpG density.
Extended Date Figure 10.
Extended Date Figure 10.. Mammalian genome DM-Seq metrics.
DM-seq and BS-seq data from gDNA derived from a patient glioblastoma. a) Final library yield. b) Average size of library fragments (adapters included) determined using a Bioanalyzer. c) Unique CpGs covered by BS-Seq and DM-Seq. The extrapolated BS-Seq bar takes into account if the sequencer was loaded with the same volume of each library rather than by normalizing the amount of DNA loaded. d) High 5hmCpG sites, previously identified by oxBS-Seq of 30 tumors. The Venn diagram shows the portion of these CpG sites that were covered by BS-seq or DM-Seq with this glioblastoma sample. The metrics for the sites sequenced by either BS-Seq or DM-Seq alone are similar to those at the sites that were sequenced by both methods. The analysis in Fig. 4e focuses on the 1,485 shared CpG sites sequenced by both methods.
Figure 1.
Figure 1.. Direct Methylation Sequencing (DM-Seq) is enabled by 5cxmC generation.
a) Top: Sequencing methods for localizing C, 5mC, and 5hmC differ in their use of chemical (e.g. BS-Seq) or enzymatic (e.g. ACE-Seq) deamination, with 5mC signal confounded by either 5hmC or C (boxes with dashed lines). Bottom: Proposed workflow for DM-Seq. DM-Seq was envisioned as an all-enzymatic workflow for the direct detection of only 5mC. This goal could be realized by coupling an engineered DNA MTase (MTase*) with a SAM analog to create a sterically bulky cytosine base that resists deamination by APOBEC3A (A3A). C*, modified C generated from MTase and SAM analog; 5ghmC, Glucosylated 5hmC. In the proposed workflow, only 5mC alone is converted T at CpG sites. b) MTase variants and SAM analogs including two candidates for DM-Seq. c) Restriction enzyme coupled assay for assessing A3A deamination of unnatural cytosine analogs. An oligonucleotide with a single TaqαI restriction site (TCGA) is modified by the appropriate MTase variant to create 5mC, 5bC, or 5cxmC (dashed lines). Modified DNA is then deaminated by A3A. TaqαI only cleaves DNA if C is protected from A3A deamination. Experiment was performed twice with similar results. See Extended Data Fig. 2 for assay schematic and ESI-MS validation of 5bC and 5cxmC substrates. d) Summary of reactivity of various cytosine derivatives towards A3A. Left: Cytosine (C) is modified to 5-methylcytosine (5mC) by WT MTases and SAM. Both C and 5mC are favorable substrates for enzymatic deamination by A3A. Right: structures of 5-(but-2-ynyl)cytosine (5bC) and 5-carboxymethylcytosine (5cxmC), with previously uncharacterized reactivity towards A3A. Box: 5cxmC satisfies the criteria required for the DM-Seq strategy: efficient MTase* transfer and complete protection from A3A deamination.
Figure 2.
Figure 2.. The challenge of asymmetric DNA carboxymethylation is overcome with copy-strand synthesis enabled by 5pyC adapters.
a) Lambda gDNA sequencing experiment. Lambda gDNA was incubated with WT M.MpeI or M.MpeI N374K in the presence of no SAM, SAM, or CxSAM. DNA was treated with bisulfite (BS) before PCR and Illumina sequencing (n=2 independent experiments). Data are presented as mean values +/− SD. b) Scatter plot showing relationship between CpGs on opposite strands within the same dyad. Data is filtered for CpGs with at least 5 sequencing reads. c) Top: Oligonucleotide modification assay (see Extended Data Fig. 3). An oligonucleotide with a labelled top-strand containing an unmodified CpG across from either a 5mCpG or unmodified CpG was reacted with M.MpeI N374K and no SAM, SAM, or CxSAM. Shown is the denaturing gel after digestion with a modification-sensitive restriction enzyme that reports on the modification status of the top strand. Experiment was performed twice with similar results. Bottom: Model for incomplete transfer. Symmetrical modification proceeds readily with SAM but is slow with CxSAM due to inefficient transfer across from a 5cxmC. Carboxymethylation is efficient when the opposite strand contains a 5mC. d) Left: Envisioned scheme where A3A-resistant adapters (purple) initiate universal copy strand synthesis. A copy strand (dotted line) containing 5mCs serves as a favorable substrate for DNA carboxymethylation. Right: Structures of unnatural cytosine analogs explored. The 5-position modifications are anticipated to interact with the steric gate Tyr-130 residue in A3A (orange) (see Extended Data Fig. 4). e) Left: PCR product is generated using modified-dCTPs in place of dCTP. dsDNA is deaminated, PCR amplified, and restriction digested to analyze deamination status at a single TCGA TaqαI site. Right: Deep sequencing of same PCR products as in gel (n=2). f) Scatter plot as in b) showing improvement of carboxymethylation with copy strand synthesis. Data corresponds to Extended Data Fig. 6. g) Full DM-Seq workflow. Sheared gDNA is end-prepped and adapted to A3A resistant 5pyC adapters. A copy strand made with 5mCTPs is synthesized before glucosylation and carboxymethylation. A3A deaminates 5mCpGs to Ts which can be detected upon PCR amplification. Box: 5pyC adapters are synthetically accessible and permissive for A3A-dependent sequencing.
Figure 3.
Figure 3.. DM-Seq accurately detects 5mCpGs at single-base resolution and is more accurate than TAPS.
a) Difference in Ct between DM-Seq and BS-Seq determined by qPCR. p-value represents paired two-tailed t-test (n = 3 MTase conditions). Data are presented as mean values +/− SD. b) Shown is the genome browser view for coordinates 24,000–28,000 in the lambda phage genome for all CpGs. Lambda gDNA was modified with SAM and no MTase, M.SssI (CpG), or M.CviPI (GpC). Numbers on left represent total efficiency across the entire 48.5 kB genome. c) Comparison of multiple deamination-dependent sequencing workflows. At left is a schematic showing the state of specific DNA modifications after conversion and prior to library generation (cytosine methylene sulfonate, CMS; dihydrouracil, DHU; glucosylated 5hmC, 5ghmC). A mixture of 3 sheared DNA samples: unmodified pUC19 DNA, variably methylated lambda phage (0%, ~50%, or 100% CpG methylated), and T4-hmC phage (with all C bases replaced by 5hmC) was subjected to either no deamination, BS-Seq, DM-Seq, TAPS, or TAPS-β workflows. Plotted is the distribution of reads mapping to each genome under each condition, with the read fraction listed. d) Correlation of BS-Seq to DM-Seq, TAPS, TAPS-β on a M.CviPI GpC-methylated modified substrate. The dashed line shows the readout if BS-Seq signal inversely correlates with DM-Seq, TAPS, or TAPS- β as anticipated, with skew between methods suggested by asymmetrical distribution around this line. In the bottom corner of each plot, for sites where the two methods are not in agreement, the percent of sites where one method detects a higher level of modification than the other method are given.
Figure 4.
Figure 4.. DM-Seq directly detects 5mCpGs in human glioblastoma.
a) Experimental design with spike-in controls showing accuracy of C, 5mC, and 5hmC detection. b) Binned CpG analysis using non-overlapping 1 kB bins with at least 20 CpGs covered. Left: Venn diagram showing bins covered by BS-Seq and DM-Seq. Right: Correlation between DM-Seq and BS-Seq in the 510,977 shared bins. c) Percent cytosine modification at various genomic features. The box shows the lower quartile, median, and upper quartile. Minimum and maximum values are shown by the whiskers. Circles are the mean values displayed above each boxplot. d) Heatmap representation of all annotated genes for H3K4me3 ChIP-Seq, BS-Seq, and DM-Seq. Genes are ranked by their average H3K4me3 signal. e) Observed DM-Seq and BS-seq signal at 3,876 previously defined “high 5hmCpG sites” (yellow square, DM-Seq: 61.4%, BS-Seq: 75.6%). The violin plot shows data from the shared BS and DM-Seq CpGs randomly downsampled 10,000 times to the same coverage as BS and DM-Seq at these sites. Data represents mean ± 1 standard deviation (BS-Seq = 76.0 ± 1.1%; DM-Seq = 75.4 ± 1.1%). The dotted line shows the number of standard deviations (13.3) between the downsampled (violin) and observed (yellow box) data at these prognostically significant CpGs. Extended data from these downsamplings are shown in Supplementary Table 4 and Extended Data Fig. 10.

Comment in

  • Direct methylation sequencing.
    Abakir A, Reik W. Abakir A, et al. Nat Chem Biol. 2023 Aug;19(8):932-933. doi: 10.1038/s41589-023-01356-9. Nat Chem Biol. 2023. PMID: 37322154 No abstract available.

References

    1. Schubeler D. Function and information content of DNA methylation. Nature 517, 321–326 (2015). - PubMed
    1. Luo C, Hajkova P. & Ecker JR Dynamic DNA methylation: In the right place at the right time. Science 361, 1336–1340 (2018). - PMC - PubMed
    1. Shen SY, Singhania R, Fehringer G, Chakravarthy A, Roehrl MHA, Chadwick D, Zuzarte PC, Borgida A, Wang TT, Li T, Kis O, Zhao Z, Spreafico A, Medina TDS, Wang Y, Roulois D, Ettayebi I, Chen Z, Chow S, Murphy T, Arruda A, O’Kane GM, Liu J, Mansour M, McPherson JD, O’Brien C, Leighl N, Bedard PL, Fleshner N, Liu G, Minden MD, Gallinger S, Goldenberg A, Pugh TJ, Hoffman MM, Bratman SV, Hung RJ & De Carvalho DD Sensitive tumour detection and classification using plasma cell-free DNA methylomes. Nature 563, 579–583 (2018). - PubMed
    1. Hoadley KA, Yau C, Wolf DM, Cherniack AD, Tamborero D, Ng S, Leiserson MDM, Niu B, McLellan MD, Uzunangelov V, Zhang J, Kandoth C, Akbani R, Shen H, Omberg L, Chu A, Margolin AA, Van’t Veer LJ, Lopez-Bigas N, Laird PW, Raphael BJ, Ding L, Robertson AG, Byers LA, Mills GB, Weinstein JN, Van Waes C, Chen Z, Collisson EA, Cancer Genome Atlas Research Network, Benz CC, Perou CM & Stuart JM Multiplatform analysis of 12 cancer types reveals molecular classification within and across tissues of origin. Cell 158, 929–944 (2014). - PMC - PubMed
    1. Frommer M, McDonald LE, Millar DS, Collis CM, Watt F, Grigg GW, Molloy PL & Paul CL A genomic sequencing protocol that yields a positive display of 5-methylcytosine residues in individual DNA strands. Proc. Natl. Acad. Sci. U. S. A. 89, 1827–1831 (1992). - PMC - PubMed

METHODS ONLY REFERENCES

    1. Engler C, Kandzia R. & Marillonnet S. A One Pot, One Step, Precision Cloning Method with High Throughput Capability. PloS one 3, e3647 (2008). - PMC - PubMed
    1. Arora S, Horne WS & Islam K. Engineering Methyllysine Writers and Readers for Allele-Specific Regulation of Protein-Protein Interactions. J. Am. Chem. Soc. 141, 15466–15470 (2019). - PMC - PubMed
    1. Krueger F. & Andrews SR Bismark: a flexible aligner and methylation caller for Bisulfite-Seq applications. Bioinformatics 27, 1571–1572 (2011) - PMC - PubMed

Publication types