. 2023 Dec;19(12):1448-1457.
doi: 10.1038/s41589-023-01364-9. Epub 2023 Jun 15.

Nanosensor-based monitoring of autophagy-associated lysosomal acidification in vivo

Affiliations

Nanosensor-based monitoring of autophagy-associated lysosomal acidification in vivo

Mijin Kim et al. Nat Chem Biol. 2023 Dec.

Abstract

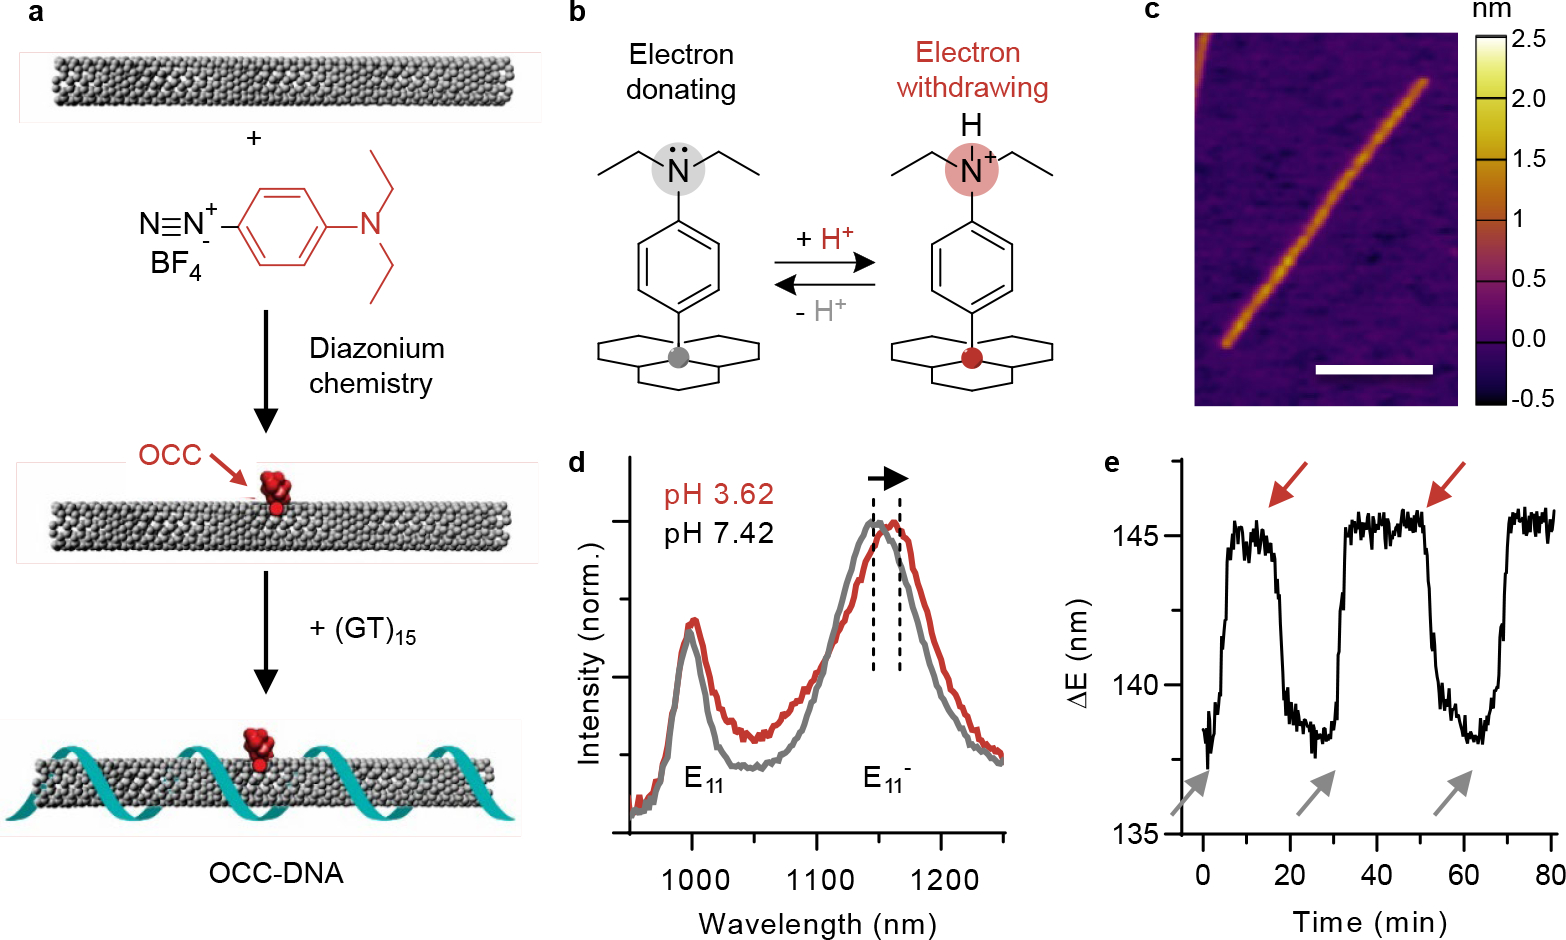
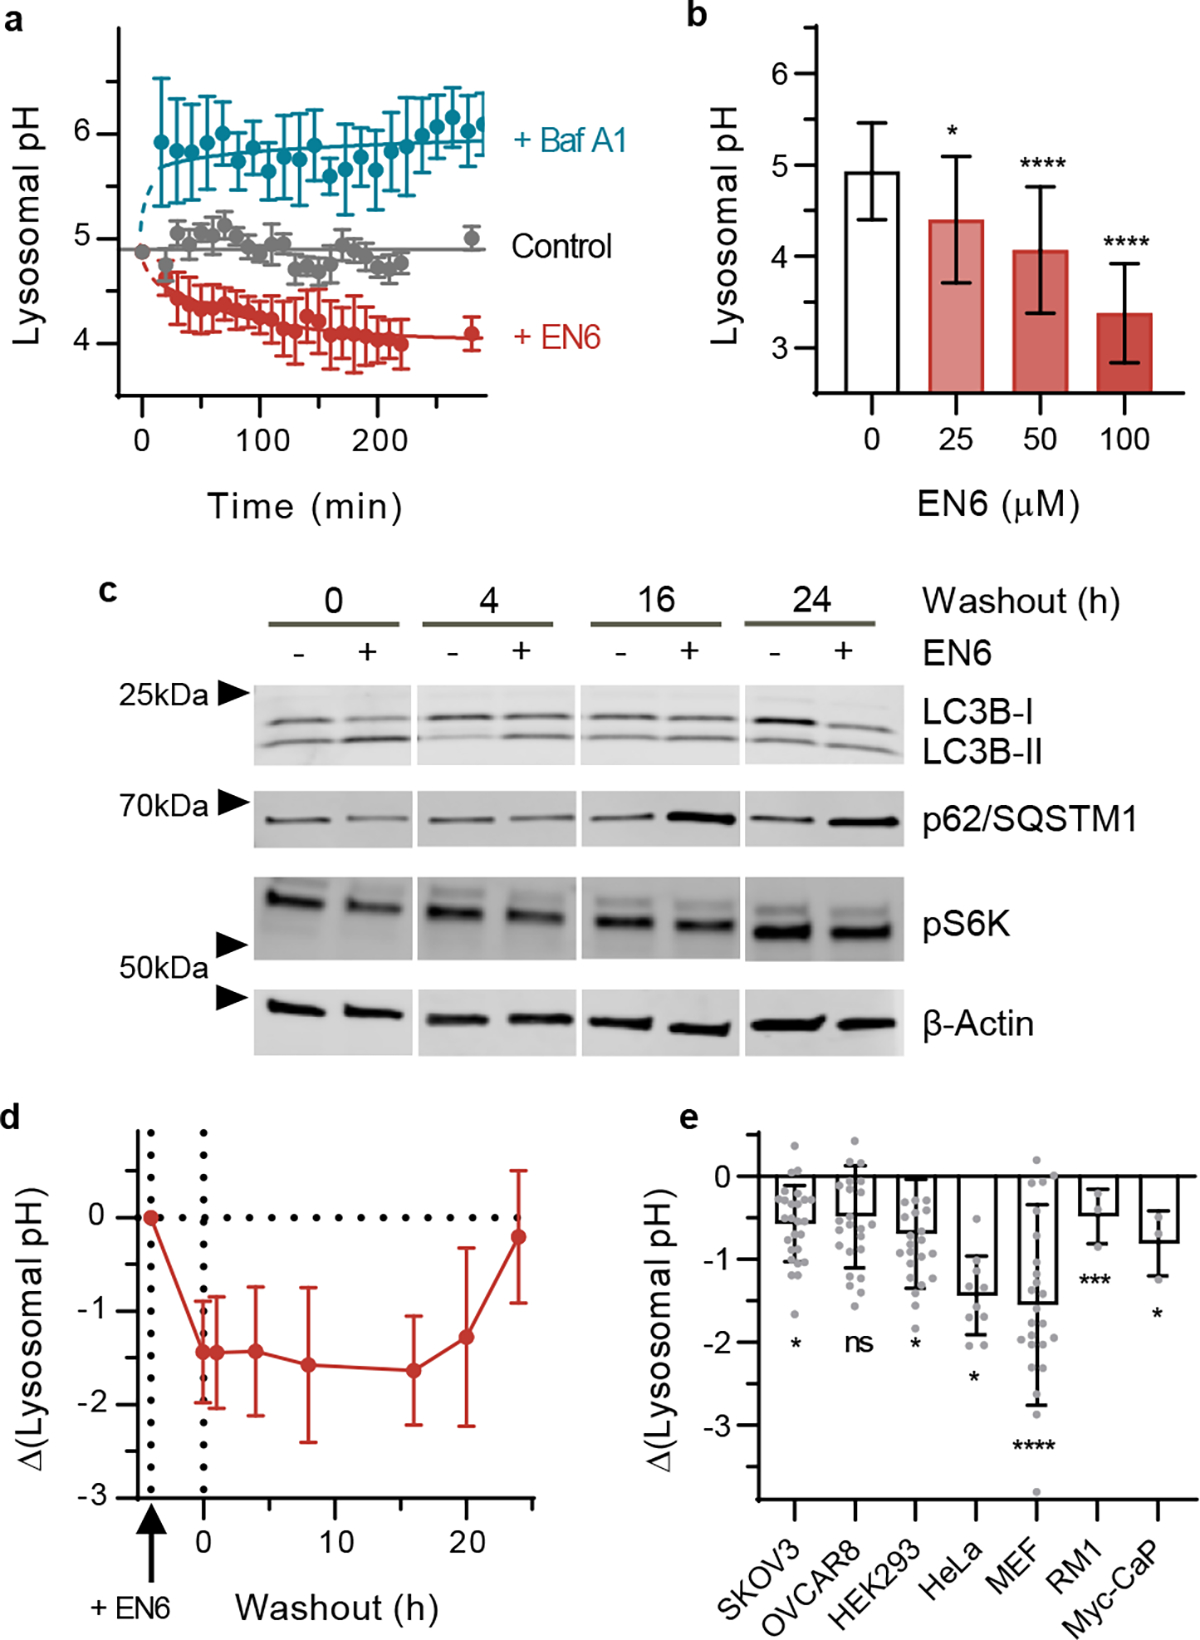
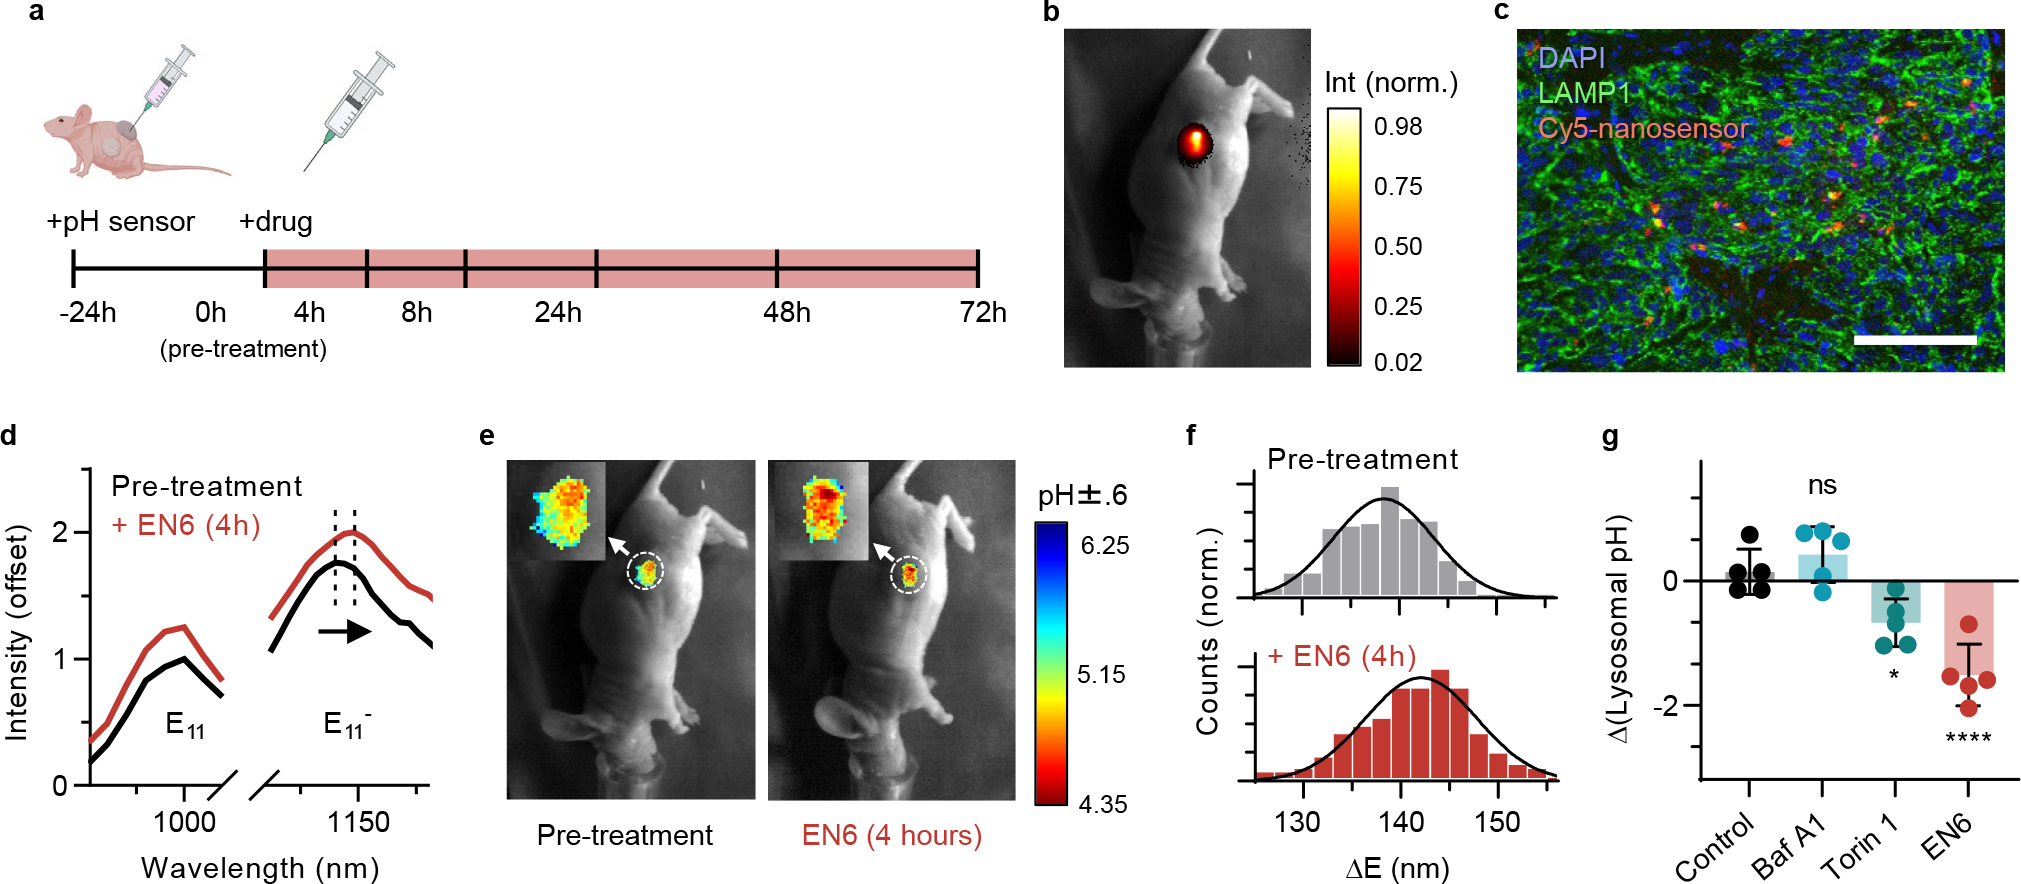
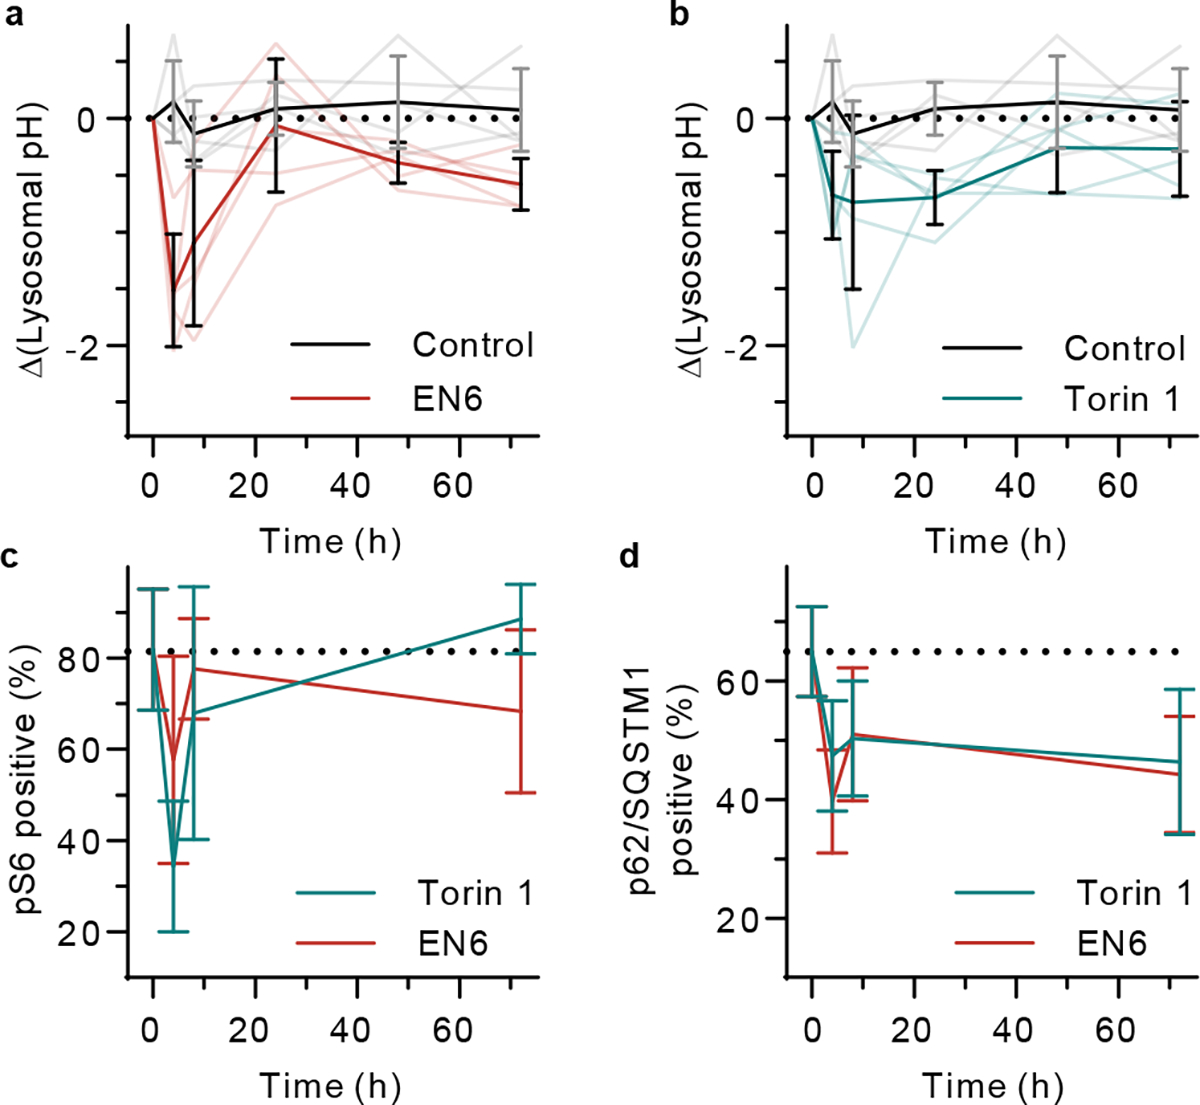
Autophagy is a cellular process with important functions that drive neurodegenerative diseases and cancers. Lysosomal hyperacidification is a hallmark of autophagy. Lysosomal pH is currently measured by fluorescent probes in cell culture, but existing methods do not allow for quantitative, transient or in vivo measurements. In the present study, we developed near-infrared optical nanosensors using organic color centers (covalent sp3 defects on carbon nanotubes) to measure autophagy-mediated endolysosomal hyperacidification in live cells and in vivo. The nanosensors localize to the lysosomes, where the emission band shifts in response to local pH, enabling spatial, dynamic and quantitative mapping of subtle changes in lysosomal pH. Using the sensor, we observed cellular and intratumoral hyperacidification on administration of mTORC1 and V-ATPase modulators, revealing that lysosomal acidification mirrors the dynamics of S6K dephosphorylation and LC3B lipidation while diverging from p62 degradation. This sensor enables the transient and in vivo monitoring of the autophagy-lysosomal pathway.


Conflict of interest statement

Competing interests

D.A.H. is a co-founder and officer with equity interest in Lime Therapeutics, Inc., and co-founder with equity interest in Selectin Therapeutics Inc. and Resident Diagnostics, Inc., and a member of the scientific advisory board of Concarlo Therapeutics, Inc., Nanorobotics Inc., and Mediphage Bioceuticals, Inc. T.T. has research support from ONO Pharma USA., Inc. (unrelated to this work) and is a member of the scientific advisory board of Lime Therapeutics, Inc. with equity interest. The remaining authors declare no competing interests.

Figures

Extended Data Fig. 1 |
Extended Data Fig. 1 |. Characterization of OCC-DNA response in various buffer/media conditions.
Emission wavelengths of a-c, E11 and d-f, E11 of the OCC-DNA complexes at varying buffer pH and media conditions in phosphate buffered saline. The metal ion concentrations tested are physiologically relevant ranges. All data are presented as mean values and error bars denote standard deviation from N=3 technical replicates (a-f). g, Frequency distribution of standard deviations of ΔE(=E11E11) wavelength shifts of triplicate measurements of a-f.
Extended Data Fig. 2 |
Extended Data Fig. 2 |. Protein concentration effects on OCC-DNA optical response.
The dynamic range of the OCC-DNA response to pH at increasing concentrations of: a, bovine serum albumin and b, fetal bovine serum. All data are presented as mean values and error bars denote standard deviation from N=3 technical replicates (a,b).
Extended Data Fig. 3 |
Extended Data Fig. 3 |. Viscosity effects on OCC-DNA optical response.
Emission wavelengths of a, E11 and b, E11 of the OCC-DNA complexes at varying buffer pH and glycerol. All data are presented as mean values and error bars denote standard deviation from N=3 technical replicates (a,b).
Extended Data Fig. 4 |
Extended Data Fig. 4 |. Cell viability in response to OCC-DNA complexes.
Single-dose (0.01 mg/L) OCC-DNA cell viability of SKOV3, OVCAR3, HEK293, HeLa, MEF, RM1, and Myc-CaP cell lines, measured via CellTiter-Glo 2.0, after 72 hours of incubation. No statistically significant differences were observed between the PBS control groups (gray) and the treatment groups (red) in all the tested cell lines. All data are presented as mean values and error bars denote standard deviation of triplicates for each condition.
Extended Data Fig. 5 |
Extended Data Fig. 5 |. OCC-DNA responses in 8 cell lines.
The emission response (ΔE=E11E11) of OCC-DNAs in live cells upon exposure to HEPES or MES buffer solutions of varying pHs with monensin (see Methods). All data are presented as mean values and error bars denote standard deviation from N=3–25 biological replicates.
Extended Data Fig. 6 |
Extended Data Fig. 6 |. Inhibitor-mediated alterations of nanosensor response to pH.
The emission response (ΔE=E11E11) of nanosensors in live SKOV3 cells upon exposure to HEPES or MES buffer solutions of varying pHs with monensin (see Methods). Cells were treated with DMSO (black), 100 μM EN6 (red), 100 nM bafilomycin A1 (blue), 250 nM torin 1 (green) for 4 hours prior to pH measurements. Data are presented as mean values and error bars denote standard deviation from N=25 each DMSO, EN6, and Baf A1 point, and 25, 24, and 21 for pH 7, 5.06, and 3.16 for torin 1 biological replicates.
Extended Data Fig. 7 |
Extended Data Fig. 7 |. Nanosensor response in autophagy-defective cells.
a, ATG7 expression by western blotting confirmed the knockout of ATG7 in the HEK293T cell line used herein. The emission wavelength response (ΔE=E11E11) of OCC-DNAs in live b, wild type and c, ATG7−/− HEK293T cells upon exposure to HEPES or MES buffer solutions of varying pHs in the presence of monensin (see Methods). Cells were treated with DMSO (black) or 250 nM torin 1 (blue) for 4 hours prior to pH measurements. All data are presented as mean values and error bars denote standard deviation from N=10 technical replicates (b,c). Original gel images are in Supplementary Fig. 24.
Extended Data Fig. 8 |
Extended Data Fig. 8 |. Time-dependent fluorescence intensity changes of intratumorally-injected nanosensors.
Quantification of total emission intensity of nanosensors in solid tumours of mice after injection. Fluorescence measurements were performed with a near-infrared preclinical hyperspectral imager with 730 nm excitation. Data are presented as mean values and error bars denote standard deviation from N=5 mice.
Fig. 1 |
Fig. 1 |. Synthesis of pH-responsive OCC-DNA complexes.
a, Schematic of the synthesis of OCC-DNA complexes. b, Schematic of the molecular mechanism of response that involves mechanism - protonation and deprotonation of the N,N-diethylamino moieties group on the aryl OCC. c, AFM image of OCC-DNA complex. Scale bar = 100 nm. Color map denotes height. d, Representative near-infrared fluorescence spectra of OCC-DNA complexes in PBS at pH 3.14 (red) and pH 7.02 (gray) at 575 nm excitation. The arrow indicates the redshift of E11 centre wavelength in acidic buffer solution. e, Dynamics of OCC-DNA response and reversal in buffer at pH = 7.09 (gray arrows) and 3.32 (red arrows) at 575 nm excitation. The spectral shift ΔE=E11E11 is as measured from the emission peak centre wavelengths.
Fig. 2 |
Fig. 2 |. OCC-DNA complexes respond to endolysosomal pH.
a, Viability of SKOV3 cells at increasing concentrations of OCC-DNAs, measured via CellTiter-Glo 2.0, after 72 hours of incubation. N=3. The data are presented as mean values with error bars as standard deviation. The experiment was performed at least three times with comparable results. b, Overlay of near-infrared emission of the OCC-DNA complexes from individual puncta of the live cells at 730 nm excitation and the transmitted light image. Arrows mark the 12 cells used for the OCC-DNA response analysis in Fig. e. Scale bar is 50 μm. c, Representative confocal microscopy images of Cy5-labelled OCC-SWCNT complexes (red) and LysoTracker Green (green) lysosomal imaging dye in live SKOV3 cells. Scale bar is 50 μm. d, OCC-DNA response in SKOV3 cells modulated by HEPES or MES buffer with monensin, measured under 730 nm excitation. Data are presented as mean values with error bars and error bands as standard deviation. N=25. e, OCC-DNA response in each cell upon exposure to buffer solutions of varying pHs with monensin. Each line denotes emission response obtained from 12 individual cells. Gray error band indicates the standard deviation of the sensor responses.
Fig. 3 |
Fig. 3 |. Nanosensor response under modulation of V-ATPase in live cells.
a, Near-infrared fluorescence emission spectra of regions of interest (ROIs) in the images in panel b. Each ROI is marked with dashed circle. b, Maps of the nanosensor pH response in SKOV3 cells, as measured by near-infrared hyperspectral microscopy at 730 nm excitation, overlaid onto brightfield images 4 hours after the introduction of DMSO (control), EN6 (100 μM), or Baf A1 (100 nM). Scale bar is 50 μm. c, Histogram of ΔE from all pixels with sensor emission from the hyperspectral images of cells in Fig. b. d, Lysosomal pH changes estimated from ΔE values from fluorescence spectroscopy measurements after 4-hour drug treatment in 7 different cell lines. N = 24, 10, 22, 19, 24, 5, and 5 spectra acquired for each condition, from the left to right cell lines. The bars are presented as mean values with error bars as standard deviation.
Fig. 4 |
Fig. 4 |. Dynamic response to V-ATPase and mTORC modulation in live cells.
a, Time-dependent lysosomal pH in response to EN6 (red), Baf A1 (blue) or control (black) treatment conditions in SKOV3 cells. N=3 spectra. b, Dose-dependent lysosomal pH response in SKOV3 cells upon 4 hours of treatment with EN6. * = 0.0147, **** < 0.0001. N=20 for DMSO and 25 for EN6 treatments. c, Time-dependent expression of autophagy and mTORC signalling effectors in SKOV3 cells upon introduction and wash-out of EN6. Western blotting was performed at least three times with comparable results. d, Time-dependent pH response of nanosensors in SKOV3 cells to 100 μM EN6 treatment for 4 hours and wash-out. N=25. e, Change in lysosomal pH upon 4-hour treatment of 250 nM torin 1, with respect to DMSO control. N = 26, 25, 24, 10, 26, 3, and 3, from left to right cell lines. *: 0.005< p <0.05, ***: p = 0.0005, ****: p < 0.0001 All data are presented as mean values with error bars as standard deviation (a,b,d,e), and statistical significance was analysed using a one-way ANOVA followed by Dunnett’s multiple comparison test (b,e). All experiments were performed at least three times with comparable results.
Fig. 5 |
Fig. 5 |. In vivo nanosensor response to V-ATPase and mTORC modulation.
a, Experimental scheme used in Fig. 5–6. b, Overlay of transmitted light and near-infrared fluorescence emission of the nanosensors in vivo in a mouse with SKOV3 tumour 24 hours after the sensor injection (30 μL of the nanosensors in PBS, 0.1 mg/L). c, Overlay of the Cy5-labeld nanosensors (red), LAMP1 (green), and DAPI (blue) from a tumour slice 24 hours after the sensor injection. Scale bar is 100 μm. d, Averaged sensor emission from the mouse tumour before and after EN6 treatment at 808 nm excitation. The selected ROIs are marked with dashed circle in Fig. e. e, Overlay of transmitted light and hyperspectral wavelength analysis images in vivo before (left) and after EN6 treatment (right) in the same mouse as in panel b. f, Histogram of ΔE from all pixels with sensor emission from the hyperspectral images of solid tumours in Fig. d. g, Lysosomal pH change 4 hour after the drug treatment. N=5 biological replicates per group. Statistical significance was analysed using a one-way ANOVA followed by Dunnett’s multiple comparison test. *: p= 0.0206, ****: p < 0.001. Data are presented as mean values with error bars as standard deviation.
Fig. 6 |
Fig. 6 |. In vivo dynamic monitoring of autophagy induction.
Time-dependent lysosomal pH in control versus a, EN6 (50 mg/kg) and b, Torin 1 (20 mg/kg) treatment groups. Opaque lines denote mean values and transparent lines denote individual datasets. N=5 biological replicates per group. Quantitative histology image analysis of c, phosphorylated S6 and d, p62/SQSTM1 positive cells with EN6 or Torin 1 treatment groups. DMSO control is considered as 0h treatment. N=11 immunohistochemistry images for 5 biological replicates per group. All data are presented as mean values with error bars as standard deviation (a-d).

References

    1. Lawrence RE & Zoncu R The lysosome as a cellular centre for signalling, metabolism and quality control. Nat. Cell Biol. 21, 133–142 (2019). - PubMed
    1. Mulcahy Levy JM & Thorburn A Autophagy in cancer: Moving from understanding mechanism to improving therapy responses in patients. Cell Death Differ. 27, 843–857 (2020). - PMC - PubMed
    1. Galluzzi L et al. Autophagy in malignant transformation and cancer progression. Embo j 34, 856–880 (2015). - PMC - PubMed
    1. Zhan L et al. Autophagy as an emerging therapy target for ovarian carcinoma. Oncotarget 7, 83476–83487 (2016). - PMC - PubMed
    1. Jung S, Jeong H & Yu S-W Autophagy as a decisive process for cell death. Exp. Mol. Med. 52, 921–930 (2020). - PMC - PubMed

Methods-only references

    1. Subbaiyan NK et al. Role of surfactants and salt in aqueous two-phase separation of carbon nanotubes toward simple chirality isolation. ACS Nano 8, 1619–1628 (2014). - PubMed
    1. Quintero B, Cabeza MC, Martínez MI, Gutiérrez P & Martínez PJ Dediazoniation of p-hydroxy and p-nitrobenzenediazonium ions in an aqueous medium: Interference by the chelating agent diethylenetriaminepentaacetic acid. Can. J. Chem. 81, 832–839 (2003).
    1. Streit JK, Fagan JA & Zheng M A low energy route to DNA-wrapped carbon nanotubes via replacement of bile salt surfactants. Anal. Chem. 89, 10496–10503 (2017). - PubMed
    1. Zheng M & Diner BA Solution redox chemistry of carbon nanotubes. J Am Chem Soc 126, 15490–15494 (2004). - PubMed
    1. Bolte S & CordeliÈRes FP A guided tour into subcellular colocalization analysis in light microscopy. J. Microsc. 224, 213–232 (2006). - PubMed

Publication types

MeSH terms

Substances