. 2023 Jul;24(7):1188-1199.
doi: 10.1038/s41590-023-01528-8. Epub 2023 Jun 15.

SALL1 enforces microglia-specific DNA binding and function of SMADs to establish microglia identity

Affiliations

SALL1 enforces microglia-specific DNA binding and function of SMADs to establish microglia identity

Bethany R Fixsen et al. Nat Immunol. 2023 Jul.

Abstract

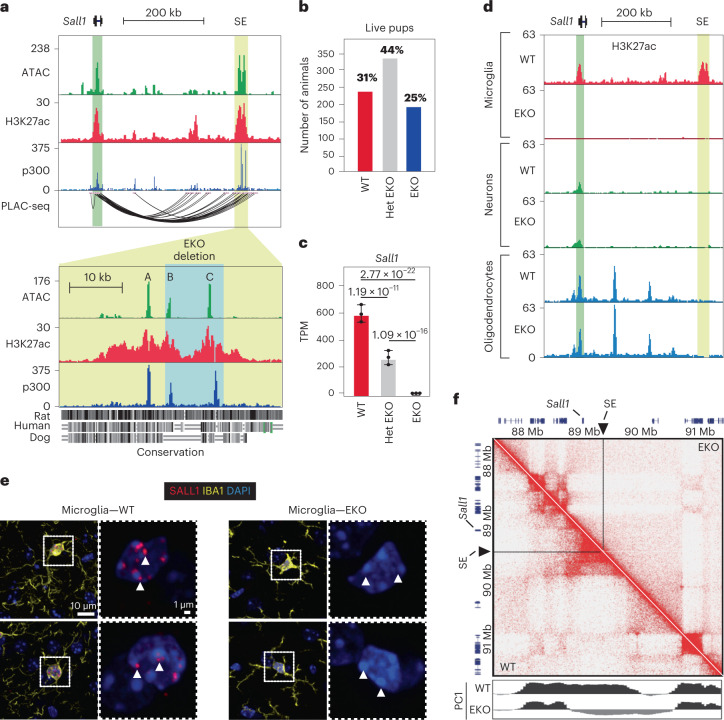
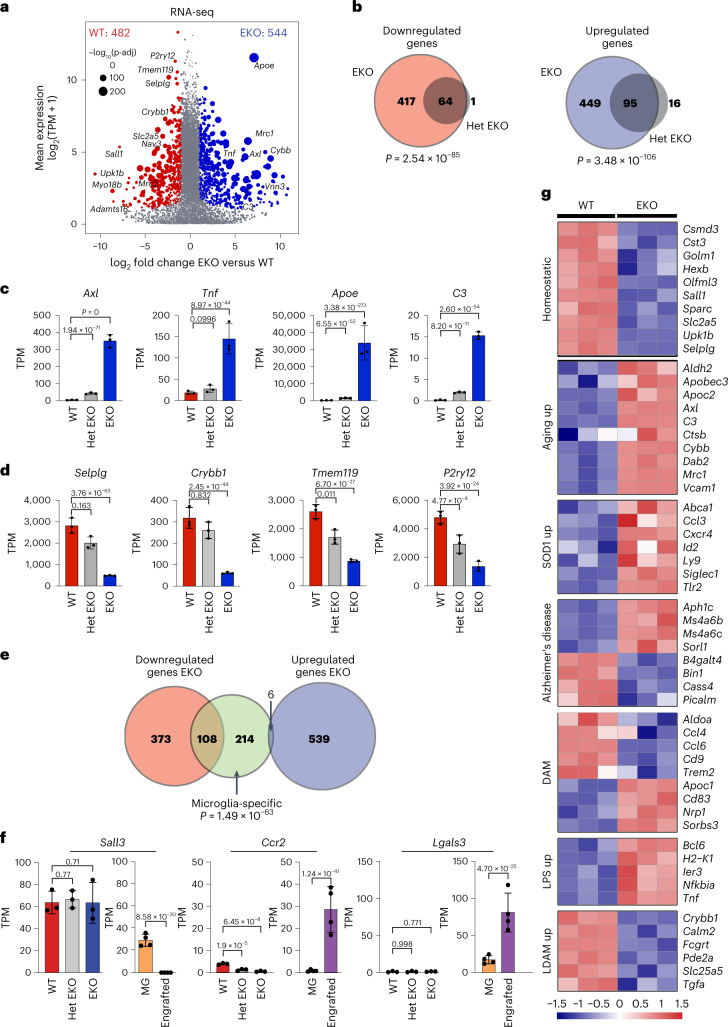
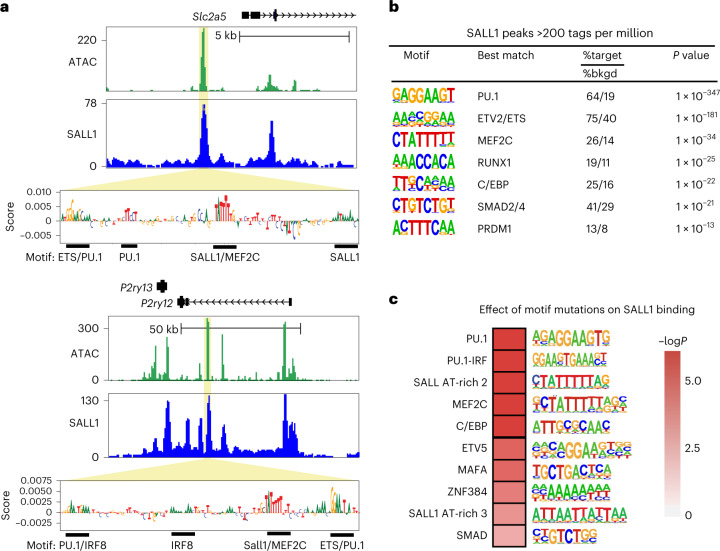
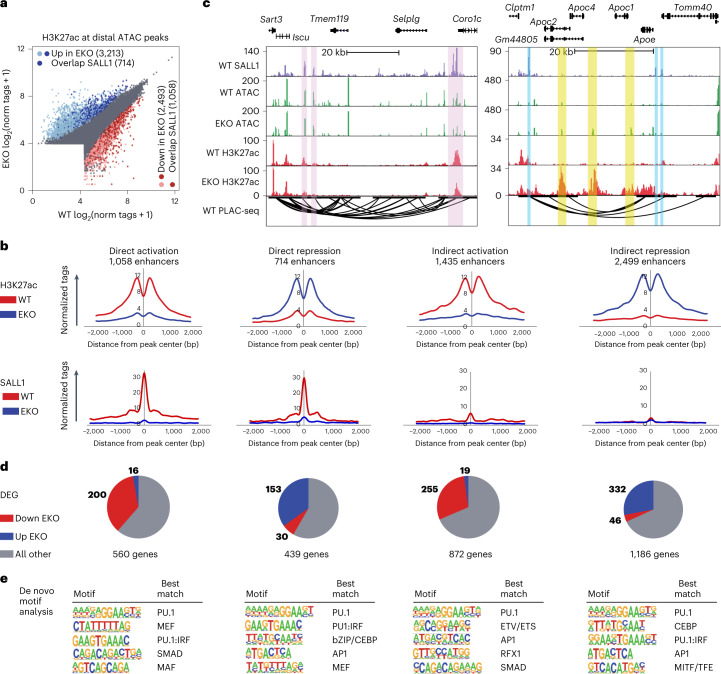
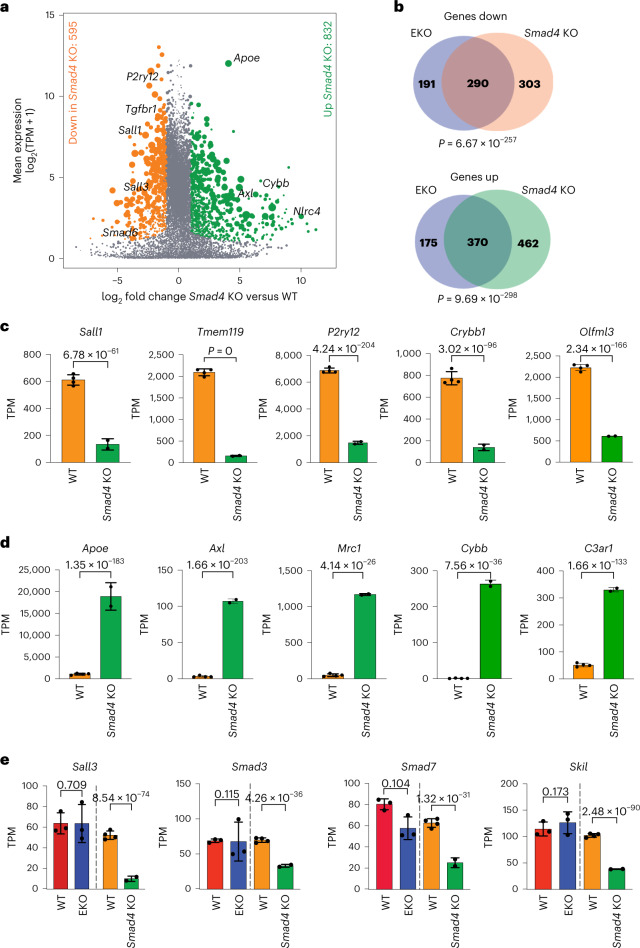
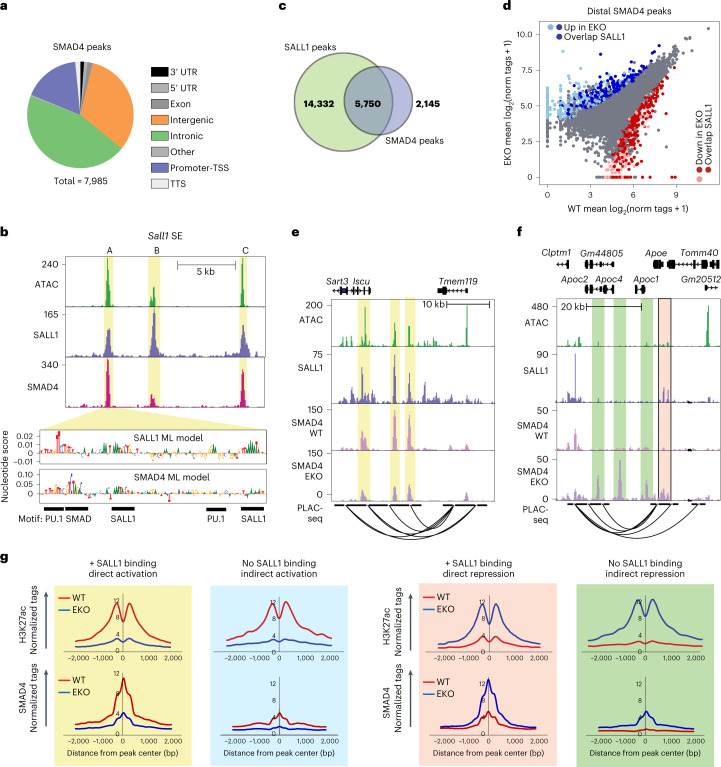
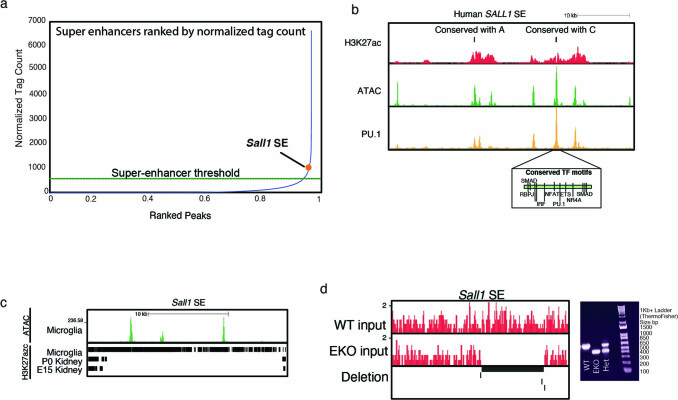
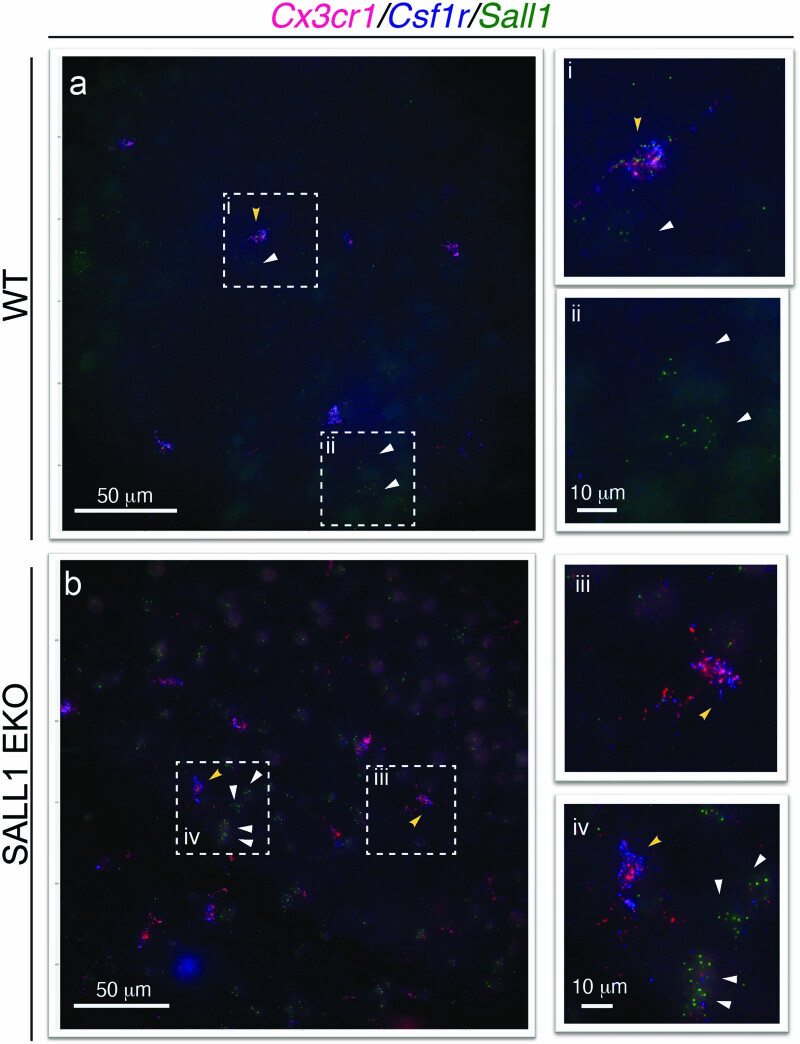
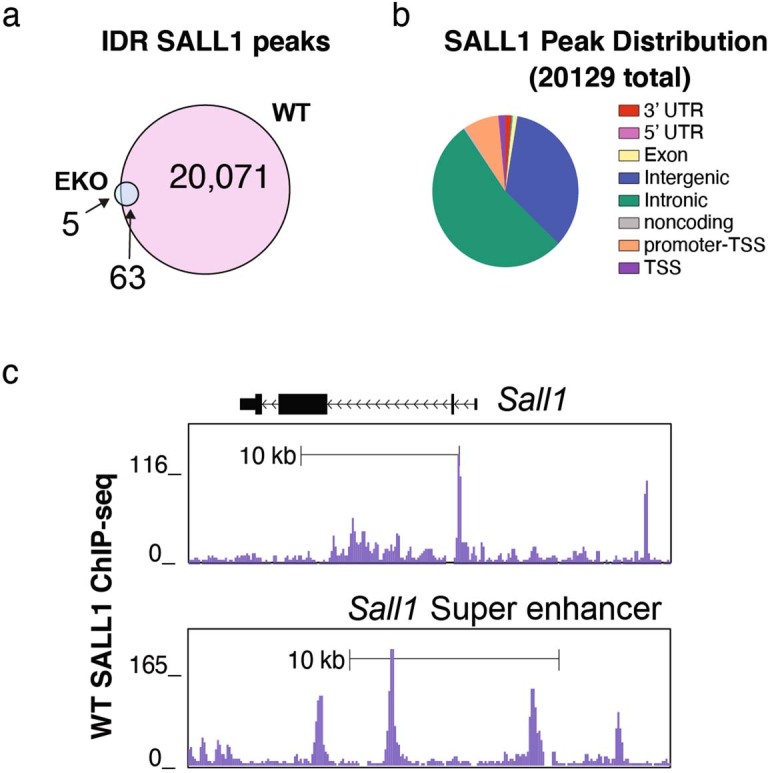
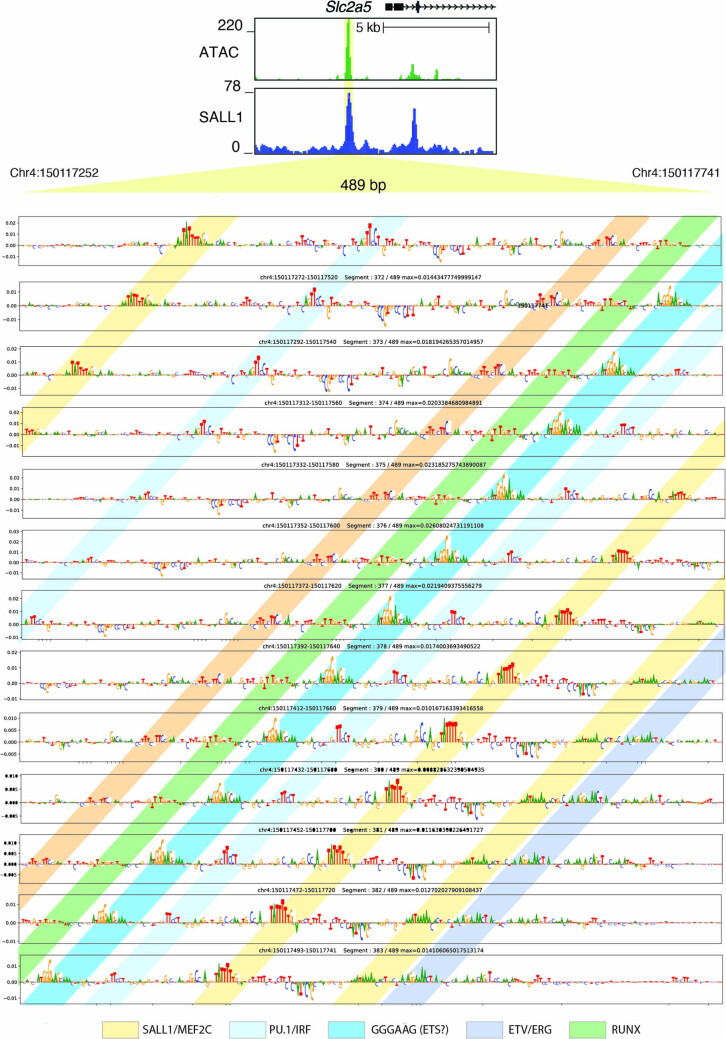
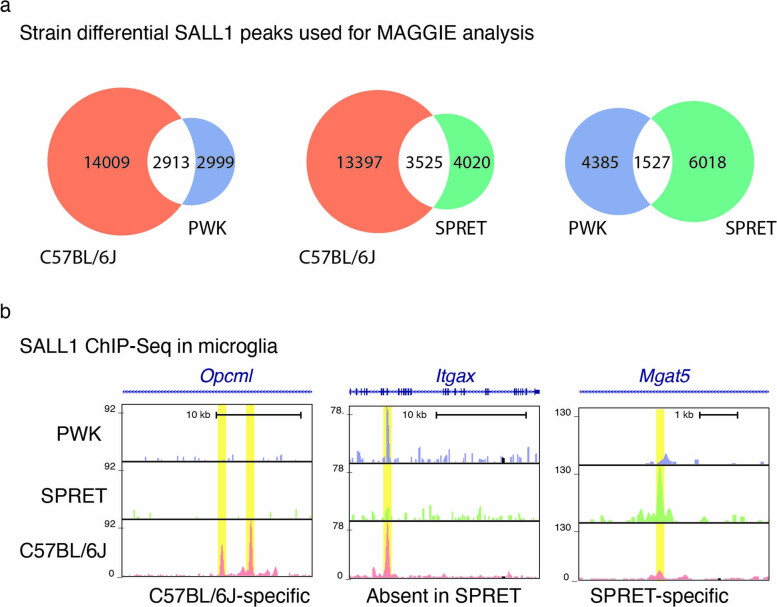
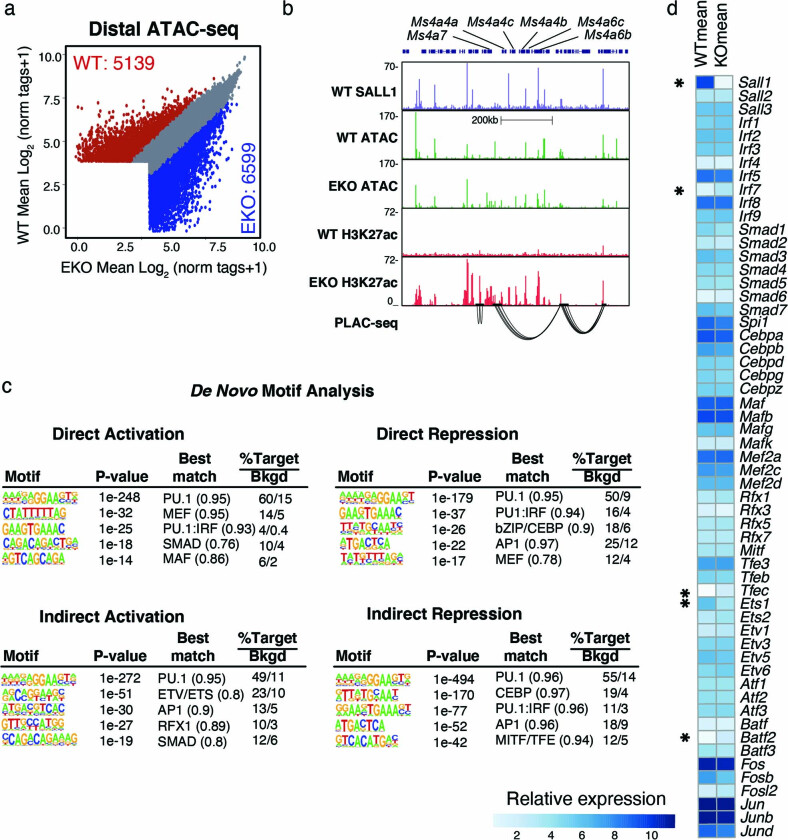
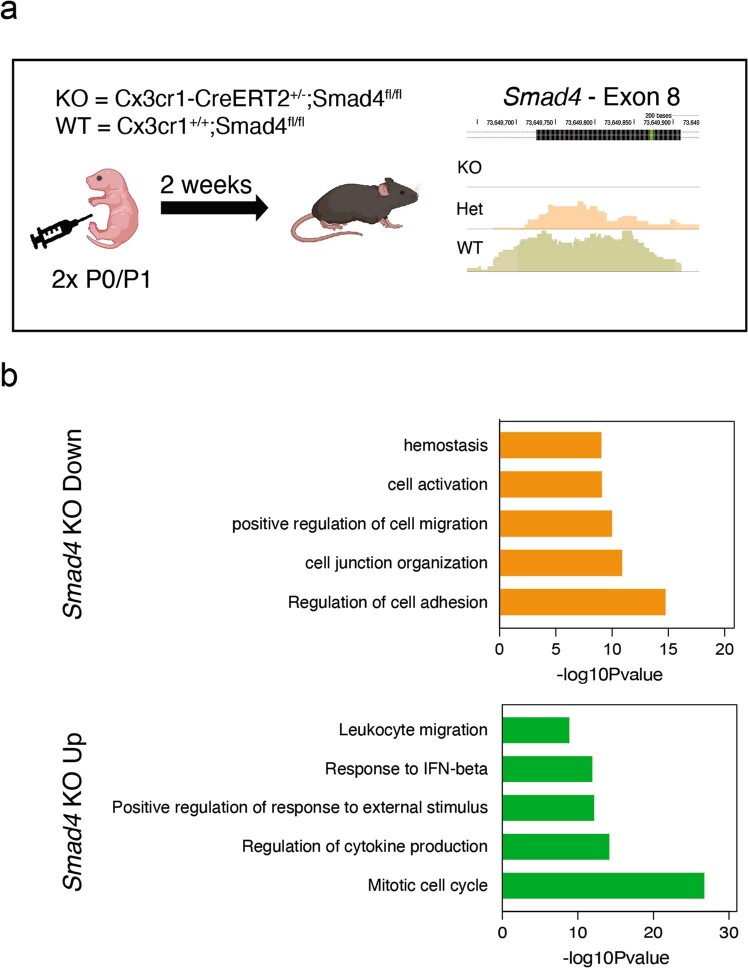
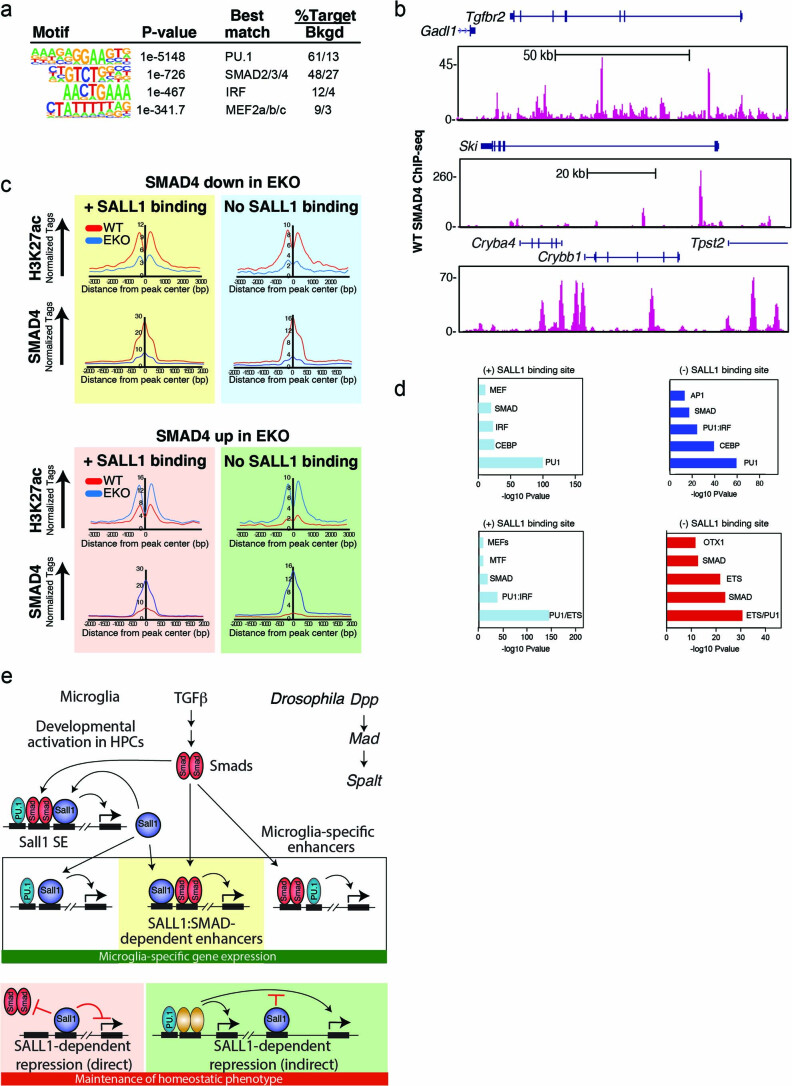
Spalt-like transcription factor 1 (SALL1) is a critical regulator of organogenesis and microglia identity. Here we demonstrate that disruption of a conserved microglia-specific super-enhancer interacting with the Sall1 promoter results in complete and specific loss of Sall1 expression in microglia. By determining the genomic binding sites of SALL1 and leveraging Sall1 enhancer knockout mice, we provide evidence for functional interactions between SALL1 and SMAD4 required for microglia-specific gene expression. SMAD4 binds directly to the Sall1 super-enhancer and is required for Sall1 expression, consistent with an evolutionarily conserved requirement of the TGFβ and SMAD homologs Dpp and Mad for cell-specific expression of Spalt in the Drosophila wing. Unexpectedly, SALL1 in turn promotes binding and function of SMAD4 at microglia-specific enhancers while simultaneously suppressing binding of SMAD4 to enhancers of genes that become inappropriately activated in enhancer knockout microglia, thereby enforcing microglia-specific functions of the TGFβ-SMAD signaling axis.


Conflict of interest statement

The authors declare no competing interests.

Figures

Fig. 1
Fig. 1. Sall1 expression is regulated by a microglia-specific SE.
a, Genome browser tracks of ATAC-seq (sorted live microglia), H3K27ac ChIP and p300 ChIP (sorted PU1 + nuclei), in addition to PLAC-seq signal at the Sall1 locus. Green shading, Sall1 gene. Yellow shading, Sall1 SE. Labels A, B and C denote the three main regions of open chromatin in the SE. Blue shading, region encompassing the Sall1 SE KO. n ≥ 2 per assay. See also Extended Data Fig. 1. b, Counts of WT, Het EKO and EKO pups after weaning. c, Bar plots for Sall1 expression in WT, Het EKO and EKO microglia (n = 3 mice/genotype). Data are represented as mean with standard deviation; p-adj from DESeq2 analysis (Wald’s test with multiple testing correction using Benjamini–Hochberg method). d, Genome browser tracks of H3K27ac ChIP in EKO and WT brain nuclei at the Sall1 locus. Microglia, sorted PU1+ nuclei; neurons, sorted NeuN+ nuclei; oligodendrocytes, sorted Olig2+ nuclei. Green shading, Sall1 gene. Yellow shading, Sall1 SE. Tracks represent combined normalized tag counts; n ≥ 2 per genotype/cell type. e, Representative confocal images of frontal cortical regions of WT and EKO brains from 6-week-old mice (n = 3 per genotype) showing DAPI, IBA1 and SALL1. White arrowheads denote location of SALL1 puncta in WT and lack of puncta in EKO. Between 120 and 150 microglia were assessed morphologically for each sample. See also Extended Data Figs. 2 and 3. f, Hi-C contact frequency map at the Sall1 locus in WT and EKO microglia, normalized by coverage (n = 2 per genotype). PC1 values denote ‘A’ euchromatin compartment (black) and ‘B’ heterochromatin compartment (gray).
Fig. 2
Fig. 2. EKO microglia exhibit a loss of microglia identity and an increased signature of aging and inflammation.
a, MA plot of RNA-seq data comparing WT and EKO microglia. n = 3 per group. DEGs (DESeq2 analysis with Wald’s test with multiple testing correction using Benjamini–Hochberg method) are defined as p-adj <0.05, FC >2 or <−2, and log2(TPM + 1) >2 in at least one group. b, Comparison of overlap between genes increased and decreased in EKO and Het EKO microglia as compared with WT microglia. P values were calculated using one-tailed Fisher exact test. See also Extended Data Fig. 4. c, Bar plots for expression of upregulated genes in WT as compared with Het EKO and EKO microglia. Red, WT; gray, Het EKO; blue, EKO. n = 3 per genotype. Data are represented as mean with standard deviation, p-adj from DESeq2 analysis (Wald’s test with multiple testing correction using Benjamini–Hochberg method) d, Bar plots for expression of downregulated genes in WT as compared with Het EKO and EKO microglia. Red, WT; gray, Het EKO; blue, EKO. n = 3 per genotype. Data are represented as mean with standard deviation, p-adj from DESeq2 analysis (Wald’s test with multiple testing correction using Benjamini–Hochberg method). e, Overlap of significantly downregulated and upregulated genes in EKO versus genes expressed more highly in microglia than other TRMs (Supplementary Table 1). P value for overlaps was calculated using one-tailed Fisher exact test. f, Bar plots for expression of DEGs between resident microglia (MG) and peripherally engrafted microglia-like cells from Shemer et al. (n = 4 per group), and in WT, Het EKO and EKO microglia from the present study (n = 3 per genotype). Data are represented as mean with standard deviation, p-adj from DESeq2 analysis (Wald’s test with multiple testing correction using Benjamini–Hochberg method). g, Heat map of DEGs (p-adj from DEseq2 <0.05) in EKO versus WT microglia that are associated with diverse microglia phenotypes (aging, the SOD model of ALS, AD risk genes, DAM, LPS-treated, LDAMs and homeostatic microglia,,). Each row is z-score-normalized counts for each gene.
Fig. 3
Fig. 3. Determinants of SALL1 DNA binding in microglia.
a, Genome browser images of SALL1 binding sites in regions of open chromatin in the vicinity of the Slc2a5 (top) and P2ry12 (bottom) genes that are positively regulated by Sall1. Panels below the browser tracks represent nucleotide importance scores defined by a machine learning model trained to predict SALL1 tag counts. Clusters of sequences with high importance scores that show similarity to TF motifs are underlined. See also Extended Data Figs. 6 and 7. b, De novo motif analysis of SALL1 peaks containing >200 tags per million at regions of open chromatin. %target is number of target sequences with motif over total target sequences; %bkgd (%background) is the number of background sequences with motif over total background sequences. P values calculated using binomial distribution in HOMER. c, Effects of natural genetic variation on SALL1 binding in microglia derived from C57BL/6J, PWK and SPRET mice. The heat map represents the corrected P values for the test of whether a SNP or InDel in the indicated motif results in a strain-specific reduction in SALL1 binding. P values were based on Wilcoxon signed-rank two-sided tests after Benjamini–Hochberg procedure to correct for multiple comparisons. See also Extended Data Fig. 7.
Fig. 4
Fig. 4. SALL1 is both an activator and repressor in microglia.
a, Scatter plot of distal ATAC-associated H3K27ac overlapping with SALL1 binding sites. ATAC: n = 5 per group; H3K27ac: n = 2 per group. Color codes indicate significant changes (light-red and light-blue are p-adj <0.05, FC >2 or <−2, calculated from DESeq2 analysis (Wald’s test with multiple testing correction using Benjamini–Hochberg method)) and significant changes overlapping with SALL1 binding sites (dark red and dark blue). See also Extended Data Fig. 8. b, Histograms of normalized H3K27ac and SALL1 counts from EKO and WT microglia at peak subsets defined in c. Red, WT; blue, EKO. c, Genome browser tracks of SALL1 binding, ATAC, H3K27ac, p300 and PLAC-seq in WT microglia, and ATAC, H3K27ac and p300 in EKO microglia at indicated genes. Pink highlights indicate regions PLAC-connected to promoters where SALL1 binds in WT and loses H3K27ac/p300 signal in EKO microglia. Blue highlights indicate regions where SALL1 binds in regions PLAC-connected to promoters, and yellow highlights indicate regions with an absence of SALL1 binding and increased H3K27ac/p300 signal in EKO microglia. d, Overlap of genes nearest to each H3K27ac subset and genes differentially expressed in EKO microglia as compared with WT microglia (p-adj <0.05, calculated from DESeq2 analysis (Wald’s test with multiple testing correction using Benjamini–Hochberg method). e, Enriched motifs in each subset of differential distal chromatin regions using GC-matched genomic background. See also Extended Data Fig. 8.
Fig. 5
Fig. 5. Loss of Smad4 phenocopies loss of Sall1.
a, MA plot of RNA-seq data comparing WT and Smad4 cKO microglia. n = 2–4 per group. DEGs were defined as p-adj <0.05, FC >2 or <−2, and log2(TPM + 1) >4 in at least one group. p-adj calculated from DESeq2 analysis (Wald’s test with multiple testing correction using Benjamini–Hochberg method). See also Extended Data Fig. 9. b, Overlap of DEGs in EKO microglia versus Smad4 cKO microglia. P value was calculated using one-tailed Fisher exact test. c, Bar plots for expression of downregulated genes in Smad4 cKO (green) as compared with WT (orange) microglia. n = 2–4 per genotype. Data are represented as mean with standard deviation, p-adj from DESeq2 analysis (Wald’s test with multiple testing correction using Benjamini–Hochberg method). d, Bar plots for expression of upregulated genes in Smad4 cKO (green) microglia as compared with WT (orange). n = 2–4 per genotype. Data are represented as mean with standard deviation, p-adj from DESeq2 analysis (Wald’s test with multiple testing correction using Benjamini–Hochberg method). e, Bar plots comparing expression of genes differentially expressed in WT versus EKO and WT versus Smad4 cKO, n = 2–4 per genotype. Data are represented as mean with standard deviation, p-adj from DESeq2 analysis (Wald’s test with multiple testing correction using Benjamini–Hochberg method).
Fig. 6
Fig. 6. SALL1 enforces a microglia-specific pattern of DNA binding and function of SMAD4.
a, Pie chart representing distribution of IDR-defined SMAD4 peaks (n = 2). UTR, untranslated region. b, Genome browser tracks of H3K27ac ChIP–seq, ATAC, and SALL1-, PU.1- and SMAD4-ChIP–seq at the Sall1 SE in WT microglia. Yellow highlights and A, B and C labels represent the three main regions of open chromatin in the SE. c, Overlap of IDR-defined SALL1 and SMAD4 peaks in WT microglia. d, Scatter plot of distal SMAD4 peaks overlapping with SALL1 binding sites. Color codes indicate significant changes (light red and light blue are p-adj <0.05, FC >2 or <−2, p-adj from DESeq2 analysis (Wald’s test with multiple testing correction using Benjamini–Hochberg method)) and significant changes overlapping with SALL1 binding sites (dark red and dark blue). e, Genome browser tracks of ATAC, SALL1 and PLAC-seq in WT microglia and SMAD4 in EKO and WT microglia at the Selplg/Tmem119 locus. Yellow highlights indicate regions where SMAD4 binding is diminished in EKO upon loss of SALL1 binding. f, Genome browser tracks of ATAC, SALL1 and PLAC-seq in WT microglia and SMAD4 in EKO and WT microglia at the Apoe locus. Pink highlight shows region where loss of direct SALL1 binding leads to increased SMAD4 signal in EKO. Green highlights demonstrate regions where SMAD4 binding increases in EKO, independent of a SALL1 binding site. g, Histograms of normalized H3K27ac and SMAD4 counts from EKO and WT microglia at peak subsets defined in c. Red, WT; blue, EKO.
Extended Data Fig. 1
Extended Data Fig. 1. Deletion of the Sall1 super-enhancer.
a. Plot of WT microglia enhancers ranked by normalized H3K27ac tag count. Dotted line represents the cutoff for an enhancer to be considered a super-enhancer. b. Genome browser of the human SALL1 super-enhancer with H3K27ac ChIP, ATAC, and PU.1 ChIP. Regions conserved with the mouse Sall1 super-enhancer Region A and Region C are marked above the H3K27ac. Conserved TF binding sites are annotated in the region homologous to mouse Region C. c. Genome browser of the mouse Sall1 super-enhancer and the overlap of mouse H3K27ac in microglia and embryonic/early postnatal kidney. d. Genome browser showing input DNA from microglia and the Sall1 SE deletion (n = 4–6 mice/geno- type over > 3 experiments). Primers used for genotyping are marked below, and results from geno- typing are shown on the right. Genotyping was performed for all mice utilized in this study (>40 mice over >12 experiments).
Extended Data Fig. 2
Extended Data Fig. 2. Single Molecule Fluorescence In Situ Hyrbidization (smFISH) for Cx3cr1, Csf1r and Sall1 mRNA in WT and Sall1 EKO brain sections.
a. WT mice. Yellow arrowhead indicates Sall1 mRNA expression in microglia as indicated by co-expression of Cx3cr1 and Csf1r mRNA (inset i). White arrowhead indicates Sall1 mRNA expression in cells lacking Cx3cr1 and Csf1r mRNA (insets i and ii). b. SALL1 EKO mice. Yellow arrowheads indicate Cx3cr1 and Csfr1 expressing microglia that do not express Sall1 mRNA (insets iii and iv). White arrowheads indicate cells that do not express Cx3cr1 or Csf1r mRNA but do express Sall1 mRNA (inset iv). for a,b - 225 ROI visualized per 4 total independent experiments.
Extended Data Fig. 3
Extended Data Fig. 3. Quantitative analysis of microglia surface area, soma size and density in different brain regions of WT and SALL1 EKO mice.
a,b. Representative brain section of the prefrontal cortex co-stained with IBA1 and DAPI. c,d,e. Prefrontal cortex - Quantification of surface area (n = 150 microglia/brain region/genotype), soma size (n = 124 microglia/brain region/geno- type), density (n = 142 microglia/brain region/genotype). f,g. Representative brain section of hippocampus co-stained with IBA1 and DAPI. h,i,j. Hippocampus - Quantification of surface area (n = 150 microglia/brain region/genotype), soma size (n = 124 microg- lia/brain region/genotype), density (n = 142 microglia/brain region/genotype). k,l. Representative brain section of striatum co-stained with IBA1 and DAPI. m,n,o. Striatum - Quantification of surface area (n = 150 microglia/brain region/genotype), soma size (n = 123 microg- lia/brain region/genotype), density (n = 150 microglia/brain region/genotype). p,q. Representative brain section of cerebellum co-stained with IBA1 and DAPI. r,s,t. Cerebellum - Quantification of surface area (n = 150 microglia/brain region/genotype), soma size (n = 123 microg- lia/brain region/genotype), density (n = 150 microglia/brain region/WT, n = 147 microglia/brain region/EKO). 15 ROIs, 4 sections per brain region, 2-3 mice/genotype. Unpaired two-tailed t-test with Welch’s correction was used to calculate significance. Data are represented as mean with s.d.
Extended Data Fig. 4
Extended Data Fig. 4. Transcriptional changes in Sall1 EKO and Het EKO microglia.
a. MA plot of RNA-seq data from WT versus Het EKO microglia. n = 3/genotype. b. Overlap of differential genes (p-adj. < 0.05 and log2FC > 1, from DESeq2 analysis (Wald’s test with multiple testing correction using Benjamini–Hochberg method)) identified in EKO microglia vs WT and Sall1 conditional knockout versus control mouse microglia from Buttgereit et al.3. P-values for overlaps were calculated using one-tailed Fisher exact test. c. Metascape GO analysis of pathways significantly changed in EKO vs WT microglia. d. Overlap of differential genes (p-adj. < 0.05 and log2FC > 1, from DESeq2 analysis (Wald’s test with multiple testing correction using Benjamini–Hochberg method)) identified in EKO vs WT microglia and engrafted vs. endogenous microglia (Shemer et al., 2018)25. P-values for overlaps calculated using one-tailed Fisher exact test. e. Flow cytometry of WT and Het EKO brain nuclei stained for PU1 and SALL1. f. Boxplot of log2FC of differential genes shared between Het and EKO microglia (n = 3/genotype). Median (center line), whiskers (max, min), box edges (25th - 75th percentile). g. Significance of gene set overlaps from Fig. 2g. P-values were calculated using one-tailed Fisher exact test for the overlap between differentially expressed genes in the Sall1 EKO vs differentially expressed genes in aging29, the SOD model of ALS29, AD risk genes32, upregulated genes in Disease Associated Microglia (DAM)30, genes upregulated in LPS29, genes upregulated in lipid droplet associated microglia (LDAMs)31 and microglia homeostatic genes10,11,40. Dotted line represents p-value = 0.05. h. Expression of Ms4 family genes in EKO and WT microglia.
Extended Data Fig. 5
Extended Data Fig. 5. SALL1 ChIP-seq in mouse microglia.
a. Overlap of WT and EKO SALL1 IDR ChIP peaks. b. Genomic distribution of SALL1 peaks. c. Genome browser tracks of WT SALL1 ChIP signal at the Sall1 promoter and super enhancer.
Extended Data Fig. 6
Extended Data Fig. 6. Nucleotide importance scores determined by a machine learning model trained to predict SALL1 tag counts.
The tracks represent importance scores calculated for tiled 250 bp sequences at 20 bp increments of the indicated 489 bp region of the putative Sall1 enhancer upstream of Slc2a5 depicted in Fig. 3a. Diagonal stripes highlight blocks of important nucleotides corresponding to TF motifs.
Extended Data Fig. 7
Extended Data Fig. 7. Strain-specific differences in SALL1 binding.
a. Quantification of similar and strain-preferential SALL1 peaks in pair-wise comparisons of peaks defined by ChIP-seq for SALL1 in microglia derived from C57BL/6 J, PWK and SPRET mice. b. Representative examples of SALL1 peaks exhibiting variation between strains at the indicated genomic locations.
Extended Data Fig. 8
Extended Data Fig. 8. SALL1 ChIP and changes in the chromatin landscape of EKO microglia.
a. Scatterplot of ATAC peaks in WT vs EKO. n = 5/group. Color codes indicate significant changes (dark red and dark blue are p-adj < 0.05, log2FC > 1, from DESeq2 analysis (Wald’s test with multiple testing correction using Benjamini–Hochberg method)). b. Genome browser of WT SALL1 ChIP and ATAC/H3K27ac ChIP in WT and EKO microglia at the Ms4 locus. c. Statistics associated with motifs illustrated in Fig. 4 (calculated from binomial distribution using HOMER). d. Heatmap of expression of TFs identified in the motif analysis in Fig. 4e in EKO and WT microglia. Stars indicate genes with expression changes log2FC > 1 or <-1 and p-adj. < 0.05 in EKO microglia, from DESeq2 analysis (Wald’s test with multiple testing correction using Benjamini–Hochberg method).
Extended Data Fig. 9
Extended Data Fig. 9. Conditional, inducible deletion of Smad4 in microglia.
a. Schematic of experimental setup for conditional Smad4 cKO mice (gen- erated in BioRender.) The indicated genotypes were treated with tamoxifen on days P0 and P1 and microglia were isolated for analysis two weeks later. The inset indicates effective excision of floxed exon 8 following tamoxifen treatment as evidenced by the absence of sequencing tags. b. Metascape GO analysis of genes significantly changed in Smad4 cKO microglia. P-values calculated from hypergenometric distribution from Mestascape.
Extended Data Fig. 10
Extended Data Fig. 10. SMAD4 ChIP in WT and EKO microglia.
a. De novo motifs identified in IDR-defined SMAD4 peaks in WT microglia. P-values calculated from binomial distribution using HOMER. b. Genome browser of WT SMAD4 binding at microglia genes and TGFβ responsive genes. c. Histogram of H3K27ac and SMAD4 signal at differential, distal SMAD4 peaks in EKO vs WT. d. De novo motif analysis of the SMAD4 peak subsets identified in panel c. P-values calculated from binomial distribution using HOMER. e. Schematic of the proposed collaboration between SALL1 and SMAD4 in determining microglia identity.

References

    1. Gomez-Nicola D, Perry VH. Microglial dynamics and role in the healthy and diseased brain: a paradigm of functional plasticity. Neuroscientist. 2015;21:169–184. doi: 10.1177/1073858414530512. - DOI - PMC - PubMed
    1. Li Q, Barres BA. Microglia and macrophages in brain homeostasis and disease. Nat. Rev. Immunol. 2018;18:225–242. doi: 10.1038/nri.2017.125. - DOI - PubMed
    1. Buttgereit A, et al. Sall1 is a transcriptional regulator defining microglia identity and function. Nat. Immunol. 2016;17:1397–1406. doi: 10.1038/ni.3585. - DOI - PubMed
    1. Kohlhase J. SALL1 mutations in Townes–Brocks syndrome and related disorders. Hum. Mutat. 2000;16:460–466. doi: 10.1002/1098-1004(200012)16:6<460::AID-HUMU2>3.0.CO;2-4. - DOI - PubMed
    1. Powell CM, Michaelis RC. Townes–Brocks syndrome. J. Med. Genet. 1999;36:89–93. - PMC - PubMed

Publication types

LinkOut - more resources