. 2023 Jul;30(7):958-969.
doi: 10.1038/s41594-023-01014-7. Epub 2023 Jun 15.

Architecture of the ESCPE-1 membrane coat

Affiliations

Architecture of the ESCPE-1 membrane coat

Carlos Lopez-Robles et al. Nat Struct Mol Biol. 2023 Jul.

Abstract

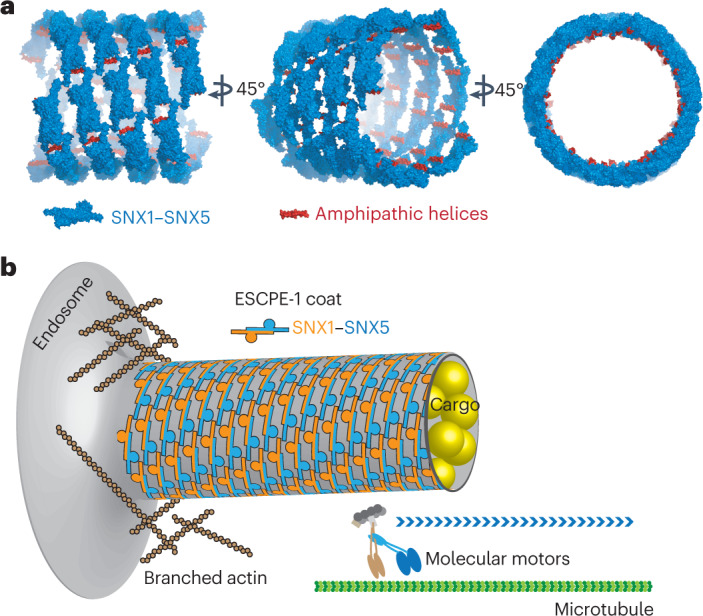
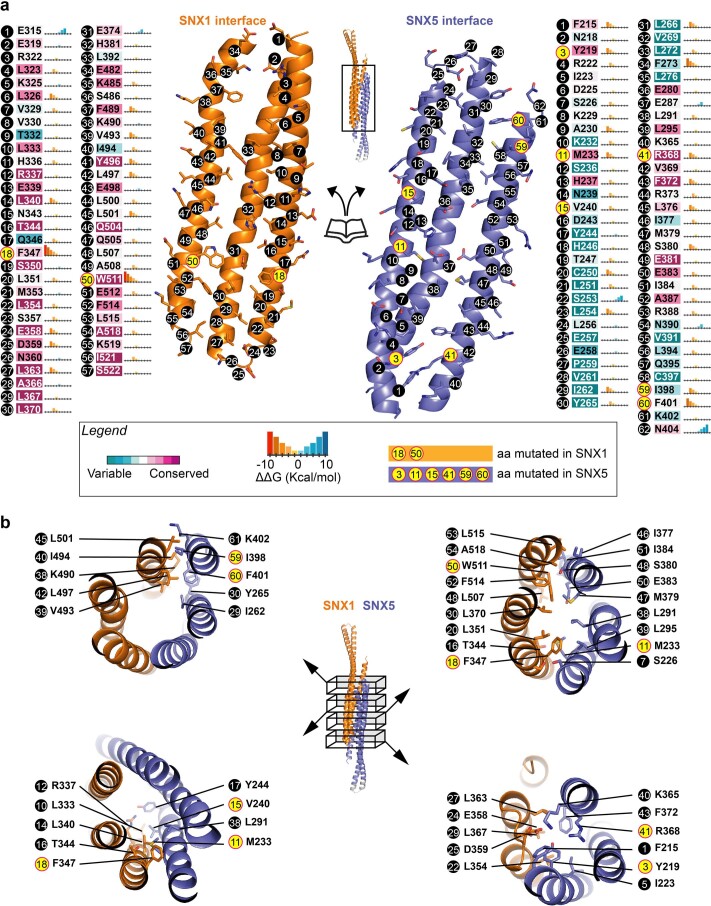
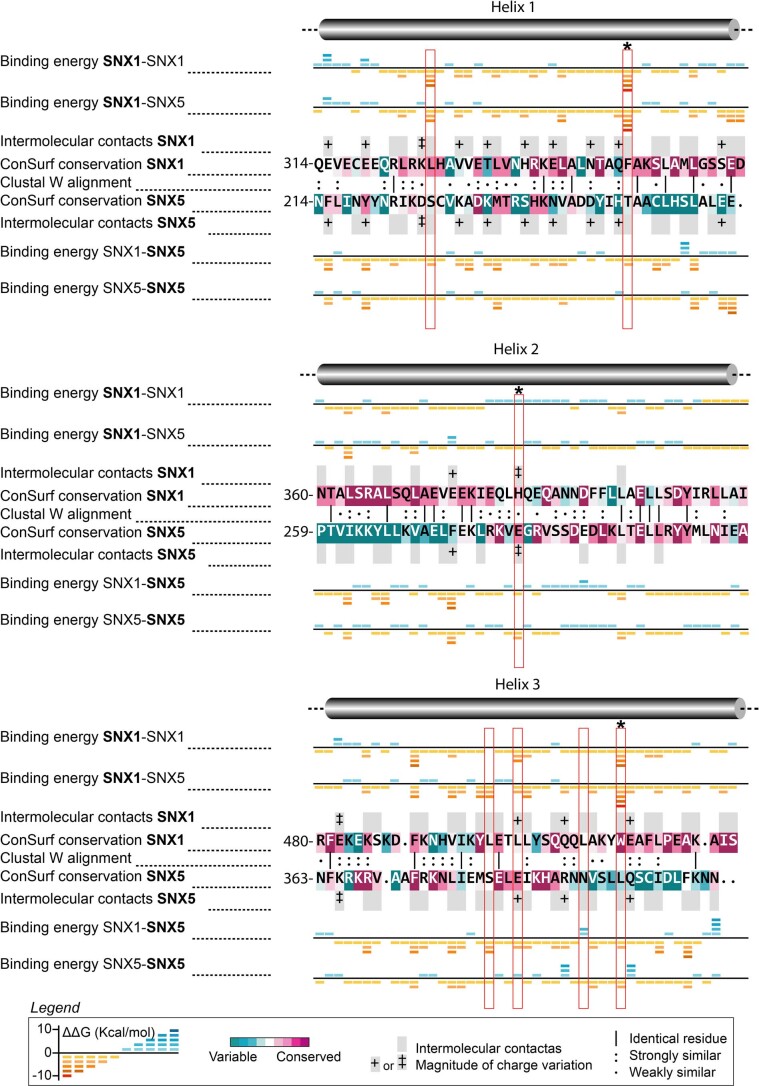
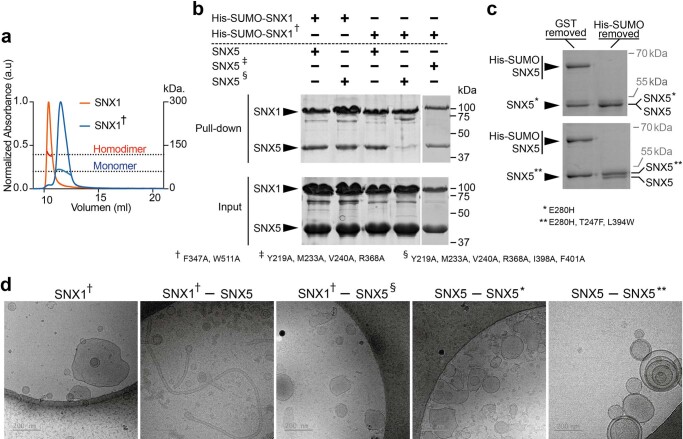
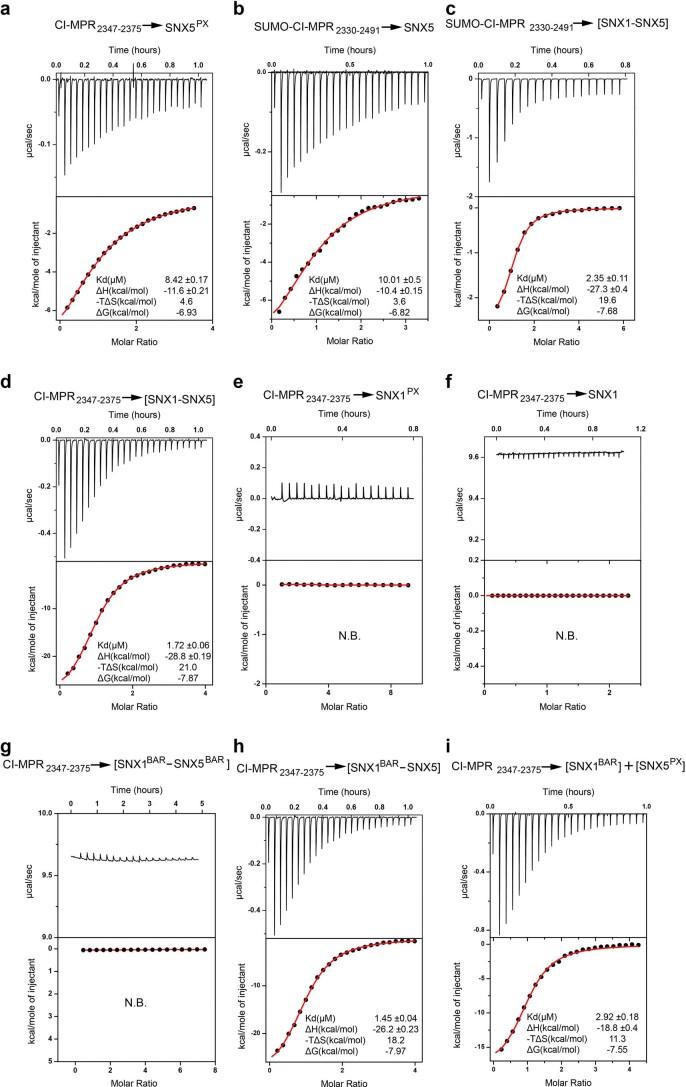
Recycling of membrane proteins enables the reuse of receptors, ion channels and transporters. A key component of the recycling machinery is the endosomal sorting complex for promoting exit 1 (ESCPE-1), which rescues transmembrane proteins from the endolysosomal pathway for transport to the trans-Golgi network and the plasma membrane. This rescue entails the formation of recycling tubules through ESCPE-1 recruitment, cargo capture, coat assembly and membrane sculpting by mechanisms that remain largely unknown. Herein, we show that ESCPE-1 has a single-layer coat organization and suggest how synergistic interactions between ESCPE-1 protomers, phosphoinositides and cargo molecules result in a global arrangement of amphipathic helices to drive tubule formation. Our results thus define a key process of tubule-based endosomal sorting.


Conflict of interest statement

The authors declare no competing interests.

Figures

Fig. 1
Fig. 1. Crystal structure of the SNX1BAR–SNX5BAR heterodimer and interface analysis.
a, SDS–PAGE and SEC–MALS analysis of full-length SNX1, SNX5 and SNX1–SNX5 showing the molecular weight difference between species. b, Structure of the human SNX1BAR–SNX5BAR heterodimer in two orthogonal views. Rc stands for radius of curvature. ce, Close-up views of the SNX1BAR–SNX5BAR heterodimer interface illustrating conserved amino-acid residues (c), energetic landscape and binding hot-spot prediction (d) and electrostatic surface potential from −5 kT e−1 (red) to 5 kT e−1 (blue) (e). f, Electrostatic surface potential of the SNX2BAR–SNX6BAR heterodimerization interface generated by homology modeling. Results in a are representative of at least three independent experiments. Source data
Fig. 2
Fig. 2. Membrane recruitment and coat organization is influenced by dimerization, phosphoinositides and cooperative interactions with cargo.
a, Effects of SNX1 and SNX5 interface mutations on the association with liposomes (DOPC:DOPE:DOPS:PtdIns(3)P:Liss Rhod PE in a 45:28:20:5:2 molar ratio) by flotation assay. MW, molecular weight marker. Note that association with the membrane was enhanced by dimerization of full-length SNXs but not by heterodimers of BAR domains alone. All SDS–PAGE samples that originated from flotation assays were normalized relative to their Liss Rhod PE content. b, Liposome flotation analyses to characterize the binding of SNX5, SNX1 and SNX1PX to specific phosphoinositides. Note that only full-length SNX1 interacts specifically with PtdIns(3)P, and to a minor extent with PtdIns(4,5)P2, PtdIns(3,5)P2 and PtdIns(3,4)P2. c, CI-MPR promotes membrane recruitment of SNX5, and this effect is enhanced in the presence of SNX1. Flotation assay of liposomes functionalized with the cytosolic tail of CI-MPR. CI-MPR was conjugated with increasing concentrations of DSPE-Mal on the surface of liposomes containing no phosphoinositides to exclude their specific interaction with SNX1. aa, amino acids. d, SNX1BAR domain enhances the interaction between the PX domain of SNX5 and CI-MPR. Summary of Kd values between CI-MPR and SNX1–SNX5 or various subdomains from the heterodimer. Values are the mean ± s.d. from at least two independent experiments. N.B. no binding. e, Representative cryo-transmission electron microscopy (cryo-TEM) images of liposomes (DOPC:DOPE:DOPS:PtdIns(3)P in a 45:30:20:5 molar ratio) incubated with SNX1–SNX5 in the absence (i) or presence (ii) of the cytoplasmic tail of CI-MPR. f, Representative cryo-TEM images of liposomes incubated with SNX1–SNX5 and the cytoplasmic tail of CI-MPR in the presence of PtdIns(3,4)P2 (i) or in the absence of PtdIns (ii). Data are representative of three (ac) or two (e, f) independent experiments. Source data
Fig. 3
Fig. 3. Cryo-ET structure of the membrane-associated ESCPE-1 complex.
a, Sections from a tomogram of a representative tube showing a cut of the tube and its surface. Top and side views are highlighted. b, Final average of subtomograms that include three particles. c, Average of subtomograms from individual particles. d, One-particle averages placed at corresponding coordinates on a representative tube. e, Two possible orientations of the SNX1–SNX5 heterodimer are shown relative to the helical filament. f, Projection of neighborhood plot using all particles. The distances and angles were computed in 3D (using k-means clustering). g, Cross-section (averaged over 15 pixels) through the center of the three-heterodimer map from all particles. Arrowheads denote the radius of curvature for each leaflet of the membrane and the protein coat. The inset shows where the cross-section average was made. h, Comparison of membrane lattice scaffolds of the mammalian SNX1–SNX5 heterodimer (current study), the mammalian SNX1 dimer and the fungal VPS5 dimer solved in the context of the retromer complex. Upper row shows four dimers in different colors at equivalent positions on each lattice. Lower row shows a cartoon representation for each lattice.
Fig. 4
Fig. 4. Lattice-forming contacts of the ESCPE-1 coat drive membrane tubulation.
a, Isosurface of the three-particle subtomogram average radially colored based on distance from tube axis to the outer membrane leaflet in yellow. Blue arrowhead indicates the middle section of one BAR heterodimer that does not contact the membrane. b, Zoomed-in view of the membrane-associating face with the fitted atomic model of the SNX1–SNX5 heterodimer. Structural elements in contact with the membrane are in yellow. AH, amphipathic helix. c, Cross-section through the one-particle subtomogram average illustrates the two amphipathic helices that connect the PX and BAR domains in SNX1 and SNX5. d, Overlay of ribbon and the electron-density map showing a top view of the structural elements interconnecting neighboring molecules. e, Rotated view from d showing the CI-MPR binding site. f, Location of introduced mutations. g,h, Incubation of the SNX1–SNX5 heterodimer with mutations at both SAH regions (g) or at both BARtip regions (h) is unable to induce tubulation of synthetic liposomes. Data in g and h are representative of two independent experiments.
Fig. 5
Fig. 5. Requirement of BARtip-to-BARtip and BARtip-to-PX interactions for endosomal association of SNX1 and SNX5.
a, Immunoblot analysis of WT, double SNX1-2 KO and double SNX5-6 KO HT1080 cells using antibodies to the proteins indicated on the right. b, Mutations introduced in the BARtip and PXSAH regions. c, Immunoblot analysis of WT, double SNX1-2 KO and double SNX5-6 KO cells stably transduced with plasmids encoding HA-tagged WT and mutant SNX1 and SNX5 constructs, using antibodies to the proteins indicated on the right. d, Double SNX1-2 KO and double SNX5-6 KO HT1080 cells were transiently transfected with plasmids encoding GFP-tagged WT or mutant SNX constructs, as indicated in the figure. Cells were imaged live by confocal microscopy. GFP channels are shown in gray scale, and cell edges are indicated by dashed lines. Scale bars, 10 μm. e, Efficiency of SNX recruitment to punctate intracellular membranes was estimated using the Find Maxima function of ImageJ/Fiji. Fewer local maxima are identified in cells with increased cytosolic GFP signal. Data in a and c are representative of three independent experiments. For d and e, the number of local maxima for at least 20 cells per condition was normalized to the average number of local maxima in WT cells and plotted as SuperPlots. In e, horizontal lines indicate the mean ± s.d. of the means from three experiments for SNX1 (top panel) and four experiments for SNX5 (bottom panel). Statistical significance was calculated by one-way ANOVA with multiple comparisons to the SNX WT control using Dunnett’s test; P values are indicated on the plots. Source data
Fig. 6
Fig. 6. Requirement of BARtip-to-BARtip and BARtip-to-PX interactions for the function of SNX1 and SNX5 in the export of CI-MPR from endosomes.
a, Immunofluorescence microscopy of fixed-permeabilized double SNX1-2 KO and double SNX5-6 KO HT1080 cells stably transduced with HA-tagged WT or BT-SAH* mutant SNX1 or SNX5. Cells were immunostained for the HA epitope and nuclei (DAPI; blue). Scale bars, 10 μm. The experiment was repeated twice with similar results. b, WT, untransduced and stably transduced double KO HT1080 cells were immunostained for the CI-MPR (magenta), early endosomes (green) and nuclei (blue), and examined by confocal fluorescence microscopy. Scale bars, 10 μm. Enlarged views of the boxed areas in the merged images are shown on the right column. Scale bars, 5 μm. c, PCC of colocalization between CI-MPR and EEA1 from experiments such as that shown in b. PCCs were calculated for 30 cells in each of three independent experiments. Data are represented as SuperPlots showing the individual data points in each experiment, the mean from each experiment and the mean ± s.d. of the means. Statistical significance was analyzed by one-way ANOVA with multiple comparisons using Tukey’s test; P values are indicated on the plots. Source data
Fig. 7
Fig. 7. A schematic model for how ESCPE-1 assembles on membranes.
a, 3D reconstruction of the ESCPE-1 coat. The SNX1–SNX5 atomic model has been fitted and symmetrized according to the arrangement calculated from the three-start helix parameters. Amphipathic helices responsible for the lateral expansion of lipids are in red. b, Model for the endosomal sorting of ESCPE-1 cargos. The presence of cargo promotes SNX1–SNX5 recruitment and the shaping of a tubular carrier in conjunction with pushing forces produced by actin polymerization and pulling forces produced by molecular motors.
Extended Data Fig. 1
Extended Data Fig. 1. Structural comparison of BAR domains and PX-BAR proteins.
(a) Liposome tubulation ability. Representative cryo-TEM images of liposomes prepared with a defined lipid composition of DOPC/DOPE/DOPS/PtdIns(3)P (45:30:20:5 molar ratio) and incubated with SNX1 homodimers, SNX1-SNX5 heterodimer or monomeric SNX5. (b) MAD density map (blue) contoured at 1.5σ and Pt anomalous difference map (magenta) contoured at 4.0σ superimposed on the refined structure. Sidechains of H246, C318 and M414 are highlighted in yellow as examples of platinum binders. (c) Comparison of the curvature of SNX1BAR-SNX5BAR heterodimer with other BAR domains. To evidence differences in curvature, the structures were compared by superimposing SNX1BAR with one subunit from each dimer. (d) 2Fo-Fc electron density map (contour 1.0 σ) at the tip of the SNX5BAR domain. The main chain is shown as a tube (slate color) and side chains are shown as sticks. Predicted structures by the DaReUS-Loop web server are superimposed over the crystal structure. Model 1 represents the structure with the lowest statistical potential as determined by KORP. (e) Left side ConSurf analysis showing surface conservation of amino-acid residues within the heterodimeric SNX1BAR-SNX5BAR. Right side illustrates electrostatic surface potential viewed in the same orientations as in the left side. The scale ranges from −5 kT e-1 (red) to 5 kT e-1 (blue). (f) SNX1BAR superposed with SNX5BAR through the central region highlighting the structural variations between the distal arms. (g) Superposition of known PX-BAR structures (SNX33, PDB 4AKV [to be published]; SNX9, PDB 2RAI; Mvp1, PDB 6Q0X over the SNX1BAR-SNX5BAR heterodimer. Data in a are representative of three independent experiments.
Extended Data Fig. 2
Extended Data Fig. 2. Interface characterization.
(a) Detailed per-residue conservation and energetic analysis of the SNX1BAR-SNX5BAR interface. Mutated residues that affect dimer formation are highlighted in yellow. (b) Detailed view of neighboring sites of amino acids that were mutated at the proximal and central regions of the BAR domains to interfere with dimerization.
Extended Data Fig. 3
Extended Data Fig. 3. Pairwise comparison of interfaces.
Alignment generated from the structural superposition of SNX1BAR and SNX5BAR central regions. Alignments also include per-residue energetic contribution in theoretical SNX1 and SNX5 homodimers generated by homology modeling using our SNX1BAR-SNX5BAR crystal structure as template. Energetic values in each row correspond to the molecule highlighted in bold within the respective complex. Red boxes mark residues that were mutated to interfere with dimerization. Red boxes with an asterisk indicate residues that were mutated to promote SNX5 dimerization.
Extended Data Fig. 4
Extended Data Fig. 4. SNX1BAR-SNX5BAR interface validation.
(a) SEC-MALS analysis of F347A, W511A double mutant on the SNX1 (SNX1) interface that precludes its homodimerization. (b) Affinity pull down assay for mutants influencing SNX1 heterodimerization. (c) Tandem affinity purification of SNX5 induced homodimers. SNX5WT was tagged with His-SUMO, and single (*) or triple (**) SNX5 mutants were tagged with GST. The complex was purified from combined cell lysates. Left lane shows the dimer with the His-SUMO tag still on SNX5. (d) Liposome tubulation ability of SNX1 and SNX5 proteins with mutations at interfaces affecting their dimerization capacity. Results in a-d are representative of two independent experiments. Source data
Extended Data Fig. 5
Extended Data Fig. 5. SNX1BAR domain enhances the interaction between the PX domain of SNX5 and CI-MPR.
Representative ITC experiments for the binding of the cytosolic region of CI-MPR (amino acids 2330-2491) (panels b, c), or the bipartite sorting motif (amino acids 2347-2375) (panels a, d-i) titrated into ESCPE-1 or selected subdomains. Top panels show the raw data and bottom panels represent the integrated and normalized data fit with a 1:1 binding model. Data are representative of at least two independent experiments.
Extended Data Fig. 6
Extended Data Fig. 6. Lattice geometry and cryo-ET data processing workflow.
(a) Overlap of projections of coordinates from all selected tubes. No preferred orientation can be seen. (b) Distribution of number of helical starts of all analyzed tubes. (c) Fourier shell correlation (FSC) curve for the final 3-particle map. (d) Fourier shell correlation (FSC) curve for the final 1-particle map. (e) Definition of the analyzed helix parameters (pitch, lead, lead angle, channel width) and relations to neighboring particles (a, b, alpha, beta). (f) Tube radius (mean +/− SD) related to number of helical starts N. Mean and standard deviation have been computed on the available number of filaments detected for each N: 10 filaments for N = 1, 57 filaments for N = 2, 49 filaments for N = 3 and 65 filaments for N = 4. (g) Distances between the centers of the particles related to N. (h) Helical pitch and channel width related to N. Helical pitch is presented as mean values +/− SD. (i) Angle alpha related to N. (j) Angle beta related to N. (k) Cryo-ET data processing workflow. (l) Average of subtomograms from individual particles displaying local resolution (Å) coloured from highest resolution (red) to lowest resolution (dark blue).
Extended Data Fig. 7
Extended Data Fig. 7. ESCPE-1 lattice scaffold is different from that of the SNX1 dimer and the fungal VPS5 dimer, and is unable to recruit retromer.
(a) Comparison of membrane lattice scaffolds of (i) the mammalian SNX1-SNX5 heterodimer (current study), (ii) the mammalian SNX1 dimer, and (iii) the fungal VPS5 dimer solved in the context of retromer complex. Surface coverage calculations were done assuming an average coverage of the membrane of ≈50 nm for each PX-BAR dimer. (b) Representation of the intermolecular contacts on the VPS5 lattice (colored in dark red) involved in the association with the VPS26 subunit of the retromer complex. Note that the distribution of contacts on two adjacent BAR domains (green and yellow, or pink and blue) from separate dimers is not conserved in the SNX1 or SNX1-SNX5 lattices. (c) In flotation assays, (i) retromer (VPS35-VPS29-VPS26 subunits) was recruited by SNX3 and the DMT1-II550-568 sorting motif to liposomes (DOPC/DOPE/DOPS/PtdIns(3)P/Liss Rhod-PE 45:28:20:5:2 molar ratio) whereas (ii) retromer was not recruited by SNX1-SNX5 and the CI-MPR cargo. Results in c are representative of three independent experiments.
Extended Data Fig. 8
Extended Data Fig. 8. Mutations within the SAH regions, or within the BAR-TIP regions in ESCPE-1 affect cargo binding and interfere with membrane association.
(a) Summary of Kds between the CI-MPR bipartite sorting motif (amino acids 2347-2375) titrated into the SNX1-SAH3A:SNX5-SAH3A mutant or the SNX1- BT*:SNX5- BT* mutant. Values are the mean and standard deviation (SD) from two independent experiments. (b) Representative ITC experiments for the binding of the previous SAH3A and BT* mutants. Top panels show the raw data and bottom panels represent the integrated and normalized data fit with a 1:1 binding model. (c) Circular dichroism (CD) spectra of SNX1WT-SNX5WT, the SNX1-SAH3A:SNX5-SAH3A mutant, and the SNX1- BT*:SNX5- BT* mutant. (d) Liposome flotation assay of SNX1WT-SNX5WT, the SNX1-SAH3A:SNX5-SAH3A mutant, and the SNX1-BT*:SNX5-BT* mutant. The liposome composition was: DOPC/DOPE/DOPS/PtdIns(3)P/Liss Rhod-PE 45:28:20:5:2 molar ratio. Data are representative of two (a-c), or three (d) independent experiments.
Extended Data Fig. 9
Extended Data Fig. 9. Requirement of BARtip-to-BARtip and BARtip-to-PX interactions for endosomal association of SNX1 and SNX5 in WT cells.
(a) Immunofluorescence microscopy of fixed-permeabilized WT HT1080 cells transiently transfected with plasmids encoding GFP-tagged WT and mutant SNX1 or SNX5 constructs, and stained for early endosomes (EEA1; red), and nuclei (DAPI; blue). Because of the low expression levels of GFP-SNX5 constructs, the GFP-SNX5 signal was enhanced by immunostaining with antibody to GFP. Scale bars: 10 μm. Insets are magnified views of the boxed areas. Scale bars: 5 μm. (b) Graphs showing the Pearson’s correlation coefficient (PCC) between GFP-tagged proteins and EEA1 calculated from following number of cells in the experiment shown in panel A. For GFP-SNX1, n = 33 in WT, n = 29 in BT, n = 51 in SAH and n = 31 in BT-SAH. For GFP-SNX5, n = 30 in WT, n = 31 in BT, n = 33 in SAH, n = 32 in BT-SAH. The graphs show the individual data points and the mean ± SD of the data. Statistical significance was calculated by one-way ANOVA with multiple comparisons to the SNX WT control using Dunnett’s test with the number of cells indicated above. p-values are indicated on the plots. Source data

References

    1. Faini M, Beck R, Wieland FT, Briggs JAG. Vesicle coats: structure, function, and general principles of assembly. Trends Cell Biol. 2013;23:279–288. - PubMed
    1. Chen K-E, Healy MD, Collins BM. Towards a molecular understanding of endosomal trafficking by Retromer and Retriever. Traffic. 2019;20:465–478. - PubMed
    1. McNally KE, Cullen PJ. Endosomal retrieval of cargo: retromer is not alone. Trends Cell Biol. 2018;28:807–822. - PubMed
    1. Chandra, M. & Collins, B. M. in Protein Reviews – Purinergic Receptors Vol. 20 (ed. Atassi, M.) Ch. 1 (Springer, 2019).
    1. Simonetti B, et al. Molecular identification of a BAR domain-containing coat complex for endosomal recycling of transmembrane proteins. Nat. Cell Biol. 2019;21:1219–1233. - PMC - PubMed

Publication types

MeSH terms