

Biogenic apatite in carbonate concretions with and without fossils investigated in situ by micro-Raman spectroscopy
- PMID: 37322242
- PMCID: PMC10272169
- DOI: 10.1038/s41598-023-36566-7
Biogenic apatite in carbonate concretions with and without fossils investigated in situ by micro-Raman spectroscopy
Abstract
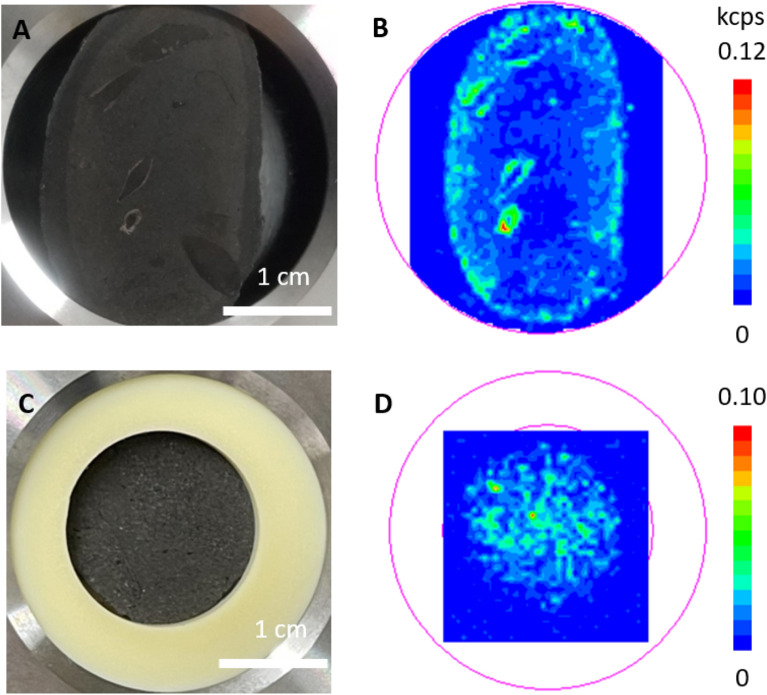
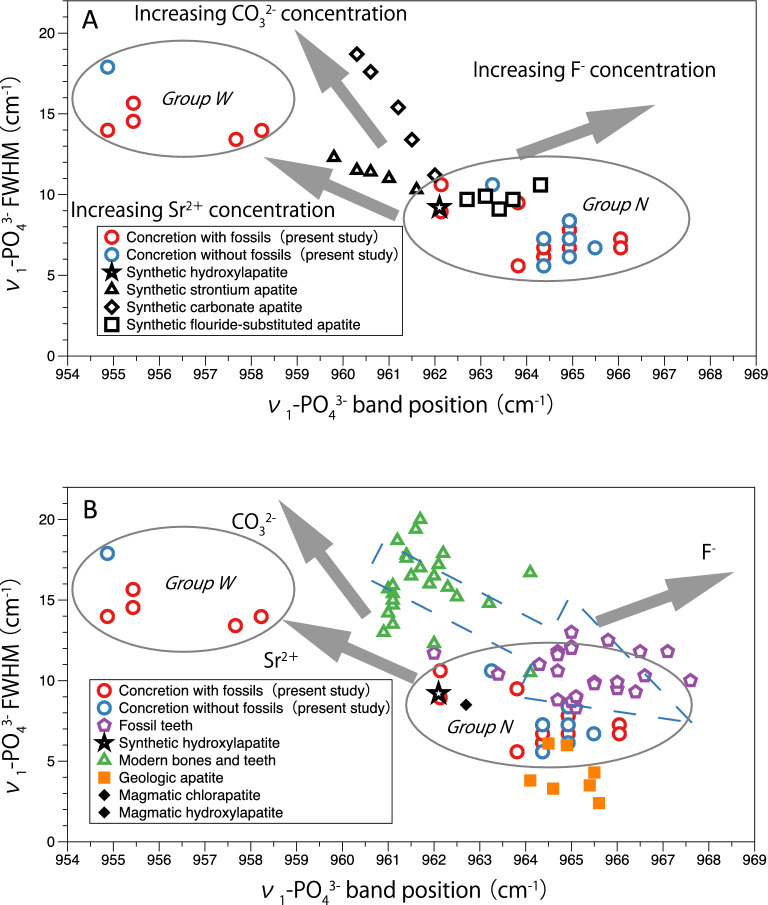
Micro-Raman spectra of concretions with and without fossils were measured in a nondestructive manner. The band position and full width at half maximum height (FWHM) of ν1-PO43- of apatite in the concretions were analyzed to investigate the origin of apatite. The analyzed concretions were derived from the Kita-ama Formation of the Izumi Group, Japan. The micro-Raman analysis showed that the apatites in the concretions were divided into two groups: Group W (wide FWHM group) and Group N (narrow FWHM group). The apatite belonging to Group W is suggested to be biogenic apatite originating from the soft body tissues of organisms because the Sr content is high and the FWHM is similar to that of apatite in bones and teeth of present-day animals. The other apatite belonging to Group N is considered affected by the diagenetic process because of its narrow FWHM and F substitution. These features of both groups were observed regardless of the presence of fossils or absence of fossils in the concretions. This Raman spectroscopic study suggests that the apatite at the time of concretion formation belonged to Group W but was changed to Group N by the substitution of F during the diagenesis process.
© 2023. The Author(s).
Conflict of interest statement
The authors declare no competing interests.
Figures

Similar articles
-
Raman hyperspectral imaging as an effective and highly informative tool to study the diagenetic alteration of fossil bones.Talanta. 2018 Mar 1;179:167-176. doi: 10.1016/j.talanta.2017.10.059. Epub 2017 Oct 31. Talanta. 2018. PMID: 29310218
-
Carbonate assignment and calibration in the Raman spectrum of apatite.Calcif Tissue Int. 2007 Jul;81(1):46-52. doi: 10.1007/s00223-007-9034-0. Epub 2007 Jun 6. Calcif Tissue Int. 2007. PMID: 17551767
-
Bone diagenesis and stratigraphic implications from Pleistocene karst systems.Sci Rep. 2025 Feb 14;15(1):5496. doi: 10.1038/s41598-025-88968-4. Sci Rep. 2025. PMID: 39952997 Free PMC article.
-
Microbially mediated fossil concretions and their characterization by the latest methodologies: a review.Front Microbiol. 2023 Sep 29;14:1225411. doi: 10.3389/fmicb.2023.1225411. eCollection 2023. Front Microbiol. 2023. PMID: 37840715 Free PMC article. Review.
-
Compositional assessment of bone by Raman spectroscopy.Analyst. 2021 Dec 6;146(24):7464-7490. doi: 10.1039/d1an01560e. Analyst. 2021. PMID: 34786574 Free PMC article. Review.
Cited by
-
Visualization and identification of components in a gigantic spherical dolomite concretion by Raman imaging in combination with MCR or CLS methods.Sci Rep. 2024 Jan 7;14(1):749. doi: 10.1038/s41598-024-51147-y. Sci Rep. 2024. PMID: 38185706 Free PMC article.
-
Enzymatic phosphatization of fish scales-a pathway for fish fossilization.Sci Rep. 2024 Apr 9;14(1):8347. doi: 10.1038/s41598-024-59025-3. Sci Rep. 2024. PMID: 38594297 Free PMC article.
References
-
- Coleman ML. Microbial processes: Controls on the shape and composition of carbonate concretions. Mar. Geol. 1993;113:127–140. doi: 10.1016/0025-3227(93)90154-N. - DOI
-
- McCoy VE. Concretions as agents of soft-tissue preservation: A review. Paleontol. Soci. Pap. 2014;20:147–162. doi: 10.1017/S1089332600002849. - DOI
-
- Boles JR, Landis CA, Dale P. The Moeraki Boulders; Anatomy of some septarian concretions. J. Sediment. Geol. 1985;55:398–406. doi: 10.1306/212F86E3-2B24-11D7-8648000102C1865D. - DOI
MeSH terms
Substances
LinkOut - more resources
Full Text Sources
Research Materials
