

Brain pericytes in culture display diverse morphological and functional phenotypes
- PMID: 37322257
- PMCID: PMC10693527
- DOI: 10.1007/s10565-023-09814-9
Brain pericytes in culture display diverse morphological and functional phenotypes
Abstract
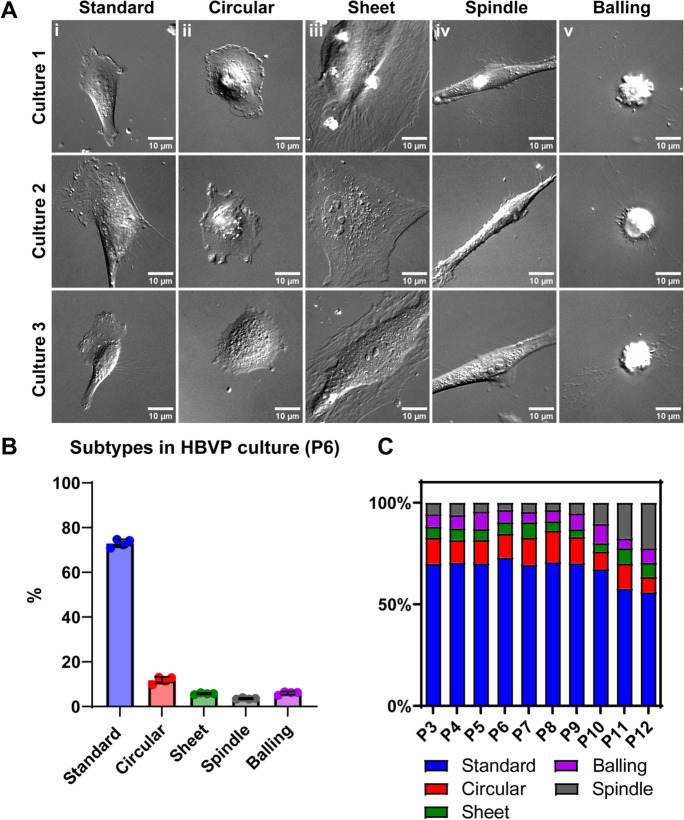
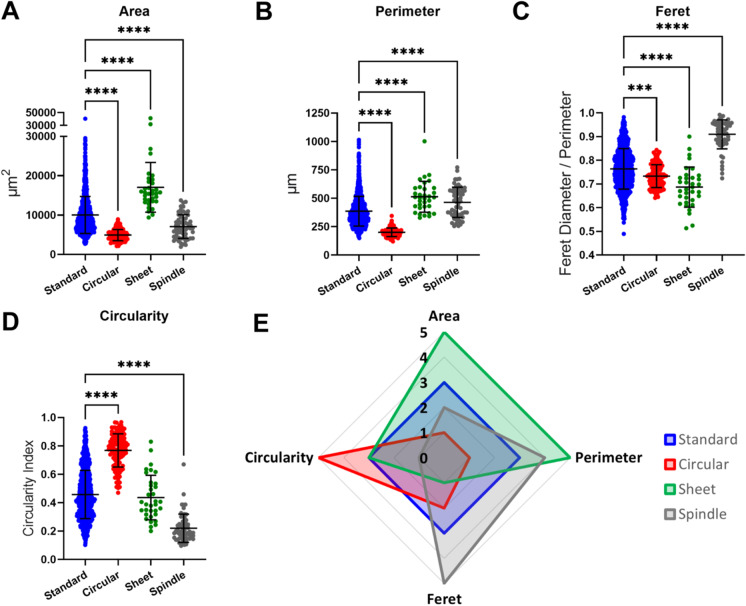
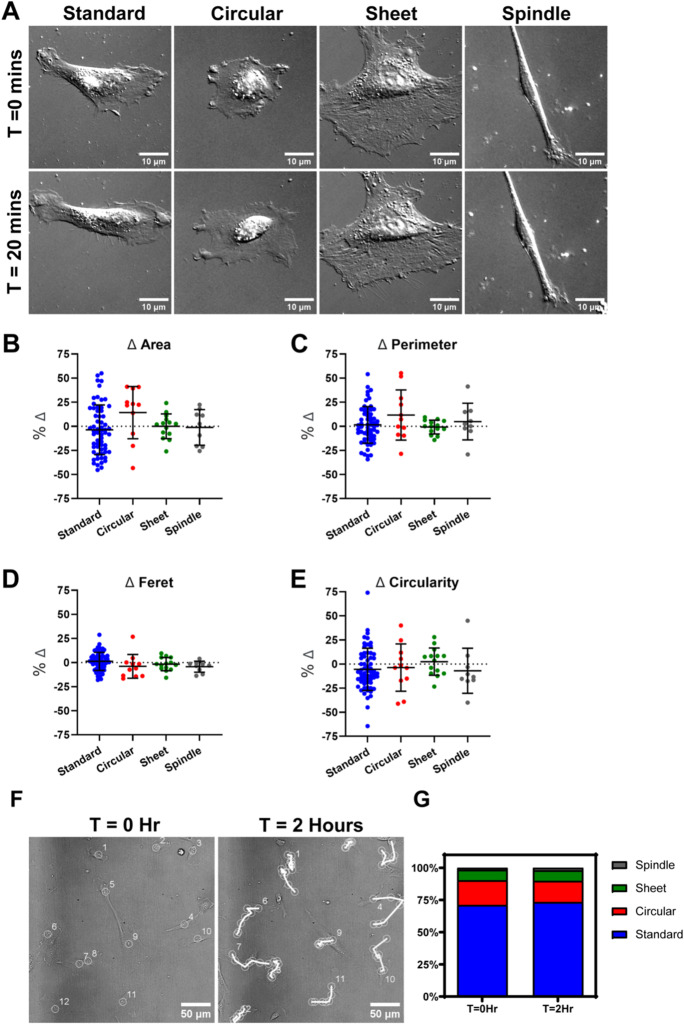
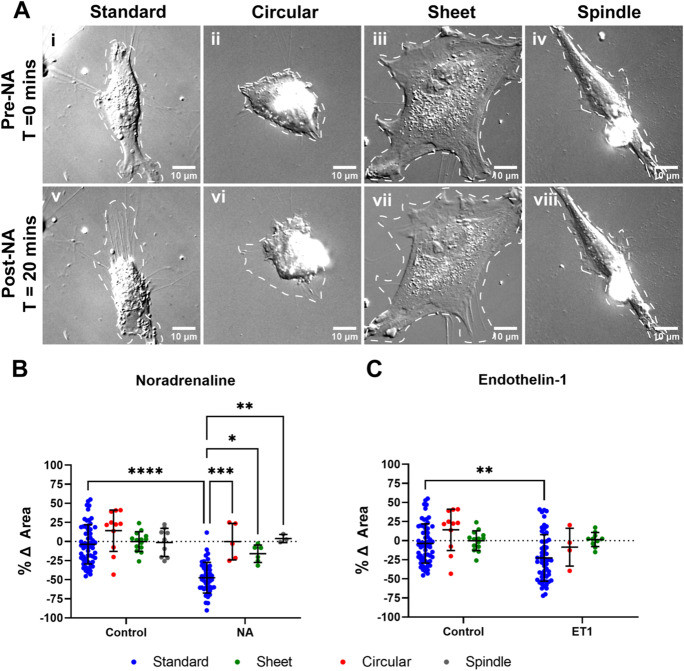
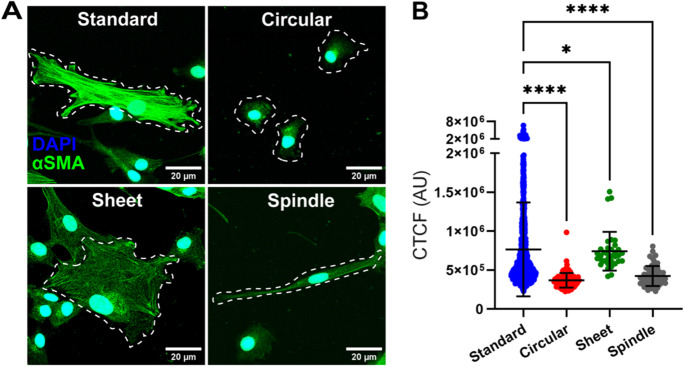
Pericytes play several important functions in the neurovascular unit including contractile control of capillaries, maintenance of the BBB, regulation of angiogenesis, and neuroinflammation. There exists a continuum of pericyte subtypes along the vascular tree which exhibit both morphological and transcriptomic differences. While different functions have been associated with the pericyte subtypes in vivo, numerous recent publications have used a primary human brain vascular pericytes (HBVP) cell line where this pericyte heterogeneity has not been considered. Here, we used primary HBVP cultures, high-definition imaging, cell motility tracking, and immunocytochemistry to characterise morphology, protein expression, and contractile behaviour to determine whether heterogeneity of pericytes also exists in cultures. We identified five distinct morphological subtypes that were defined using both qualitative criteria and quantitative shape analysis. The proportion of each subtype present within the culture changed as passage number increased, but pericytes did not change morphological subtype over short time periods. The rate and extent of cellular and membrane motility differed across the subtypes. Immunocytochemistry revealed differential expression of alpha-smooth muscle actin (αSMA) across subtypes. αSMA is essential for cell contractility, and consequently, only subtypes with high αSMA expression contracted in response to physiological vasoconstrictors endothelin-1 (ET1) and noradrenaline (NA). We conclude that there are distinct morphological subtypes in HBVP culture, which display different behaviours. This has significance for the use of HBVP when modelling pericyte physiology in vitro where relevance to in vivo pericyte subtypes along the vascular tree must be considered.
Keywords: Alpha-smooth muscle actin; Cell culture; Contractility; Morphology; Pericytes.
© 2023. The Author(s).
Conflict of interest statement
The authors declare no competing interests.
Figures

Similar articles
-
F-actin polymerization contributes to pericyte contractility in retinal capillaries.Exp Neurol. 2020 Oct;332:113392. doi: 10.1016/j.expneurol.2020.113392. Epub 2020 Jun 29. Exp Neurol. 2020. PMID: 32610106
-
Modelling physiological and pathological conditions to study pericyte biology in brain function and dysfunction.BMC Neurosci. 2018 Feb 22;19(1):6. doi: 10.1186/s12868-018-0405-4. BMC Neurosci. 2018. PMID: 29471788 Free PMC article.
-
Markers for human brain pericytes and smooth muscle cells.J Chem Neuroanat. 2018 Oct;92:48-60. doi: 10.1016/j.jchemneu.2018.06.001. Epub 2018 Jun 7. J Chem Neuroanat. 2018. PMID: 29885791
-
Pericyte morphology and function.Histol Histopathol. 2021 Jun;36(6):633-643. doi: 10.14670/HH-18-314. Epub 2021 Feb 17. Histol Histopathol. 2021. PMID: 33595091 Review.
-
Pericytes and Neurovascular Function in the Healthy and Diseased Brain.Front Cell Neurosci. 2019 Jun 28;13:282. doi: 10.3389/fncel.2019.00282. eCollection 2019. Front Cell Neurosci. 2019. PMID: 31316352 Free PMC article. Review.
Cited by
-
GDNF and cAMP significantly enhance in vitro blood-brain barrier integrity in a humanized tricellular transwell model.Heliyon. 2024 Oct 12;10(20):e39343. doi: 10.1016/j.heliyon.2024.e39343. eCollection 2024 Oct 30. Heliyon. 2024. PMID: 39492921 Free PMC article.
-
Electrospun Polycaprolactone (PCL) Nanofibers Induce Elongation and Alignment of Co-Cultured Primary Cortical Astrocytes and Neurons.Micromachines (Basel). 2025 Feb 25;16(3):256. doi: 10.3390/mi16030256. Micromachines (Basel). 2025. PMID: 40141867 Free PMC article.
-
Isolation methods and characterization of primary rat neurovascular cells.J Biol Eng. 2024 Jul 11;18(1):39. doi: 10.1186/s13036-024-00434-3. J Biol Eng. 2024. PMID: 38992711 Free PMC article.
-
Experimental laboratory models as tools for understanding modifiable dementia risk.Alzheimers Dement. 2024 Jun;20(6):4260-4289. doi: 10.1002/alz.13834. Epub 2024 Apr 30. Alzheimers Dement. 2024. PMID: 38687209 Free PMC article. Review.
-
Rapamycin Treatment Reduces Brain Pericyte Constriction in Ischemic Stroke.Transl Stroke Res. 2025 Aug;16(4):1185-1197. doi: 10.1007/s12975-024-01298-x. Epub 2024 Sep 27. Transl Stroke Res. 2025. PMID: 39331260 Free PMC article.
References
Publication types
MeSH terms
Grants and funding
LinkOut - more resources
Full Text Sources
