

East‒West genetic differentiation across the Indo-Burma hotspot: evidence from two closely related dioecious figs
- PMID: 37322436
- PMCID: PMC10273766
- DOI: 10.1186/s12870-023-04324-6
East‒West genetic differentiation across the Indo-Burma hotspot: evidence from two closely related dioecious figs
Abstract
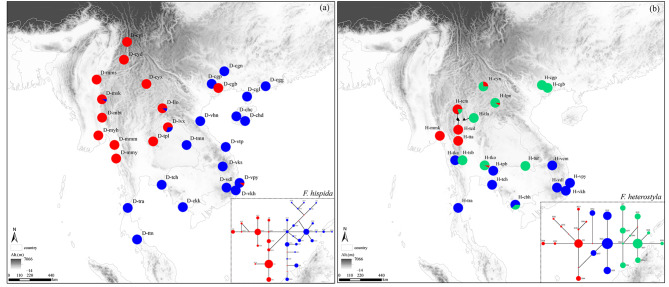
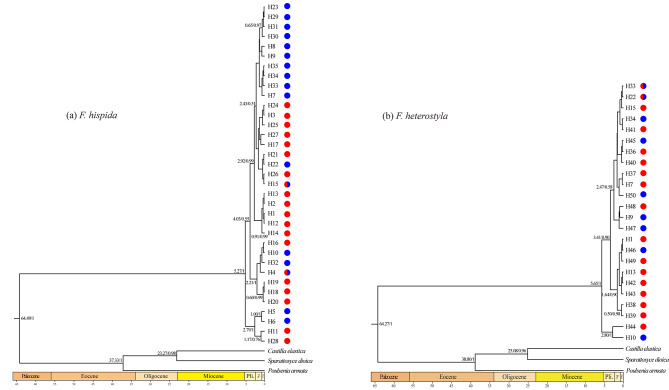
Background: Understanding biodiversity patterns and their underlying mechanisms is of interest to ecologists, biogeographers and conservationists and is critically important for conservation efforts. The Indo-Burma hotspot features high species diversity and endemism, yet it also faces significant threats and biodiversity losses; however, few studies have explored the genetic structure and underlying mechanisms of Indo-Burmese species. Here, we conducted a comparative phylogeographic analysis of two closely related dioecious Ficus species, F. hispida and F. heterostyla, based on wide and intensive population sampling across Indo-Burma ranges, using chloroplast (psbA-trnH, trnS-trnG) and nuclear microsatellite (nSSR) markers, as well as ecological niche modeling.
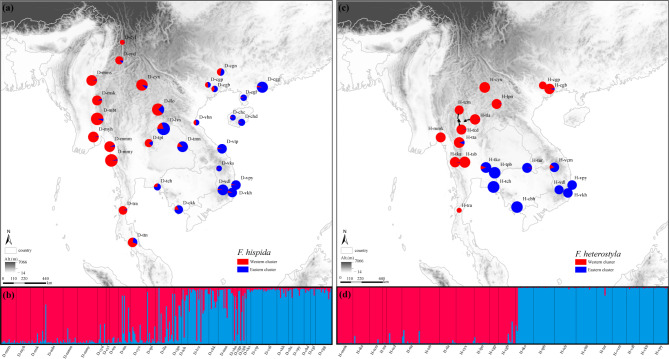
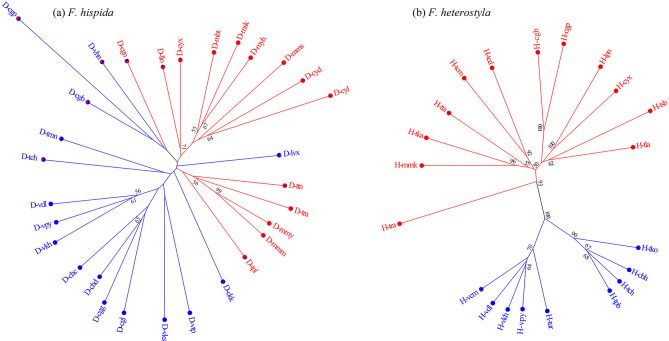
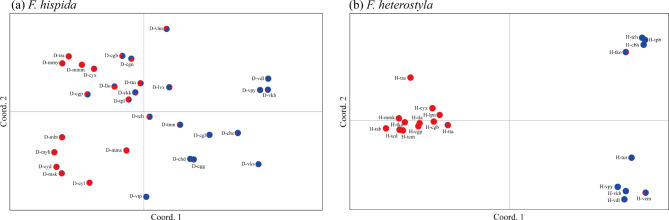
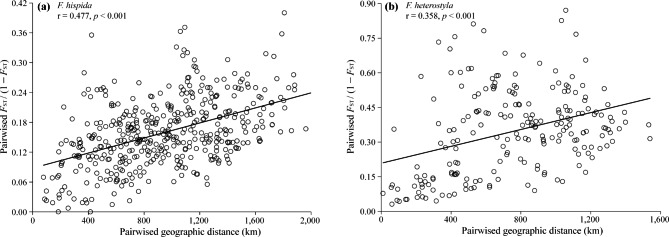
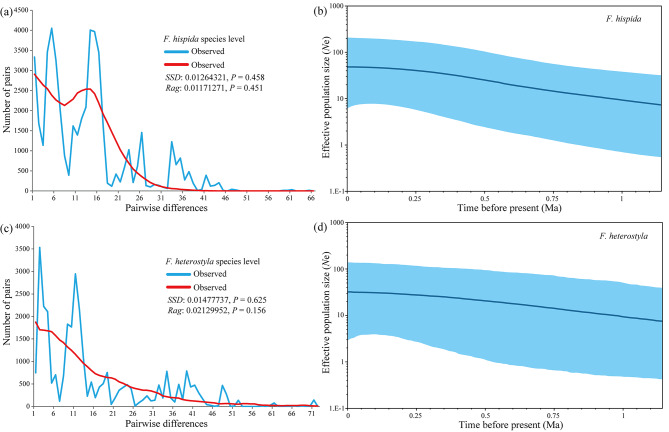
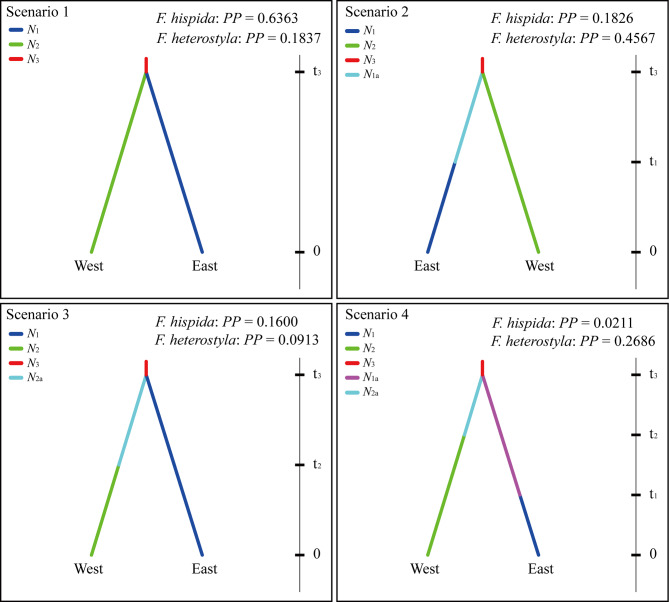
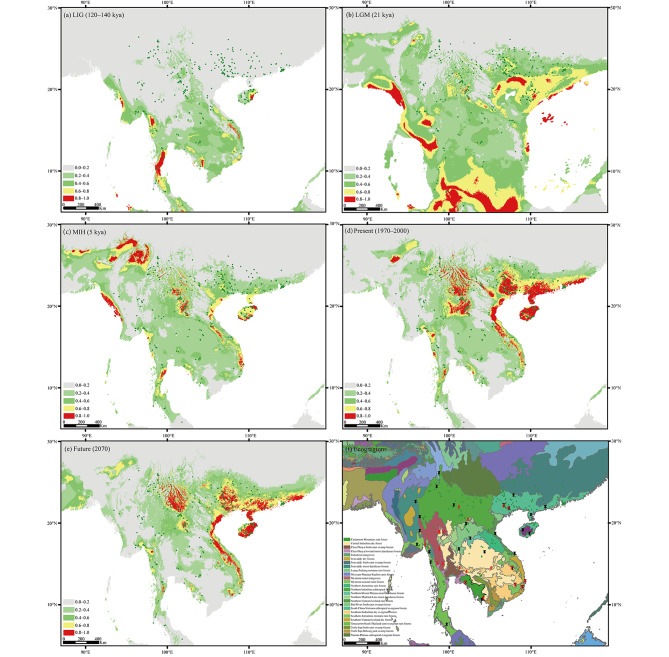
Results: The results indicated large numbers of population-specific cpDNA haplotypes and nSSR alleles in the two species. F. hispida showed slightly higher chloroplast diversity but lower nuclear diversity than F. heterostyla. Low-altitude mountainous areas of northern Indo-Burma were revealed to have high genetic diversity and high habitat suitability, suggesting potential climate refugia and conservation priority areas. Strong phylogeographic structure and a marked east‒west differentiation pattern were observed in both species, due to the interactions between biotic and abiotic factors. Interspecific dissimilarities at fine-scale genetic structure and asynchronized historical dynamics of east‒west differentiation between species were also detected, which were attributed to different species-specific traits.
Conclusions: We confirm hypothesized predictions that interactions between biotic and abiotic factors largely determine the patterns of genetic diversity and phylogeographic structure of Indo-Burmese plants. The east‒west genetic differentiation pattern observed in two targeted figs can be generalized to some other Indo-Burmese plants. The results and findings of this work will contribute to the conservation of Indo-Burmese biodiversity and facilitate targeted conservation efforts for different species.
Keywords: East‒West differentiation; Ficus; Indo-Burma; Phylogeography; Pollinating wasp.
© 2023. The Author(s).
Conflict of interest statement
The authors declare no competing interests.
Figures
Similar articles
-
Development of 19 universal microsatellite loci for three closely related Ficus species (Moraceae) by high-throughput sequencing.Genes Genet Syst. 2020 Apr 22;95(1):21-27. doi: 10.1266/ggs.19-00044. Epub 2020 Mar 12. Genes Genet Syst. 2020. PMID: 32161229
-
The uses of fig (Ficus) by five ethnic minority communities in Southern Shan State, Myanmar.J Ethnobiol Ethnomed. 2020 Sep 17;16(1):55. doi: 10.1186/s13002-020-00406-z. J Ethnobiol Ethnomed. 2020. PMID: 32943080 Free PMC article.
-
Comparative phylogeography reveals a shared impact of pleistocene environmental change in shaping genetic diversity within nine Anopheles mosquito species across the Indo-Burma biodiversity hotspot.Mol Ecol. 2011 Nov;20(21):4533-49. doi: 10.1111/j.1365-294X.2011.05268.x. Epub 2011 Oct 10. Mol Ecol. 2011. PMID: 21981746
-
The biogeography of tropical reef fishes: endemism and provinciality through time.Biol Rev Camb Philos Soc. 2017 Nov;92(4):2112-2130. doi: 10.1111/brv.12323. Epub 2017 Feb 23. Biol Rev Camb Philos Soc. 2017. PMID: 28231621 Review.
-
Unravelling biodiversity, evolution and threats to conservation in the Sahara-Sahel.Biol Rev Camb Philos Soc. 2014 Feb;89(1):215-31. doi: 10.1111/brv.12049. Epub 2013 Jul 13. Biol Rev Camb Philos Soc. 2014. PMID: 23848599 Review.
Cited by
-
The genetic structuring in pollinating wasps of Ficus hispida in continental Asia.Ecol Evol. 2023 Sep 20;13(9):e10518. doi: 10.1002/ece3.10518. eCollection 2023 Sep. Ecol Evol. 2023. PMID: 37745788 Free PMC article.
-
Integrative methods reveal multiple drivers of diversification in rice paddy snakes.Sci Rep. 2024 Mar 12;14(1):4727. doi: 10.1038/s41598-024-54744-z. Sci Rep. 2024. PMID: 38472264 Free PMC article.
References
-
- Lomolino M. Elevation gradients of species-density: historical and prospective views. Global Ecol Biogeogr. 2001;10:3–13. doi: 10.1046/j.1466-822x.2001.00229.x. - DOI
-
- Ricklefs RE. A comprehensive framework for global patterns in biodiversity. Ecol Lett. 2003;7:1–15. doi: 10.1046/j.1461-0248.2003.00554.x. - DOI
-
- Avise JC. Phylogeography: The history and formation of species. 2000. Cambridge: Harvard University Press; 2000.
MeSH terms
Grants and funding
LinkOut - more resources
Full Text Sources
Research Materials
