

Spatio-temporal pattern, matching level and prediction of ageing and medical resources in China
- PMID: 37322467
- PMCID: PMC10268402
- DOI: 10.1186/s12889-023-15945-9
Spatio-temporal pattern, matching level and prediction of ageing and medical resources in China
Abstract
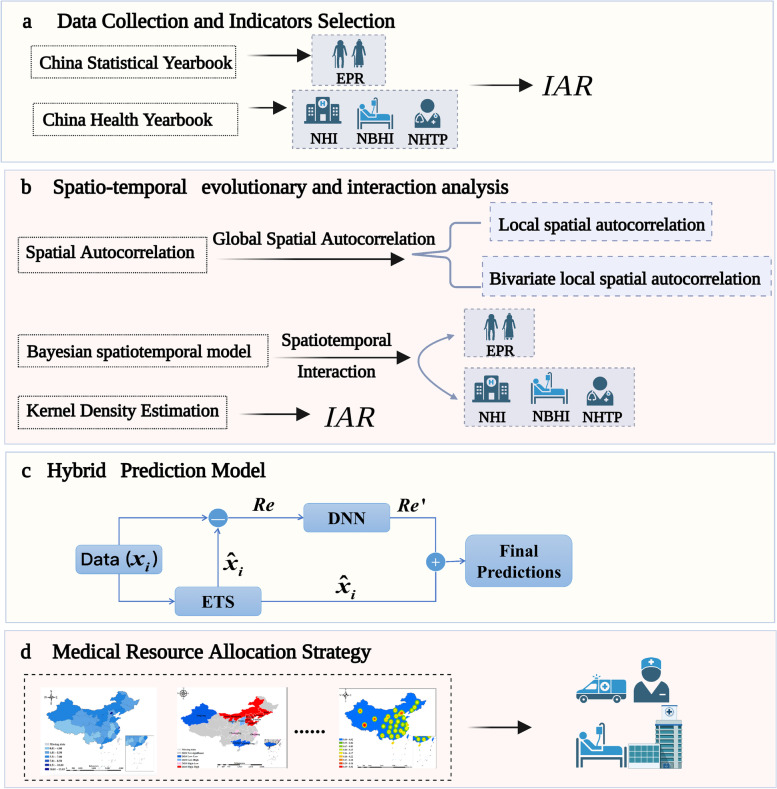
Objective: Population ageing, as a hot issue in global development, increases the burden of medical resources in society. This study aims to assess the current spatiotemporal evolution and interaction between population ageing and medical resources in mainland China; evaluate the matching level of medical resources to population ageing; and forecast future trends of ageing, medical resources, and the indicator of ageing-resources (IAR).
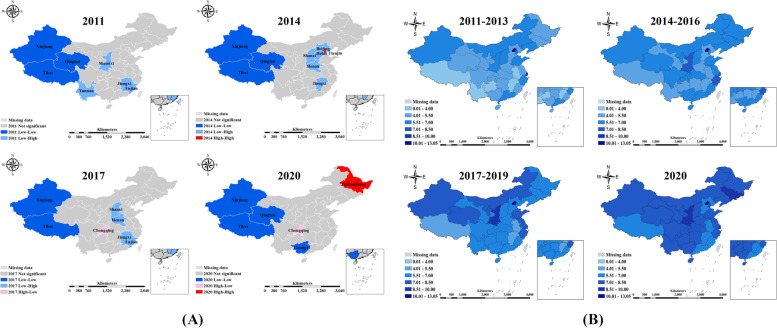
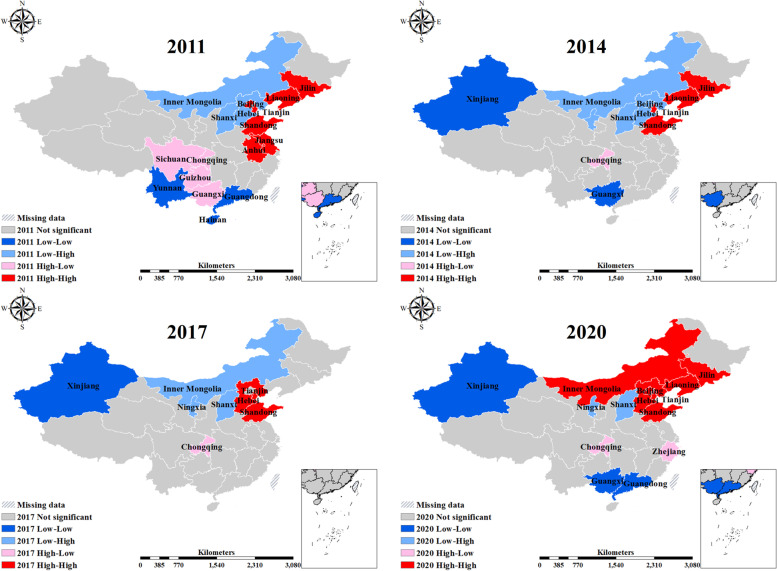
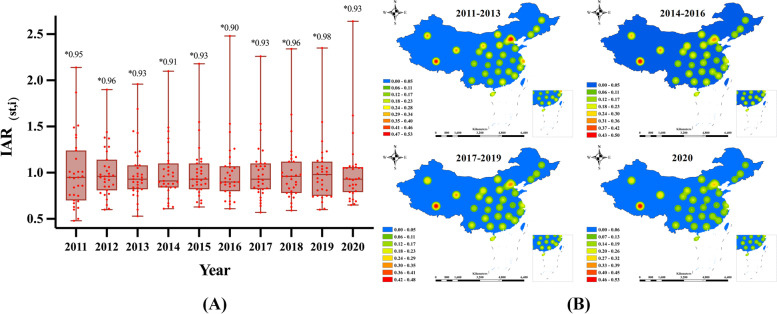
Methods: Data on ageing (EPR) and medical resources (NHI, NBHI, and NHTP) were obtained from China Health Statistics Yearbook and China Statistical Yearbook (2011-2020). We employed spatial autocorrelation to examine the spatial-temporal distribution trends and analyzed the spatio-temporal interaction using a Bayesian spatio-temporal effect model. The IAR, an improved evaluation indicator, was used to measure the matching level of medical resources to population ageing with kernel density analysis for visualization. Finally, an ETS-DNN model was used to forecast the trends in population ageing, medical resources, and their matching level over the next decade.
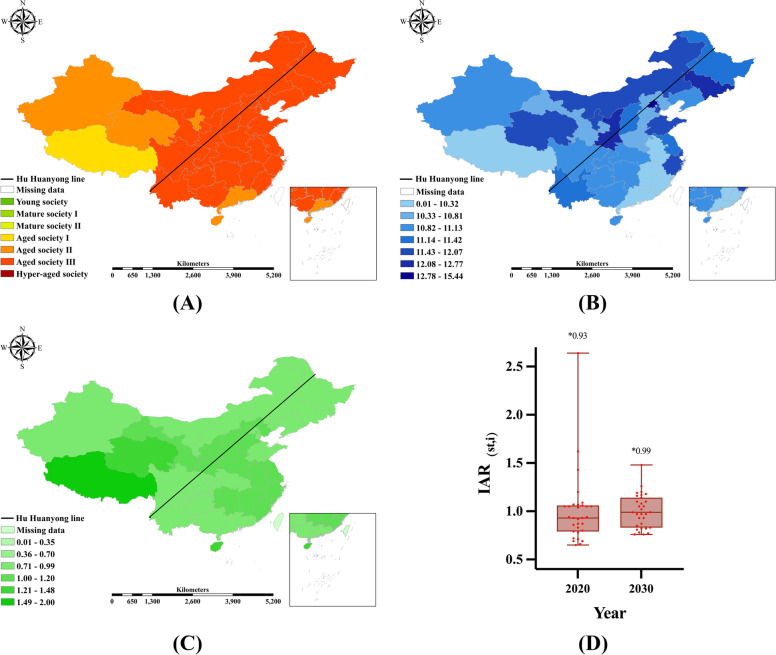
Results: The study found that China's ageing population and medical resources are growing annually, yet distribution is uneven across districts. There is a spatio-temporal interaction effect between ageing and medical resources, with higher levels of both in Eastern China and lower levels in Western China. The IAR is relatively high in Northwest, North China, and the Yangtze River Delta, but showed a declining trend in North China and the Yangtze River Delta. The hybrid model (ETS-DNN) gained an R2 of 0.9719, and the predicted median IAR for 2030 (0.99) across 31 regions was higher than the median IAR for 2020 (0.93).
Conclusion: This study analyzes the relationship between population ageing and medical resources, revealing a spatio-temporal interaction between them. The IAR evaluation indicator highlights the need to address ageing population challenges and cultivate a competent health workforce. The ETS-DNN forecasts indicate higher concentrations of both medical resources and ageing populations in eastern China, emphasizing the need for region-specific ageing security systems and health service industries. The findings provide valuable policy insights for addressing a hyper-aged society in the future.
Keywords: Interaction effect; Medical resources; Population ageing; Regression prediction; Spatio-temporal distribution trends.
© 2023. The Author(s).
Conflict of interest statement
The authors declare no competing interests. The authors alone are responsible for the views expressed in this article and they do not necessarily represent the views of the organizations listed.
Figures
References
-
- Shen X, Zhou S, Zhang X. China’s population aging and regional variation. In: Services for Aging Persons in China. Cham: Springer International Publishing; 2022. p. 19–35.
Publication types
MeSH terms
LinkOut - more resources
Full Text Sources
Medical
