

Combination effects of amino acid transporter LAT1 inhibitor nanvuranlat and cytotoxic anticancer drug gemcitabine on pancreatic and biliary tract cancer cells
- PMID: 37322479
- PMCID: PMC10268460
- DOI: 10.1186/s12935-023-02957-z
Combination effects of amino acid transporter LAT1 inhibitor nanvuranlat and cytotoxic anticancer drug gemcitabine on pancreatic and biliary tract cancer cells
Abstract
Background: Cytotoxic anticancer drugs widely used in cancer chemotherapy have some limitations, such as the development of side effects and drug resistance. Furthermore, monotherapy is often less effective against heterogeneous cancer tissues. Combination therapies of cytotoxic anticancer drugs with molecularly targeted drugs have been pursued to solve such fundamental problems. Nanvuranlat (JPH203 or KYT-0353), an inhibitor for L-type amino acid transporter 1 (LAT1; SLC7A5), has novel mechanisms of action to suppress the cancer cell proliferation and tumor growth by inhibiting the transport of large neutral amino acids into cancer cells. This study investigated the potential of the combined use of nanvuranlat and cytotoxic anticancer drugs.
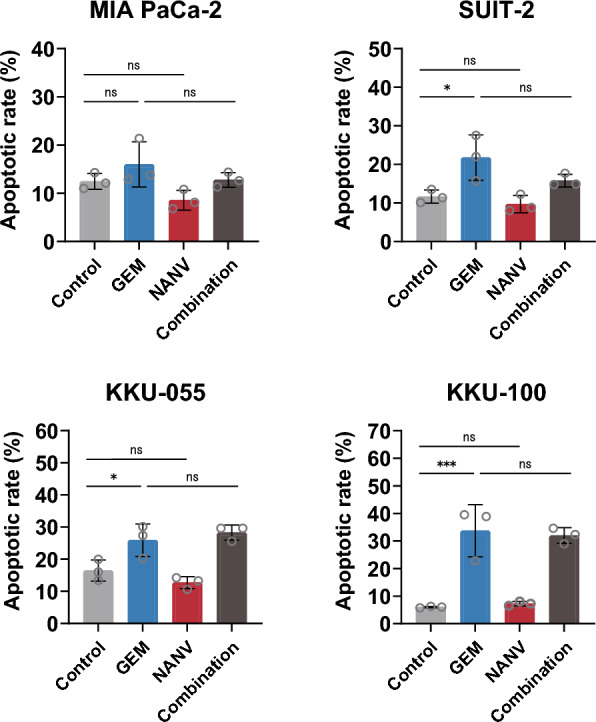
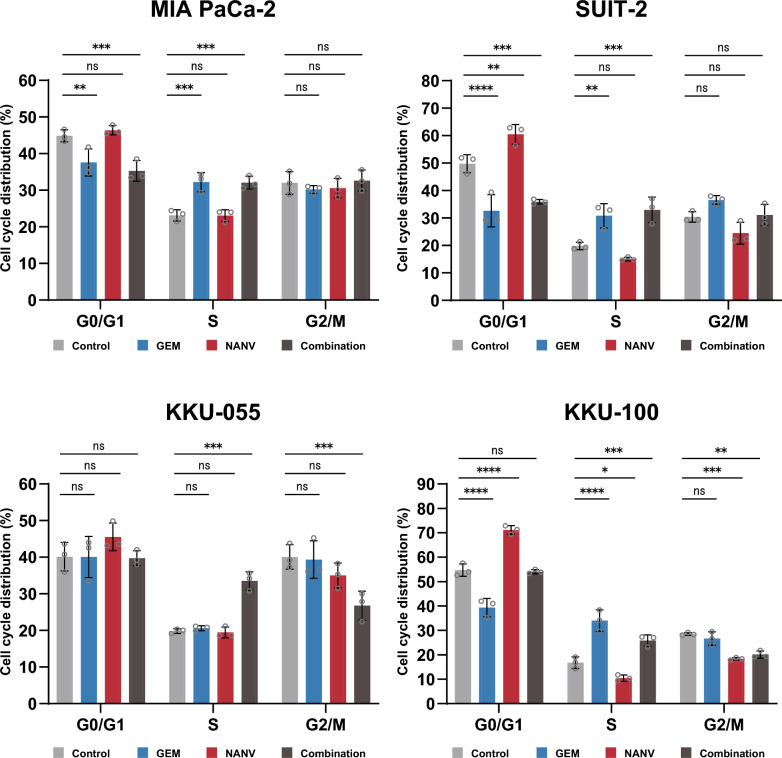
Methods: The combination effects of cytotoxic anticancer drugs and nanvuranlat on cell growth were examined by a water-soluble tetrazolium salt assay in two-dimensional cultures of pancreatic and biliary tract cancer cell lines. To elucidate the pharmacological mechanisms underlying the combination of gemcitabine and nanvuranlat, we investigated apoptotic cell death and cell cycle by flow cytometry. The phosphorylation levels of amino acid-related signaling pathways were analyzed by Western blot. Furthermore, growth inhibition was examined in cancer cell spheroids.
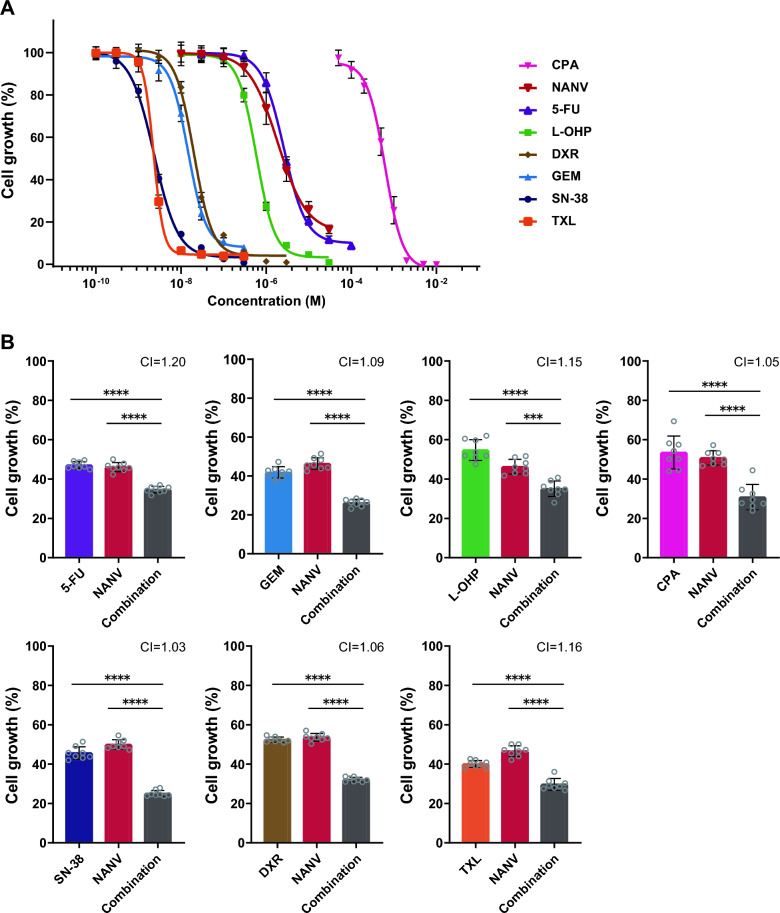
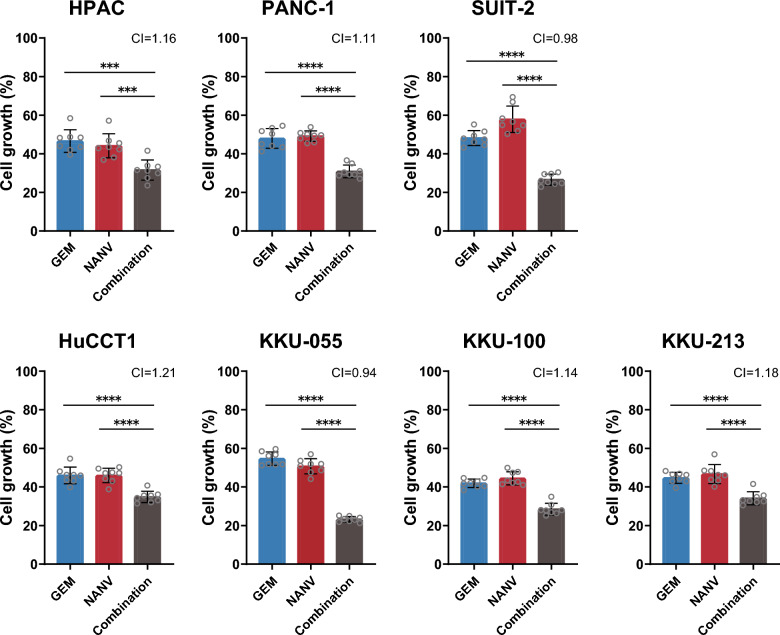
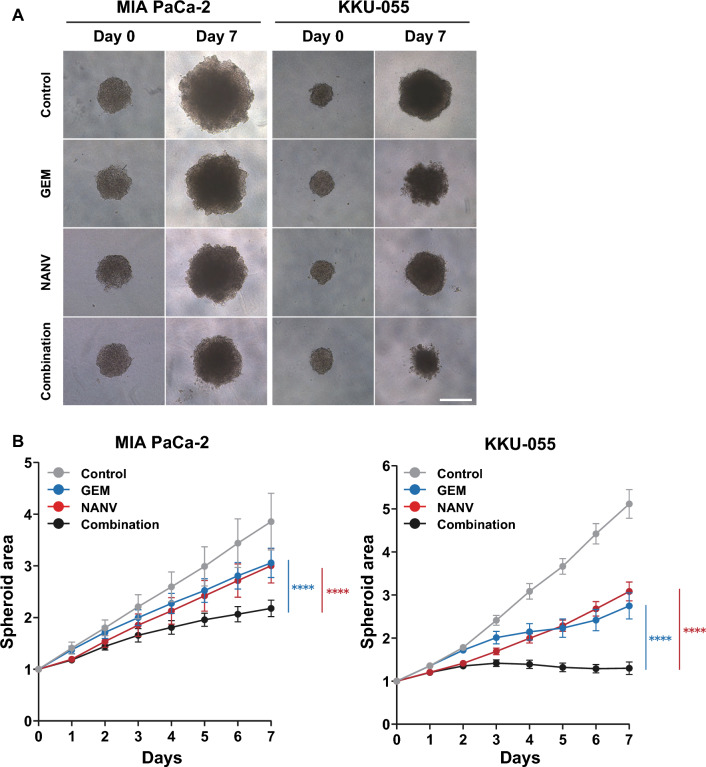
Results: All the tested seven types of cytotoxic anticancer drugs combined with nanvuranlat significantly inhibited the cell growth of pancreatic cancer MIA PaCa-2 cells compared to their single treatment. Among them, the combined effects of gemcitabine and nanvuranlat were relatively high and confirmed in multiple pancreatic and biliary tract cell lines in two-dimensional cultures. The growth inhibitory effects were suggested to be additive but not synergistic under the tested conditions. Gemcitabine generally induced cell cycle arrest at the S phase and apoptotic cell death, while nanvuranlat induced cell cycle arrest at the G0/G1 phase and affected amino acid-related mTORC1 and GAAC signaling pathways. In combination, each anticancer drug basically exerted its own pharmacological activities, although gemcitabine more strongly influenced the cell cycle than nanvuranlat. The combination effects of growth inhibition were also verified in cancer cell spheroids.
Conclusions: Our study demonstrates the potential of first-in-class LAT1 inhibitor nanvuranlat as a concomitant drug with cytotoxic anticancer drugs, especially gemcitabine, on pancreatic and biliary tract cancers.
Keywords: Amino acid transporter; Cancer chemotherapy; Combination therapy; Cytotoxic anticancer drugs; Essential amino acids; Gemcitabine; LAT1; Large neutral amino acids; Molecularly targeted drugs; SLC7A5.
© 2023. The Author(s).
Conflict of interest statement
Y.K. received a collaborative research grant from J-Pharma Co., Ltd. H.E. founded J-Pharma Co., Ltd. and has led the development of nanvuranlat. Other authors declare no competing interests.
Figures

Similar articles
-
Pharmacological and structural insights into nanvuranlat, a selective LAT1 (SLC7A5) inhibitor, and its N-acetyl metabolite with implications for cancer therapy.Sci Rep. 2025 Jan 23;15(1):2903. doi: 10.1038/s41598-025-87522-6. Sci Rep. 2025. PMID: 39849059 Free PMC article.
-
Inhibition of amino acid transporter LAT1 in cancer cells suppresses G0/G1-S transition by downregulating cyclin D1 via p38 MAPK activation.J Pharmacol Sci. 2024 Mar;154(3):182-191. doi: 10.1016/j.jphs.2024.01.007. Epub 2024 Jan 30. J Pharmacol Sci. 2024. PMID: 38395519
-
Phosphoproteomics revealed cellular signals immediately responding to disruption of cancer amino acid homeostasis induced by inhibition of L-type amino acid transporter 1.Cancer Metab. 2022 Nov 10;10(1):18. doi: 10.1186/s40170-022-00295-8. Cancer Metab. 2022. PMID: 36357940 Free PMC article.
-
Amino acid transporter LAT1 (SLC7A5) as a molecular target for cancer diagnosis and therapeutics.Pharmacol Ther. 2022 Feb;230:107964. doi: 10.1016/j.pharmthera.2021.107964. Epub 2021 Aug 12. Pharmacol Ther. 2022. PMID: 34390745 Review.
-
Contribution of LAT1-4F2hc in Urological Cancers via Toll-like Receptor and Other Vital Pathways.Cancers (Basel). 2022 Jan 4;14(1):229. doi: 10.3390/cancers14010229. Cancers (Basel). 2022. PMID: 35008399 Free PMC article. Review.
Cited by
-
Leucine drives LAT1-related SNAIL upregulation in glucose-starved pancreatic cancer cells.Med Mol Morphol. 2025 Mar;58(1):23-33. doi: 10.1007/s00795-024-00404-0. Epub 2024 Sep 6. Med Mol Morphol. 2025. PMID: 39240293
-
Methionine metabolite spermidine inhibits tumor pyroptosis by enhancing MYO6-mediated endocytosis.Nat Commun. 2025 Mar 4;16(1):2184. doi: 10.1038/s41467-025-57511-4. Nat Commun. 2025. PMID: 40038267 Free PMC article.
-
Pharmacological and structural insights into nanvuranlat, a selective LAT1 (SLC7A5) inhibitor, and its N-acetyl metabolite with implications for cancer therapy.Sci Rep. 2025 Jan 23;15(1):2903. doi: 10.1038/s41598-025-87522-6. Sci Rep. 2025. PMID: 39849059 Free PMC article.
-
Impact of genetic variants in the solute carrier (SLC) genes encoding drug uptake transporters on the response to anticancer chemotherapy.Cancer Drug Resist. 2024 Jul 18;7:27. doi: 10.20517/cdr.2024.42. eCollection 2024. Cancer Drug Resist. 2024. PMID: 39143954 Free PMC article. Review.
-
Non-Canonical, Strongly Selective Protein Disulfide Isomerases as Anticancer Therapeutic Targets.Biomolecules. 2025 Aug 8;15(8):1146. doi: 10.3390/biom15081146. Biomolecules. 2025. PMID: 40867591 Free PMC article. Review.
References
Grants and funding
LinkOut - more resources
Full Text Sources
Research Materials
