. 2023 Jun 15;15(1):28.
doi: 10.1186/s13099-023-00557-w.

The beneficial effects of commensal E. coli for colon epithelial cell recovery are related with Formyl peptide receptor 2 (Fpr2) in epithelial cells

Affiliations

The beneficial effects of commensal E. coli for colon epithelial cell recovery are related with Formyl peptide receptor 2 (Fpr2) in epithelial cells

Keqiang Chen et al. Gut Pathog. .

Erratum in

Abstract

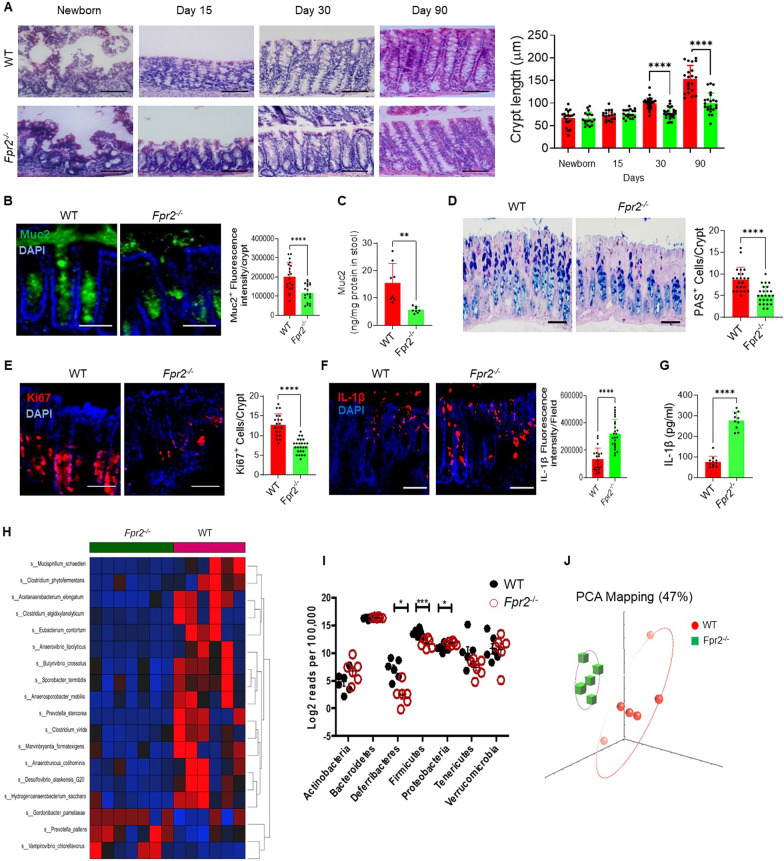
Background: Formyl peptide receptor 2 (Fpr2) plays a crucial role in colon homeostasis and microbiota balance. Commensal E. coli is known to promote the regeneration of damaged colon epithelial cells. The aim of the study was to investigate the connection between E. coli and Fpr2 in the recovery of colon epithelial cells.

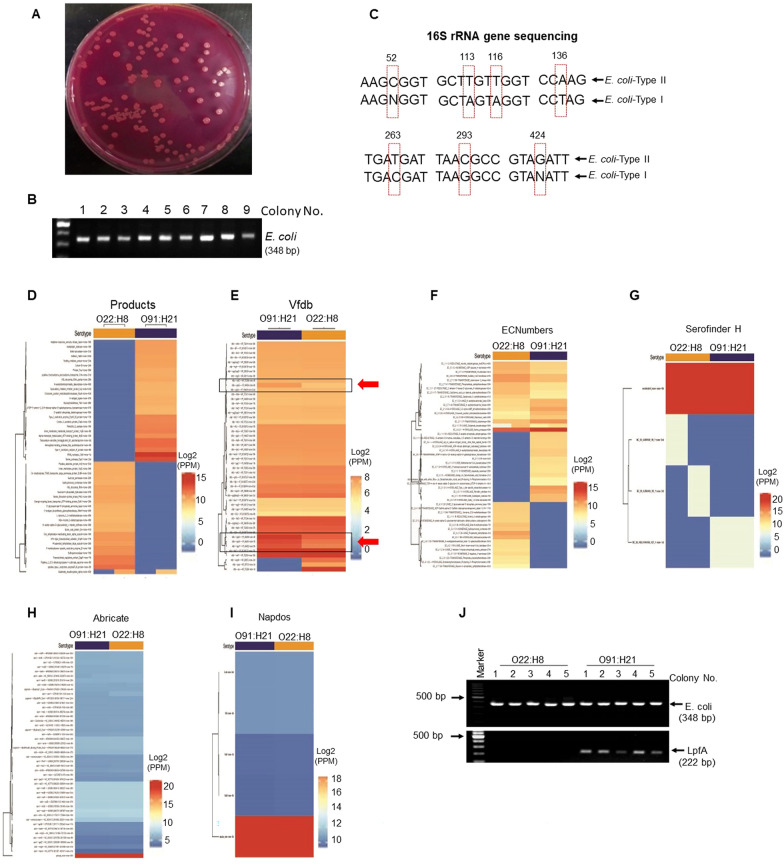
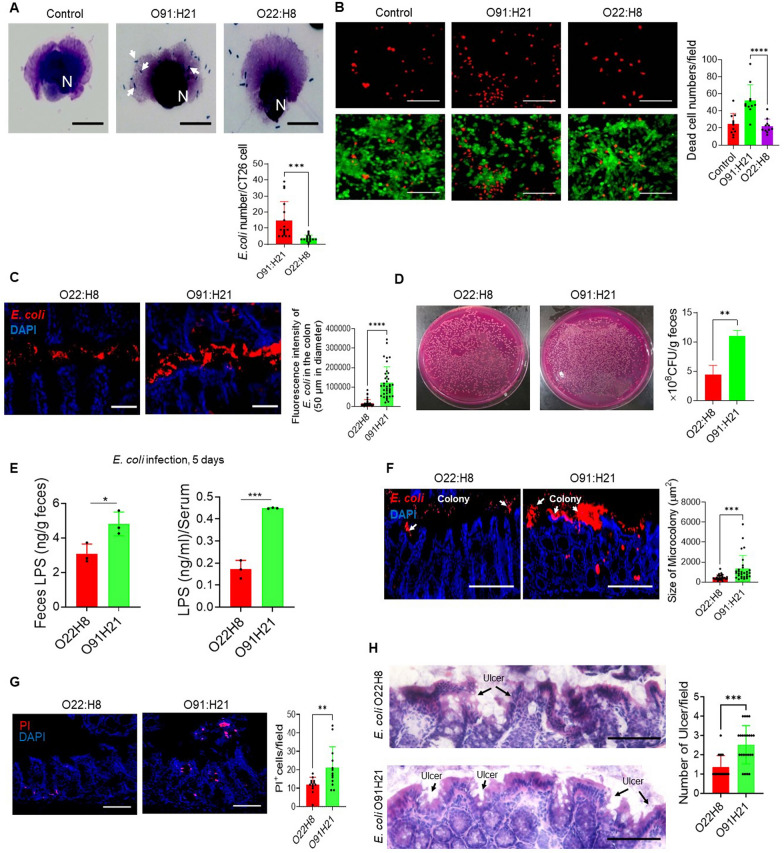
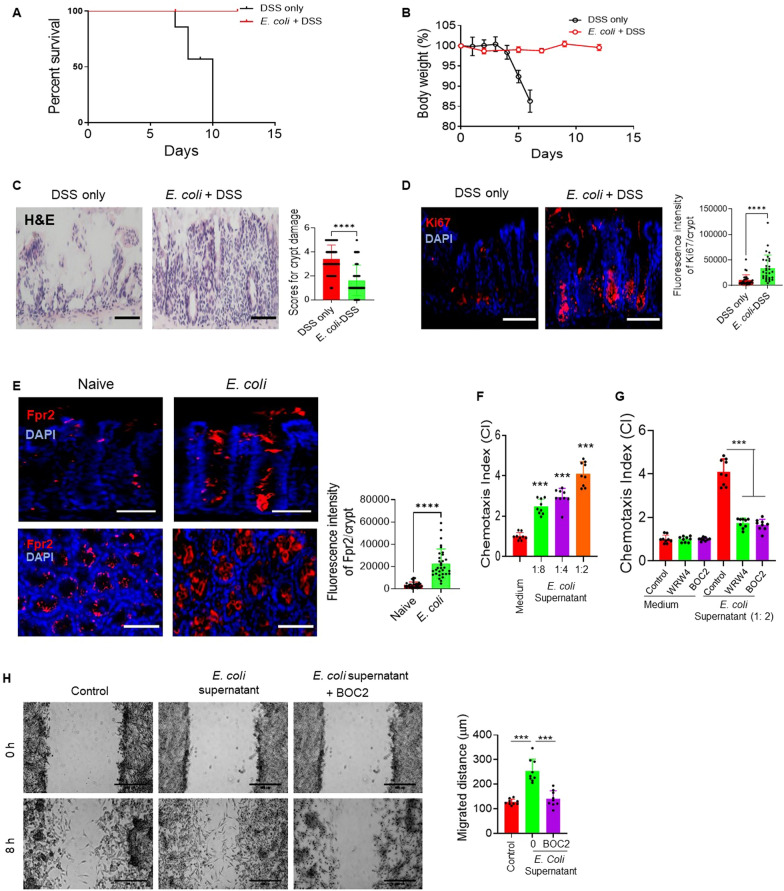
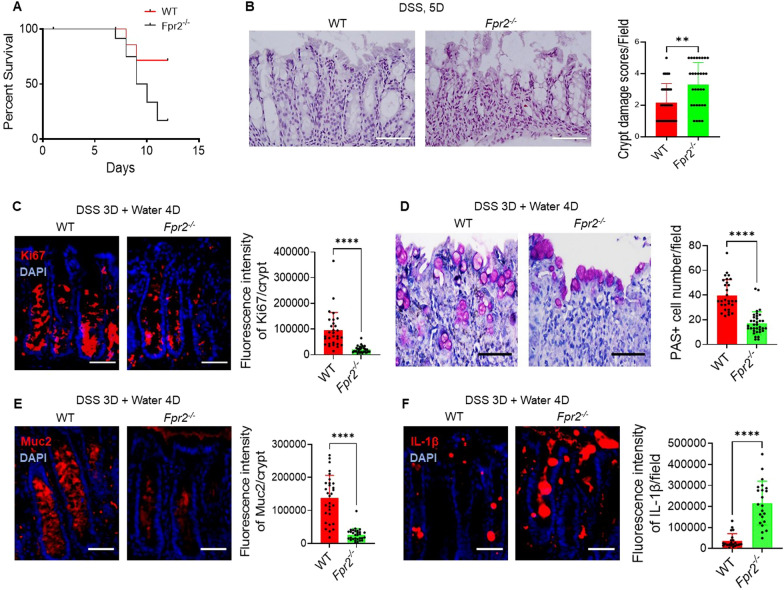
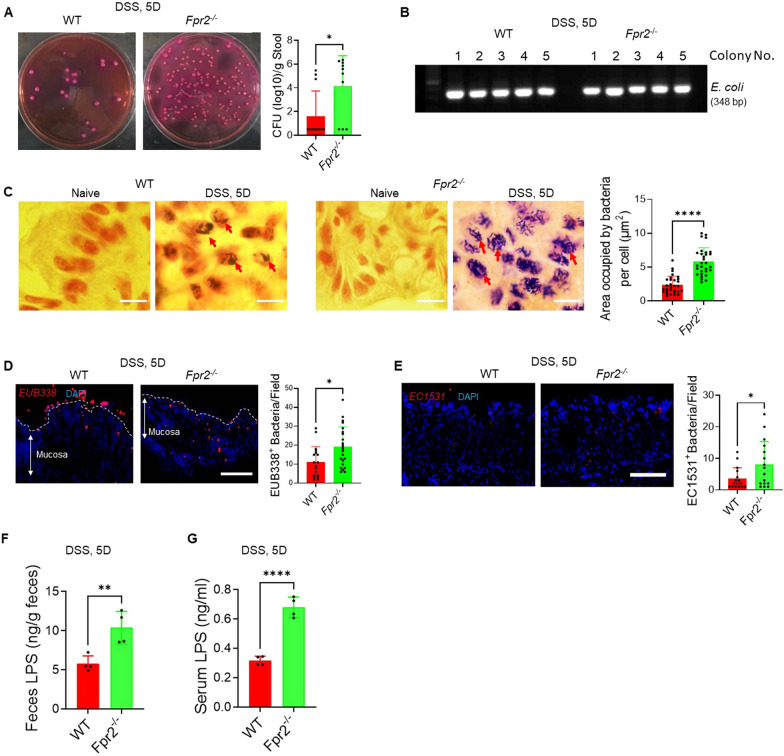
Results: The deficiency of Fpr2 was associated with impaired integrity of the colon mucosa and an imbalance of microbiota, characterized by the enrichment of Proteobacteria in the colon. Two serotypes of E. coli, O22:H8 and O91:H21, were identified in the mouse colon through complete genome sequencing. E. coli O22:H8 was found to be prevalent in the gut of mice and exhibited lower virulence compared to O91:H21. Germ-free (GF) mice that were pre-orally inoculated with E. coli O22:H8 showed reduced susceptibility to chemically induced colitis, increased proliferation of epithelial cells, and improved mouse survival. Following infection with E. coli O22:H8, the expression of Fpr2 in colon epithelial cells was upregulated, and the products derived from E. coli O22:H8 induced migration and proliferation of colon epithelial cells through Fpr2. Fpr2 deficiency increased susceptibility to chemically induced colitis, delayed the repair of damaged colon epithelial cells, and heightened inflammatory responses. Additionally, the population of E. coli was observed to increase in the colons of Fpr2-/- mice with colitis.

Conclusion: Commensal E. coli O22:H8 stimulated the upregulation of Fpr2 expression in colon epithelial cells, and the products from E. coli induced migration and proliferation of colon epithelial cells through Fpr2. Fpr2 deficiency led to an increased E. coli population in the colon and delayed recovery of damaged colon epithelial cells in mice with colitis. Therefore, Fpr2 is essential for the effects of commensal E. coli on colon epithelial cell recovery.

Keywords: Colitis; Commensal E. coli; Fpr2 −/− mice; Germ-free mice; Regeneration.


Conflict of interest statement

The authors declare that they have no competing interests.

Figures

Fig. 1
Fig. 1
Impaired colon mucosal barrier in Fpr2−/− mice. A Shortened colon crypts in Fpr2−/− mice at different ages. H&E staining. Scale bar = 100 μm. Right: Quantitation of crypt length of colons at different mouse ages. n = 4–8 mice/group. ****P < 0.0001. B Reduced Muc2 production in colon crypts of Fpr2−/− mice. Green: Muc2, Blue: Nuclei. Scale bar = 50 μm. Right: Quantitation of Muc2+ fluorescence intensity/crypt, n = 18–20 crypts from 6 mice/group, ****P < 0.0001. C Reduced level of Muc2 in the feces of Fpr2−/− mice. The Muc2 concentration in the feces was expressed as ng/1 mg protein in feces. n = 8 mice/group, **P < 0.01. D Reduced number of goblet cells in the colon of Fpr2−/− mice. An alcian blue stain. Scale bar = 50 μm. Right panel Quantitation of PAS+ goblet cells per crypt, n = 23–25 crypts from 4 mice/group. ****P < 0.0001. E Reduced number of Ki67+ cells in the colon of Fpr2−/− mice. Red: Ki67+ cells, Blue: Nuclei. Scale bar = 50 μm. Right: Quantitation of Ki67+ cells per crypt, n = 20–25 crypts from 4 mice/group. ****P < 0.0001. F Increased production of IL-1β in the colon mucosa of Fpr2−/− mice. Red: IL-1β, Blue: Neuclei. Scale bar = 50 μm. Right: Quantitative IL-1β + fluorescence intensity, n = 19–24 crypts from 4 mice/group. ****P < 0.0001. G Increased production of IL-1β in the colon mucosa of Fpr2−/− mice measured by ELISA. n = 10–11 mice/group, ****P < 0.0001. H-J WT (Fpr2+/+) and Fpr2−/− mice were co-housed for 4 weeks after weaning, followed by separation for an additional 6 weeks. Fecal pellets were collected to analyze microbiota by 16S rRNA sequencing. H Heat map showing 18 bacterial strains at the phylum levels in the feces. I Quantitation of microbiota in the feces of WT and Fpr2−/− mice, showing significantly reduced Firmicutes and Deferribacteres but increased Proteobacteria in Fpr2−/− mouse microbiota. *P < 0.05, ***P < 0.001. J The principal coordinate analysis (PCA) indicating that the abundance of bacteria in the gut of Fpr2−/− mice is different from WT mice.
Fig. 2
Fig. 2
Identification of E. coli serotypes O22:H8 and O91:H21 in mouse feces. A E. coli in mouse feces was isolated by Violet Red Bile Lactose agar (VRVL). B PCR analysis confirmed that the bacteria isolated from the mouse feces were E. coli. C 16S rRNA sequencing for E. coli. E. coli-Type II showed differences in nucleotide positions 52, 113, 116, 136, 263, 293, and 424 of the 16S rRNA sequence from E. coli-Type I. D–I Whole genome sequencing of E. coli showing relative abundance heatmaps of genes in the serotypes O22:H8 and O91:H21. D products. E virulence factors. F ECNumber: Enzyme Commission number, the Enzyme nomenclature database. G Serofinder H: A FASTA database of specific O-antigen processing system genes for O typing and flagellin genes for H typing publicly available Web tools hosted by the Center for Genomic Epidemiology (CGE). H Abricate: a database for mass screening of contigs for antimicrobial resistance or virulence genes bundled with multiple databases: NCBI, CARD, ARG-ANNOT, Resfinder, MEGARES, EcOH, PlasmidFinder, E. coli_VF and VFDB. I. Napdos: a bioinformatic tool for the rapid detection and analysis of secondary metabolite genes. This tool is designed to detect and extract C- and KS- domains from DNA or amino acid sequence data, including PCR amplicon products, individual genes, whole genomes, and metagenomic data sets. J. PCR analysis showing higher levels of Long Polar Fimbriae Type I (LpfA) contained in E. coli O91:H21
Fig. 3
Fig. 3
E. coli O91:H21 exhibits greater virulence compared to O22:H8. A Increased adhesion of E. coli O91:H21 to colon epithelial cells. CT26 cells: bacteria = 1: 10. Scale bar = 20 μm. N: Nuclei, White arrows: Bacteria surrounding or attaching CT26 cells. Lower: Quantitative bacterial counts adhering to one CT26 cell. n = 27–29 cells/group. ***P < 0.001. B More cell death induced by E. coli O91:H21 infection. CT26 cells: bacteria = 1:10, Green: live cells; Red: dead cells. Scale bar = 200 µm. Right: Quantitation of dead CT26 cell counts/field. n = 11 fields/group, *P < 0.05. C Increased E. coli O91:H21 in the colon lumen of GF mice. Red: E. coli, Blue: Nuclei. Scale bar = 50 μm. Right: Quantitation of E. coli+ fluorescence intensity in colon lumen (50 µm in diameter) of GF mice infected with E. coli O91:H21 or E. coli O22:H8. n = 37 areas (50 µm in diameter) from 4 mice per group, ****P < 0.0001. D Increased CFU of E. coli O91:H21 in the feces of GF mice. Right: Quantitative CFU (Log10) per g stool from GF mice infected with E. coli O91:H21 as compared to mice infected with E. coli O22:H8, n = 4 mice/group, **P < 0.01. E Increased levels of LPS in the feces and serum of GF mice infected with E. coli O91:H21. n = 3 mice/group, *P < 0.05, ***P < 0.001. F E. coli O91:H21 formed larger colonies on the colon mucosa of GF mice. Red: E. coli colonies; Blue: Nuclei. Scale bar = 100 μm. Right: Quantitative E. coli colonies in the colon of GF mice infected with E. coli O91:H21 or E. coli O22:H8. n = 29 colonies from 3 mice per group, ***P < 0.001. G Increased colon epithelial cell death in E. coli O91:H21 inoculated GF mice. Red: PI + cells in colon mucosa, Blue: Nuclei. Scale bar = 50 μm. Right: Quantitative PI + cells/field. n = 11–13 fields from 3 mice per group. **P < 0.01. H Increased ulcer formation in the colon mucosa of GF mice infected with E. coli O91:H21. Scale bar = 100 µm. Black arrows: Ulcer. Right: Quantitative number of ulcer in the colon mucosa. n = 17–23 fields from 5 mice/group. ***P < 0.001
Fig. 4
Fig. 4
Fpr2 is required for E. coli to promote the colon epithelial cell regeneration. A, B The germ-free (GF) mice pre-orally inoculated with E. coli increased mouse survival (A) and reduced the loss of body weight (B) after challenged with DSS. C. Reduced crypt damage in the colon of GF mice pre-orally inoculated with E. coli. Scale bar = 50 µm. Right: Quantitative scores for crypt damage. n = 99–122 crypts from 4 mice per group, ****P < 0.0001. D Increased number of Ki67 + cells in the colon mucosa of GF mice pre-orally inoculated with E. coli. Red: Ki67 + cells, Blue: Nuclei. Scale bar = 50 µm. Right: Quantitative Ki67 + fluorescence intensity/crypt. n = 30 crypts from 4 mice per group, ****P < 0.0001. E Upregulation of Fpr2 expression by colon epithelial cells with E. coli infection in GF wild type (WT) mice. Upper: Scale bar = 30 µm, lower: Scale bar = 40 µm. Right: Quantitative Fpr2 + fluorescence intensity/crypt. n = 32 crypts from 4 mice/group, ****P < 0.0001. F E. coli supernatant induced CT26 cell migration. n = 3 mice/group, ***P < 0.001. G E. coli supernatant induced CT26 cell migration can be inhibited by the Fpr2 antagonist WRW4 (5 µg/ml) and Fpr1/Fpr2 antagonist BOC2 (5 µg/ml). n = 3 per group, ***P < 0.001. The results of F and G are expressed as the mean ± S.D. of the chemotaxis index (CI). H E. coli supernatant-enhanced closure of CT26 cell monolayer wound was attenuated by Fpr1/Fpr2 antagonist BOC2 (5 µg/ml). Scale bar = 40 µm. Right: Quantitative CT26 cells migration distance (µm) induced by E. coli supernatant. BOC2 (5 µg/ml). n = 8 fields/group, ***P < 0.001
Fig. 5
Fig. 5
Fpr2 deficiency delayed the recovery of the damaged colon mucosa in mice with colitis. A Reduced survival of Fpr2−/− mice after administration of 3% DSS in drinking water for 5 days followed by an additional 7 days of normal water intake. n = 12 mice/group. B Increased damage for colon mucosa in Fpr2−/− mice treated with DSS for 5 days. Scale bar = 50 µm. Right: Quantitation of crypt damage in Fpr2−/− mice after DSS treatment. n = 6 mice per group. **P < 0.01. C Reduced number of Ki67+ cells in the colon mucosa of Fpr2−/− mice after administration of 3% DSS in drinking water for 3 days followed by an additional 4 days of normal water intake. Scale bar = 30 µm. Right: Quantitation of Ki67+ cells per crypt, n = 30 crypts from 4 mice/group. ****P < 0.0001. D Reduced number of goblet cells in the colon of Fpr2-/- mice. An alcian blue stain. Scale bar = 50 μm. Right panel: Quantitation of PAS+ goblet cell number in the colon, n = 29-35 fields from 4 mice/group. ****P < 0.0001. F Increased production of IL-1β in the colon mucosa of Fpr2−/− mice after administration of 3% DSS in drinking water for 3 days followed by an additional 4 days of normal water intake. Red: IL-1β, Blue: DAPI. Scale bar = 30 μm. Right: Quantitative IL-1β + fluorescence intensity, n = 30 crypts from 4 mice/group. ****P < 0.0001
Fig. 6
Fig. 6
Fpr2 deficiency increased E. coli population in the colon of mice with colitis. A Increased E. coli counts in the feces of Fpr2−/− mice after administration of 3% DSS in drinking water for 5 days. Right: Quantitation of E. coli in mouse feces. The results are expressed as E. coli CFU (Log10)/g feces. n = 10–12 mice/group. *P < 0.05. B PCR analysis confirmed that the bacteria isolated from the mouse feces were E. coli. C. Increased numbers of bacteria invaded the colon epithelial cells of Fpr2−/− mice. Scale bar = 5 μm. Red arrows: Bacteria in colon epithelial cells. Right: Quantitation of bacteria in each epithelial cells. The results were expressed as area occupied by bacteria per cell (µm2). n = 30 cells/group, ****P < 0.0001. D FISH analysis showed that increased number of EUB338 + bacteria attached to the colon mucosa of Fpr2−/− mice. Red: EUB338 probe+ bacteria, Blue: Nuclei. Scale bar = 30 μm. Right: Quantitation of the EUB338 probe+ bacteria/field. n = 18–23 fields from 5 mice per group, *P < 0.05. E FISH analysis showed that increased number of number of EC1531 probe+ E. coli attached to the colon mucosa of Fpr2−/− mice. Red: EC1531+ E. coli, Blue: Nuclei. Scale bar = 30 μm. Right: Quantitation of the percentage (%) of EC1531+ E. coli in EUB338+ bacteria, n = 16 fields from 5 mice per group, *P < 0.05. F Increased level of LPS in the feces of Fpr2−/− mice. The results were expressed as ng/g feces. n = 4 mice/group, **P < 0.01. G Increased level of LPS in the serum of Fpr2−/− mice. The results were expressed as ng/ml serum. n = 4 mice/group, ****P < 0.0001

Similar articles

Cited by

References

    1. Nicholson JK, Holmes E, Kinross J, Burcelin R, Gibson G, Jia W, Pettersson S. Host-gut microbiota metabolic interactions. Science. 2012;336(6086):1262–1267. doi: 10.1126/science.1223813. - DOI - PubMed
    1. El Aidy S, Hooiveld G, Tremaroli V, Backhed F, Kleerebezem M. The gut microbiota and mucosal homeostasis: colonized at birth or at adulthood, does it matter? Gut Microbes. 2013;4(2):118–124. doi: 10.4161/gmic.23362. - DOI - PMC - PubMed
    1. Zeng MY, Inohara N, Nunez G. Mechanisms of inflammation-driven bacterial dysbiosis in the gut. Mucosal Immunol. 2017;10(1):18–26. doi: 10.1038/mi.2016.75. - DOI - PMC - PubMed
    1. Martinez JE, Kahana DD, Ghuman S, Wilson HP, Wilson J, Kim SCJ, Lagishetty V, Jacobs JP, Sinha-Hikim AP, Friedman TC. Unhealthy lifestyle and gut dysbiosis: a better understanding of the effects of poor diet and nicotine on the intestinal microbiome. Front Endocrinol (Lausanne) 2021;12:667066. doi: 10.3389/fendo.2021.667066. - DOI - PMC - PubMed
    1. Khan I, Ullah N, Zha L, Bai Y, Khan A, Zhao T, Che T, Zhang C. Alteration of gut microbiota in inflammatory bowel disease (IBD): cause or consequence? IBD Treatment targeting the gut microbiome. Pathogens. 2019;8(3):126. doi: 10.3390/pathogens8030126. - DOI - PMC - PubMed

LinkOut - more resources