. 2023 Jun 15;15(1):43.
doi: 10.1186/s13073-023-01196-1.

ReporTree: a surveillance-oriented tool to strengthen the linkage between pathogen genetic clusters and epidemiological data

Affiliations

ReporTree: a surveillance-oriented tool to strengthen the linkage between pathogen genetic clusters and epidemiological data

Verónica Mixão et al. Genome Med. .

Abstract

Background: Genomics-informed pathogen surveillance strengthens public health decision-making, playing an important role in infectious diseases' prevention and control. A pivotal outcome of genomics surveillance is the identification of pathogen genetic clusters and their characterization in terms of geotemporal spread or linkage to clinical and demographic data. This task often consists of the visual exploration of (large) phylogenetic trees and associated metadata, being time-consuming and difficult to reproduce.

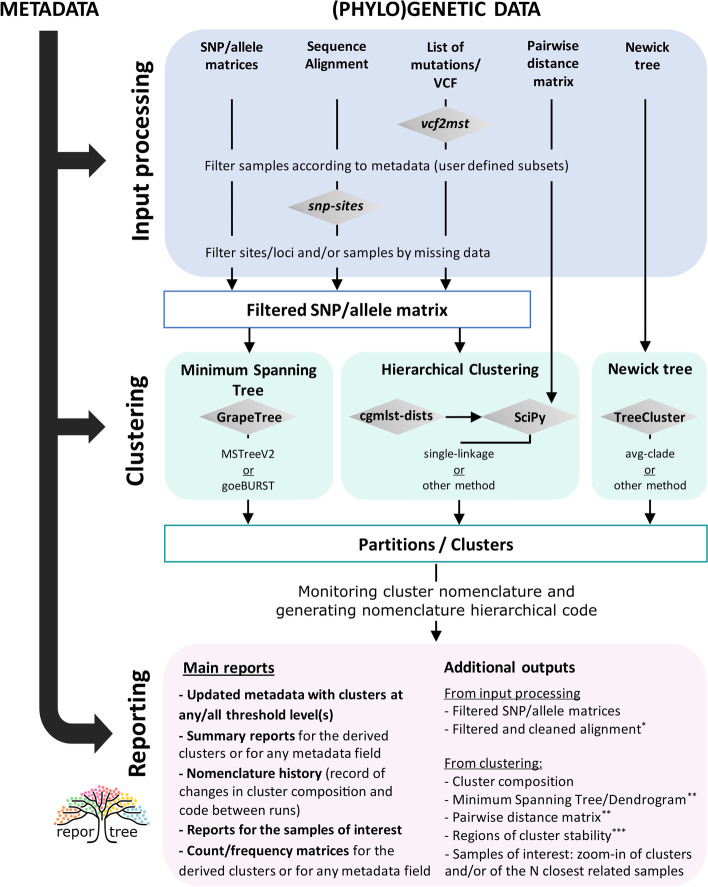
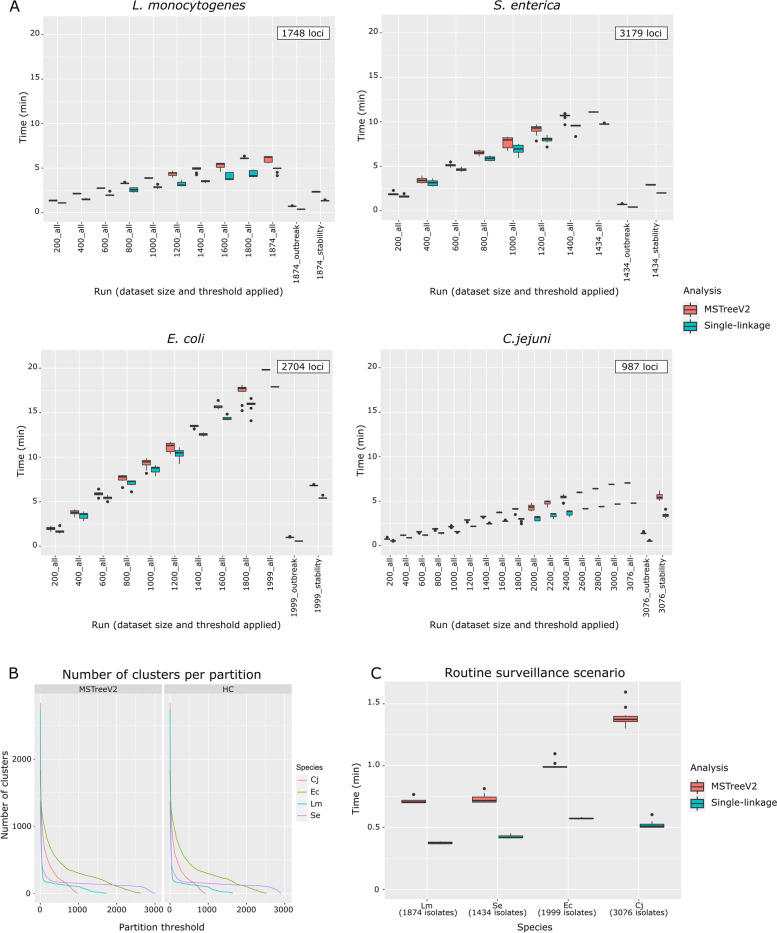
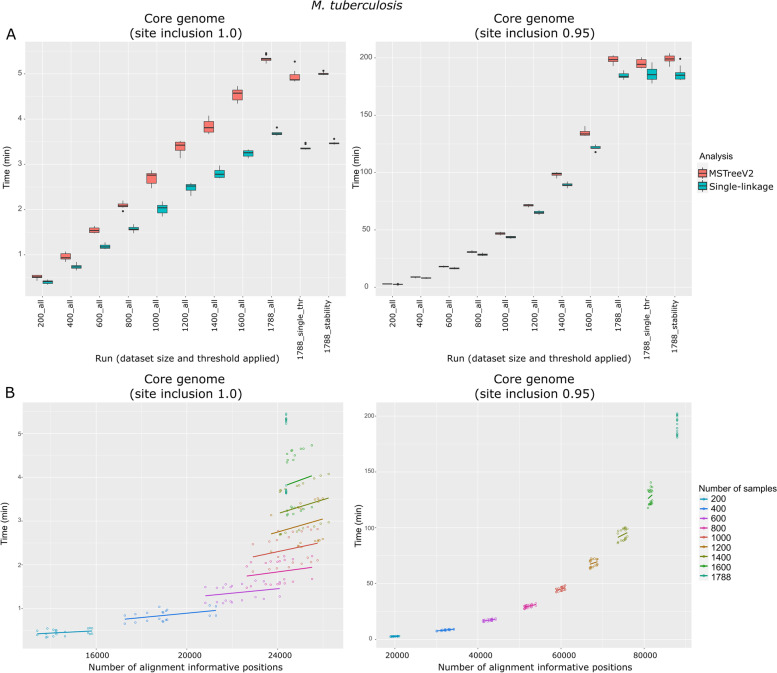
Results: We developed ReporTree, a flexible bioinformatics pipeline that allows diving into the complexity of pathogen diversity to rapidly identify genetic clusters at any (or all) distance threshold(s) or cluster stability regions and to generate surveillance-oriented reports based on the available metadata, such as timespan, geography, or vaccination/clinical status. ReporTree is able to maintain cluster nomenclature in subsequent analyses and to generate a nomenclature code combining cluster information at different hierarchical levels, thus facilitating the active surveillance of clusters of interest. By handling several input formats and clustering methods, ReporTree is applicable to multiple pathogens, constituting a flexible resource that can be smoothly deployed in routine surveillance bioinformatics workflows with negligible computational and time costs. This is demonstrated through a comprehensive benchmarking of (i) the cg/wgMLST workflow with large datasets of four foodborne bacterial pathogens and (ii) the alignment-based SNP workflow with a large dataset of Mycobacterium tuberculosis. To further validate this tool, we reproduced a previous large-scale study on Neisseria gonorrhoeae, demonstrating how ReporTree is able to rapidly identify the main species genogroups and characterize them with key surveillance metadata, such as antibiotic resistance data. By providing examples for SARS-CoV-2 and the foodborne bacterial pathogen Listeria monocytogenes, we show how this tool is currently a useful asset in genomics-informed routine surveillance and outbreak detection of a wide variety of species.

Conclusions: In summary, ReporTree is a pan-pathogen tool for automated and reproducible identification and characterization of genetic clusters that contributes to a sustainable and efficient public health genomics-informed pathogen surveillance. ReporTree is implemented in python 3.8 and is freely available at https://github.com/insapathogenomics/ReporTree .

Keywords: Automated pipeline; Genetic clustering; Genomic surveillance; Public health; ReporTree.


Conflict of interest statement

The authors declare that they have no competing interests.

Figures

Fig. 1
Fig. 1
Schematic representation of the three main steps of ReporTree pipeline. Blue background highlights the alternative input types, green background highlights the alternative clustering modules, and pink background highlights the main outputs of ReporTree. Arrows indicate the alternative workflows for each input. Single asterisk, only output when a sequence alignment is provided. Double asterisks, exclusive output of MST and HC analysis. Triple asterisks, output of an optional step (comparing partitions) not represented in the figure
Fig. 2
Fig. 2
Results of ReporTree benchmarking of the cg/wgMLST workflow using datasets for four different species: L. monocytogenes (Lm), S. enterica (Se), E. coli (Ec), and C. jejuni (Cj). A ReporTree running times for the 10 replicates of each subset of L. monocytogenes (top left), S. enterica (top right), E. coli (bottom left), and C. jejuni (bottom right), where the flag “all” indicates subsets for which ReporTree obtained clusters at all possible thresholds, the flag “outbreak” indicates subsets for which ReporTree obtained clusters at potential outbreak level (7 allelic differences for L. monocytogenes, 14 (0.43%) for S. enterica, 9 (0.34%) for E. coli, and 6 for (0.59%) for C. jejuni [14, 38]), and the flag “stability” indicates subsets for which ReporTree obtained clusters at all possible thresholds but only generated reports for those corresponding to stability regions. B Number of clusters generated at all possible distance thresholds for each dataset. C Comparison of running times when ReporTree obtained clusters at potential outbreak level
Fig. 3
Fig. 3
Results of ReporTree benchmarking of the alignment-based core SNP workflow using a multi-sequence alignment of 1788 M. tuberculosis samples and 88,562 informative nucleotide positions. A ReporTree running times for the 10 replicates of each sample subset with a site inclusion of 1.0 (left) and 0.95 (right), where the flag “all” indicates subsets for which ReporTree obtained clusters at all possible thresholds, the flag “single_thr” indicates subsets for which ReporTree obtained clusters at potential “transmission chain” level (12 SNP differences), and the flag “stability” indicates subsets for which ReporTree obtained clusters at all possible thresholds but only generated reports for those corresponding to stability regions. B ReporTree running times according to the number of variant sites obtained after alignment cleaning and that were used for clustering. Technical notes: 1. The “site-inclusion” argument defines informative nucleotide sites to be kept in the alignment based on the minimum proportion of samples per site without missing data (e.g., 1.0 reflects a “true” core alignment with all variant sites having exclusively ATCG, and 0.95 reflects a core alignment tolerating 5% of undefined nucleotides per site). 2. The M. tuberculosis dataset used in this benchmarking is described at [42]

Similar articles

Cited by

References

    1. Jolley KA, Maiden MCJ. Using multilocus sequence typing to study bacterial variation: prospects in the genomic era. Future Microbiol. 2014;9:623–630. doi: 10.2217/fmb.14.24. - DOI - PubMed
    1. Wohl S, Schaffner SF, Sabeti PC. Genomic analysis of viral outbreaks. Annu Rev Virol. 2016;3:173–195. doi: 10.1146/annurev-virology-110615-035747. - DOI - PMC - PubMed
    1. Ribeiro-Gonçalves B, Francisco AP, Vaz C, Ramirez M, Carriço JA. PHYLOViZ Online: web-based tool for visualization, phylogenetic inference, analysis and sharing of minimum spanning trees. Nucleic Acids Res. 2016;44:W246–W251. doi: 10.1093/nar/gkw359. - DOI - PMC - PubMed
    1. Zhou Z, Alikhan N-F, Sergeant MJ, Luhmann N, Vaz C, Francisco AP, et al. GrapeTree: visualization of core genomic relationships among 100,000 bacterial pathogens. Genome Res. 2018;28:1395–1404. doi: 10.1101/gr.232397.117. - DOI - PMC - PubMed
    1. Hadfield J, Megill C, Bell SM, Huddleston J, Potter B, Callender C, et al. Nextstrain: real-time tracking of pathogen evolution. Bioinformatics. 2018;34:4121–4123. doi: 10.1093/bioinformatics/bty407. - DOI - PMC - PubMed

Publication types