. 2023 Jun 15;16(1):24.
doi: 10.1186/s13072-023-00499-2.

Assignment of the somatic A/B compartments to chromatin domains in giant transcriptionally active lampbrush chromosomes

Affiliations

Assignment of the somatic A/B compartments to chromatin domains in giant transcriptionally active lampbrush chromosomes

Alla Krasikova et al. Epigenetics Chromatin. .

Abstract

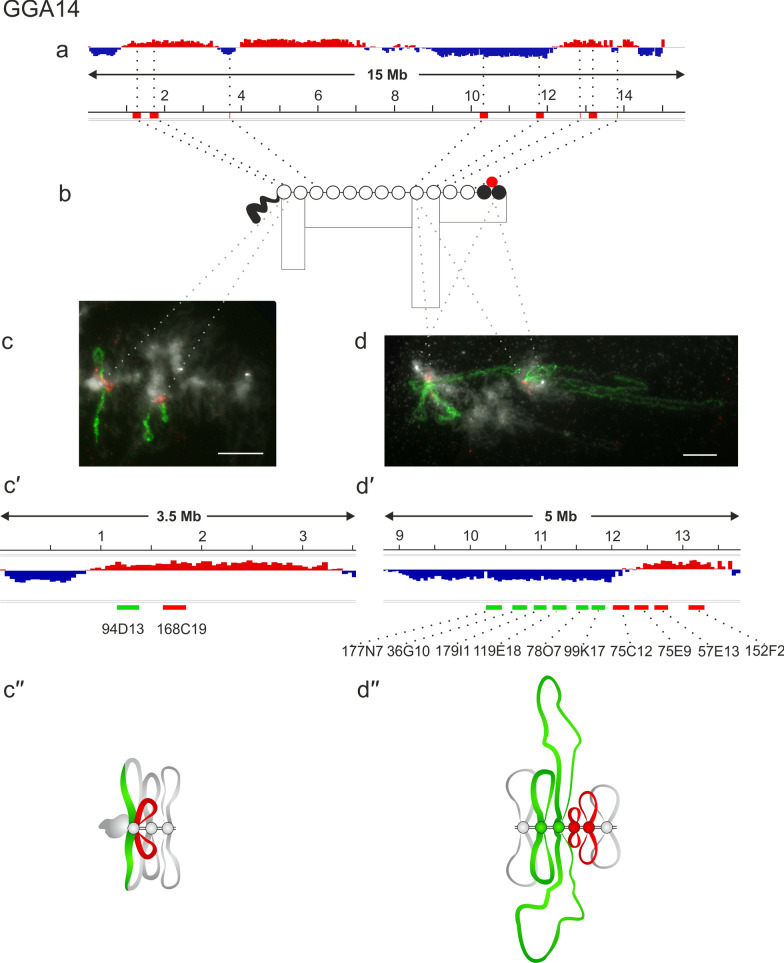
Background: The three-dimensional configuration of the eukaryotic genome is an emerging area of research. Chromosome conformation capture outlined genome segregation into large scale A and B compartments corresponding mainly to transcriptionally active and repressive chromatin. It remains unknown how the compartmentalization of the genome changes in growing oocytes of animals with hypertranscriptional type of oogenesis. Such oocytes are characterized by highly elongated chromosomes, called lampbrush chromosomes, which acquire a typical chromomere-loop appearance, representing one of the classical model systems for exploring the structural and functional organization of chromatin domains.

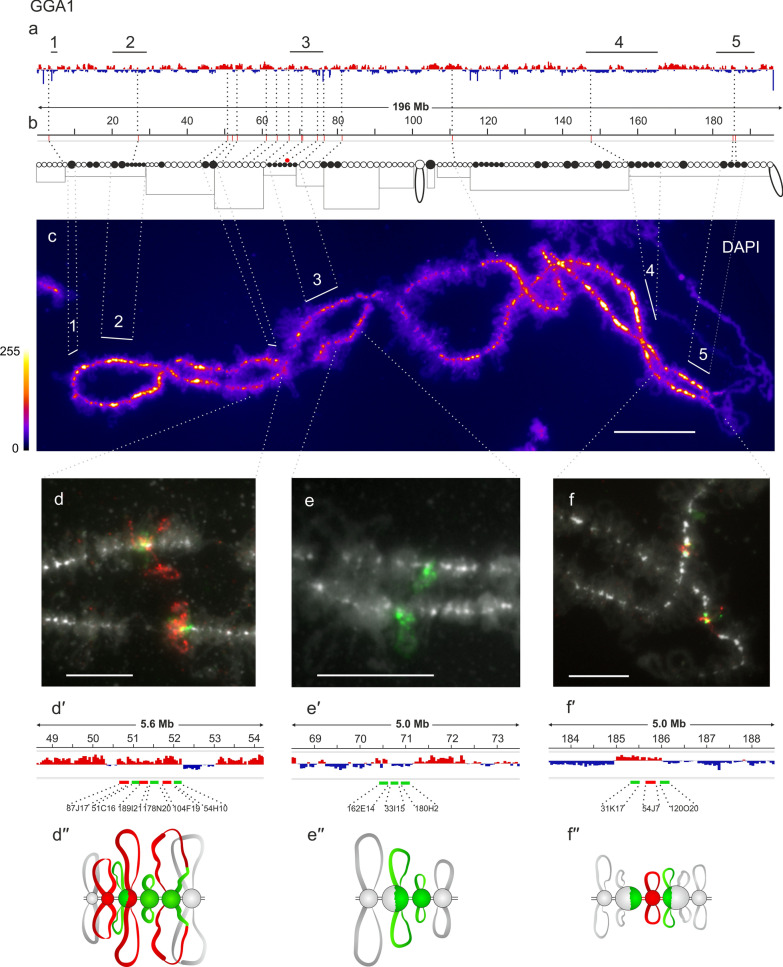
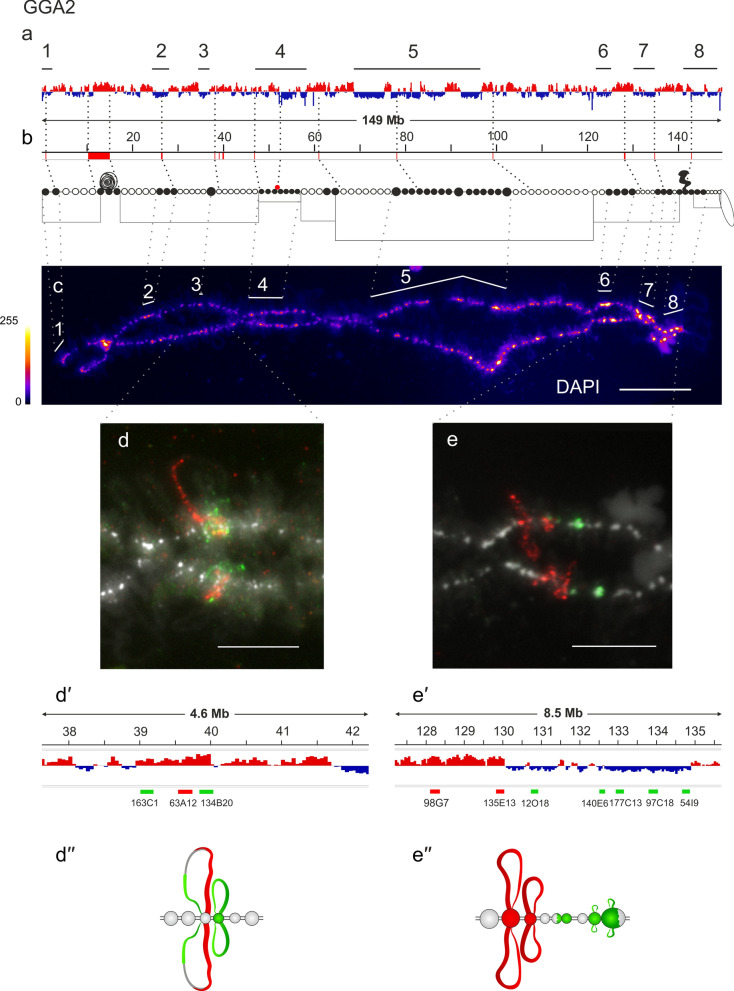
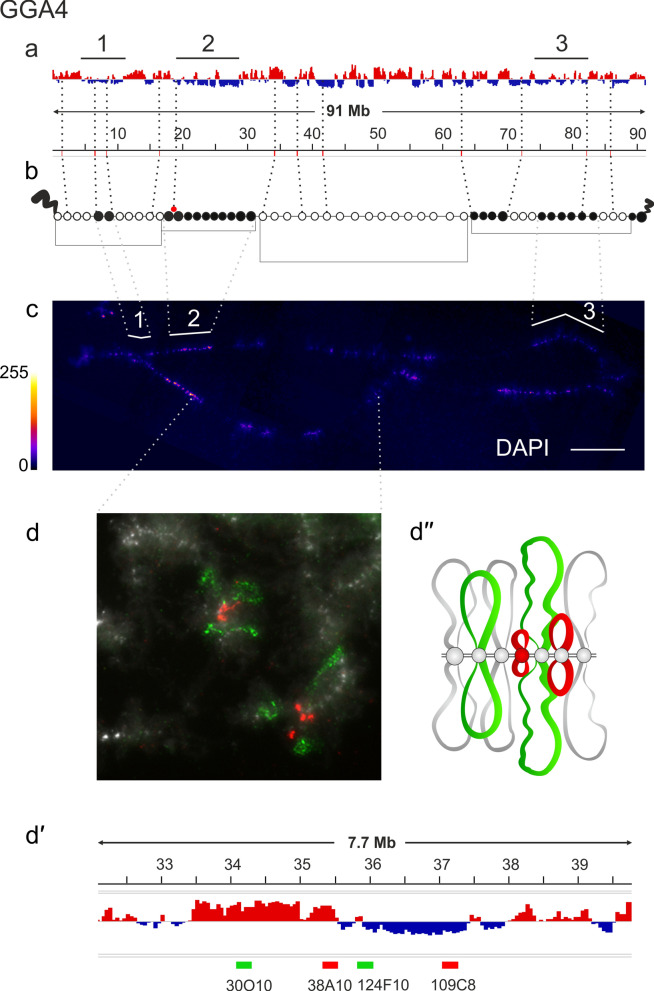
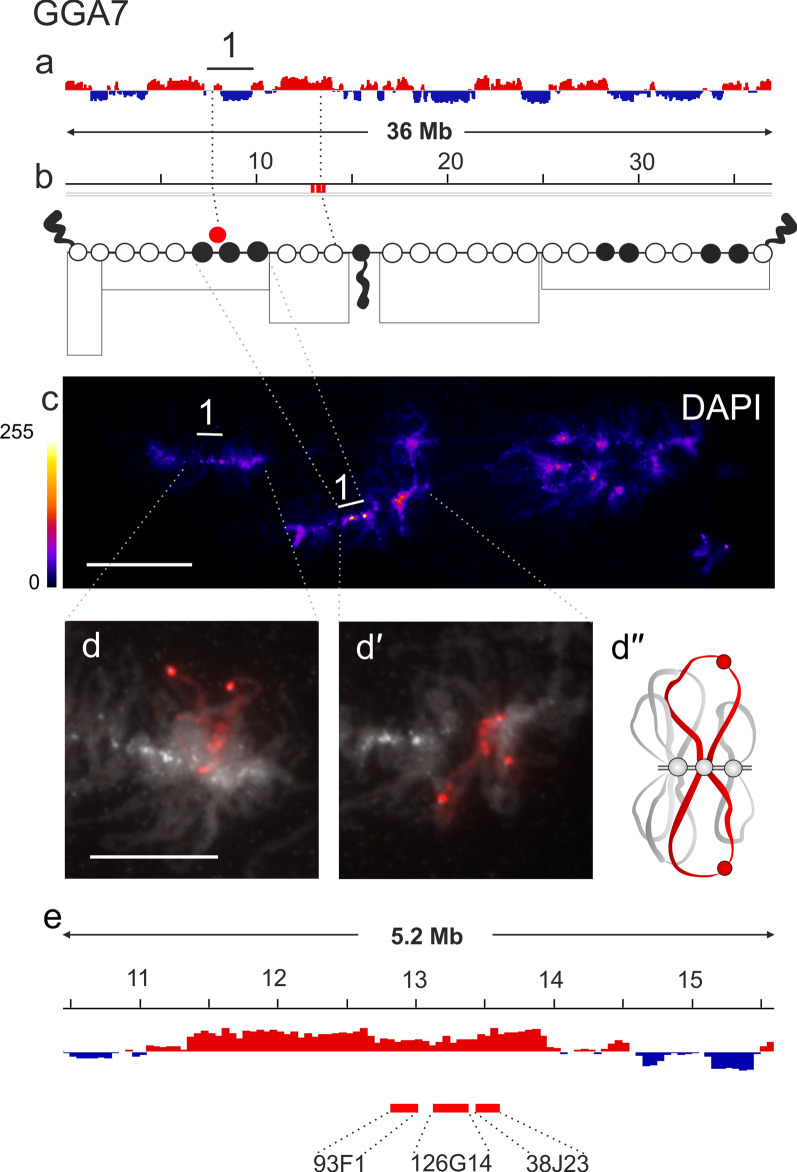
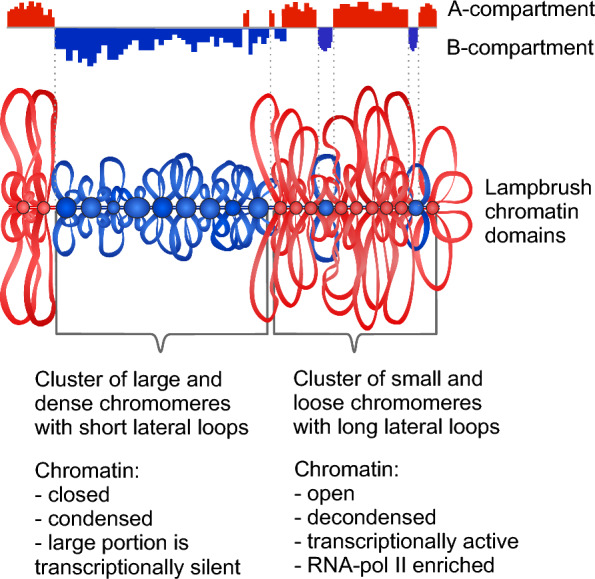
Results: Here, we compared the distribution of A/B compartments in chicken somatic cells with chromatin domains in lampbrush chromosomes. We found that in lampbrush chromosomes, the extended chromatin domains, restricted by compartment boundaries in somatic cells, disintegrate into individual chromomeres. Next, we performed FISH-mapping of the genomic loci, which belong to A or B chromatin compartments as well as to A/B compartment transition regions in embryonic fibroblasts on isolated lampbrush chromosomes. We found, that in chicken lampbrush chromosomes, clusters of dense compact chromomeres bearing short lateral loops and enriched with repressive epigenetic modifications generally correspond to constitutive B compartments in somatic cells. A compartments align with lampbrush chromosome segments with smaller, less compact chromomeres, longer lateral loops, and a higher transcriptional status. Clusters of small loose chromomeres with relatively long lateral loops show no obvious correspondence with either A or B compartment identity. Some genes belonging to facultative B (sub-) compartments can be tissue-specifically transcribed during oogenesis, forming distinct lateral loops.

Conclusions: Here, we established a correspondence between the A/B compartments in somatic interphase nucleus and chromatin segments in giant lampbrush chromosomes from diplotene stage oocytes. The chromomere-loop structure of the genomic regions corresponding to interphase A and B compartments reveals the difference in how they are organized at the level of chromatin domains. The results obtained also suggest that gene-poor regions tend to be packed into chromomeres.

Keywords: A/B compartments; Chicken genome; Chromomere; Chromosome conformation capture; FISH-mapping; Hypertranscription; Lampbrush chromosomes; Meiotic chromosomes; Oocyte nucleus; Transcription loops.


Conflict of interest statement

None of the authors have any competing interests.

Figures

Fig. 1
Fig. 1
Alignment of interphase genome A/B compartments along chicken chromosome 1 with chromomeric pattern of the corresponding lampbrush chromosome. a—Distribution of A (red) and B (dark blue) compartments along the chicken chromosome 1 (GGA1) in embryonic fibroblasts viewed by Integrative Genomics Viewer (IGV) (according to [15]); b—cytological map of chicken lampbrush chromosome 1 depicting DAPI-staining pattern of chromomeres and relative contour length of lateral loops, black circles–dense chromomeres brightly stained with DAPI (according to [53, 54]). Dotted lines in a, b connect the genomic positions of the selected BAC-clones (Additional file 1: Table S1) with their positions on the cytological map; c—lampbrush chromosome 1 stained with DAPI, pixel intensities displayed with multicolored ImageJ look-up table, numbered lines in a and c indicate positions of chromomere clusters brightly stained with DAPI; d, e, f—DNA+RNA-FISH with BAC-clone based DNA-probes (Additional file 1: Table S2) covering the genomic regions 50–52 Mb (d), 70–71 Mb (e), and 185–186 Mb (f) on chicken lampbrush chromosome 1; dotted lines from c to df indicate chromosomal positions of the regions on microphotographs; dʹ–fʹ—the positions of the mapped BAC-clones relative to the somatic A/B compartments; dʹʹ–fʹʹ—schematic drawings of the FISH-mapping of the selected genomic regions on lampbrush chromatin domains; colors correspond to the colors of the labeled DNA-probes on the FISH images. Scale bar: c–20 μm, df—10 μm
Fig. 2
Fig. 2
Alignment of interphase genome A/B compartments along chicken chromosome 2 with chromomeric pattern of the corresponding lampbrush chromosome. a—Distribution of A (red) and B (dark blue) compartments along the chicken chromosome 2 (GGA2) in embryonic fibroblasts viewed by Integrative Genomics Viewer (IGV) (according to [15]); b—cytological map of chicken lampbrush chromosome 2 depicting DAPI-staining pattern of chromomeres and relative contour length of lateral loops, black circles—dense chromomeres brightly stained with DAPI (according to [53, 54]). Dotted lines in a, b connect the genomic positions of the selected BAC-clones and chromosomal marker structures (Additional file 1: Table S1) with their positions on the cytological map; c—lampbrush chromosome 2 stained with DAPI, pixel intensities displayed with multicolored ImageJ look-up table, numbered lines in a and c indicate positions of chromomere clusters brightly stained with DAPI; d, e—DNA+RNA-FISH with BAC-clone based DNA-probes (Additional file 1: Table S2) covering the genomic regions 39–40 Mb (d), 128–135 Mb (e) on chicken lampbrush chromosome 2; dotted lines from c to d and e indicate chromosomal positions of the regions on microphotographs; dʹʹ, eʹ—the positions of the mapped BAC-clones relative to the somatic A/B compartments; d, eʹʹ—schematic drawings of the FISH-mapping of the selected genomic regions on lampbrush chromatin domains; colors correspond to the colors of the labeled DNA-probes on the FISH images. Scale bar: c—20 μm, d, e—10 μm.
Fig. 3
Fig. 3
Alignment of interphase genome A/B compartments along chicken chromosome 4 with chromomeric pattern of the corresponding lampbrush chromosome. a—Distribution of A (red) and B (dark blue) compartments along the chicken chromosome 4 (GGA4) in embryonic fibroblasts viewed by Integrative Genomics Viewer (IGV) (according to [15]); b—cytological map of chicken lampbrush chromosome 4 depicting DAPI-staining pattern of chromomeres and relative contour length of lateral loops, black circles—dense chromomeres brightly stained with DAPI (according to [53]). Dotted lines in a, b connect the genomic positions of the selected BAC-clones (Additional file 1: Table S1) with their positions on the cytological map; c—lampbrush chromosome 4 stained with DAPI, pixel intensities displayed with multicolored ImageJ look-up table, numbered lines in a and c indicate positions of chromomere clusters brightly stained with DAPI; d—DNA+RNA-FISH with BAC-clone based DNA-probes (Additional file 1: Table S2) covering the genomic region 34–37 Mb (d) on chicken lampbrush chromosome 4; dotted lines from c to d indicate chromosomal position of the region on microphotographs; dʹ—the positions of the mapped BAC-clones relative to the somatic A/B compartments; dʹ—schematic drawing of the FISH-mapping of the selected genomic region on lampbrush chromatin domains; colors correspond to the colors of the labeled DNA-probes on the FISH image. Scale bar: c—20 μm, d—10 μm.
Fig. 4
Fig. 4
Alignment of interphase genome A/B compartments along chicken chromosome 7 with chromomeric pattern of the corresponding lampbrush chromosome. a—Distribution of A (red) and B (dark blue) compartments along the chicken chromosome 7 (GGA7) in embryonic fibroblasts viewed by Integrative Genomics Viewer (IGV) (according to [15]); b—cytological map of chicken lampbrush chromosome 7 depicting DAPI-staining pattern of chromomeres and relative contour length of lateral loops, black circles–dense chromomeres brightly stained with DAPI. Dotted lines in a, b connect the genomic positions of the BAC-clones (Additional file 1: Table S1) with their positions on the cytological map; c—lampbrush chromosome 7 stained with DAPI, pixel intensities displayed with multicolored ImageJ look-up table, numbered line in a and c indicates position of chromomere cluster brightly stained with DAPI; d, dʹ–DNA+RNA-FISH with BAC-clone based DNA-probes (Additional file 1: Table S2) covering the genomic region 12–14 Mb on chicken lampbrush chromosome 7; dotted lines from c to d, d′ indicate chromosomal positions of the region on microphotographs; dʹʹ—schematic drawing of the FISH-mapping of the selected genomic region (d, dʹ) on lampbrush chromatin domains; colors correspond to the colors of the labeled DNA-probes on the FISH images. e—the positions of the mapped BAC-clones relative to the somatic A/B compartments. Scale bar: c—20 μm, d, dʹ—10 μm.
Fig. 5
Fig. 5
Alignment of interphase genome A/B compartments along chicken chromosome 14 with chromomeric pattern of the corresponding lampbrush chromosome. a—Distribution of A (red) and B (dark blue) compartments along the chicken chromosome 14 (GGA14) in embryonic fibroblasts viewed by Integrative Genomics Viewer (IGV) (according to [15]); b—cytological map of chicken lampbrush chromosome 14 depicting DAPI-staining pattern of chromomeres and relative contour length of lateral loops, black circles—dense chromomeres brightly stained with DAPI (according to [54]). Dotted lines in a, b connect the genomic positions of the BAC-clones (Additional file 1: Table S1) with their positions on the cytological map; c, d—DNA + RNA-FISH with BAC-clone based DNA-probes (Additional file 1: Table S2) covering the genomic regions 1–2 Mb cʹ and 10–13 Mb dʹ on chicken lampbrush chromosome 14, dotted lines from b to c and d indicate positions of the regions on the cytological map; cʹ, dʹ—the positions of the mapped BAC-clones relative to the somatic A/B compartments; cʹʹ, dʹʹ—schematic drawing of the FISH-mapping of the selected genomic regions (c, d) on lampbrush chromatin domains; colors correspond to the colors of the labeled DNA-probes on the FISH images. Scale bar: 10 μm
Fig. 6
Fig. 6
Schematic drawing generalizing the correspondence between A or B compartments present in interphase genome and lampbrush chromosome segments. Chromosomal segments with more globular compact chromomeres and short lateral loops correspond to B compartment (blue), whereas chromosomal segments composed by small loose chromomeres with long transcription loops correspond to A compartment (red)

Similar articles

Cited by

References

    1. Jerkovic´ I, Cavalli G. Understanding 3D genome organization by multidisciplinary methods. Nat Rev Mol Cell Biol. 2021;22:511–528. doi: 10.1038/s41580-021-00362-w. - DOI - PubMed
    1. Lieberman-Aiden E, van Berkum NL, Williams L, Imakaev M, Ragoczy T, Telling A, et al. Comprehensive mapping of long-range interactions reveals folding principles of the human genome. Science. 2009;326:289–293. doi: 10.1126/science.1181369. - DOI - PMC - PubMed
    1. Rao SSP, Huntley MH, Durand NC, Stamenova EK, Bochkov ID, Robinson JT, et al. A 3D map of the human genome at kilobase resolution reveals principles of chromatin looping. Cell. 2014;159:1665–1680. doi: 10.1016/j.cell.2014.11.021. - DOI - PMC - PubMed
    1. Dixon JR, Selvaraj S, Yue F, Kim A, Li Y, Shen Y, et al. Topological domains in mammalian genomes identified by analysis of chromatin interactions. Nature. 2012;485:376–380. doi: 10.1038/nature11082. - DOI - PMC - PubMed
    1. Fraser J, Williamson I, Bickmore WA, Dostie J. An overview of genome organization and how we got there: from FISH to Hi-C. Microbiol Mol Biol Rev. 2015;79:347–372. doi: 10.1128/MMBR.00006-15. - DOI - PMC - PubMed

LinkOut - more resources