. 2023 Jun 15;11(1):135.
doi: 10.1186/s40168-023-01574-2.

Vitamin B12 produced by Cetobacterium somerae improves host resistance against pathogen infection through strengthening the interactions within gut microbiota

Affiliations

Vitamin B12 produced by Cetobacterium somerae improves host resistance against pathogen infection through strengthening the interactions within gut microbiota

Xiaozhou Qi et al. Microbiome. .

Abstract

Background: Pathogen infections seriously affect host health, and the use of antibiotics increases the risk of the emergence of drug-resistant bacteria and also increases environmental and health safety risks. Probiotics have received much attention for their excellent ability to prevent pathogen infections. Particularly, explaining mechanism of action of probiotics against pathogen infections is important for more efficient and rational use of probiotics and the maintenance of host health.

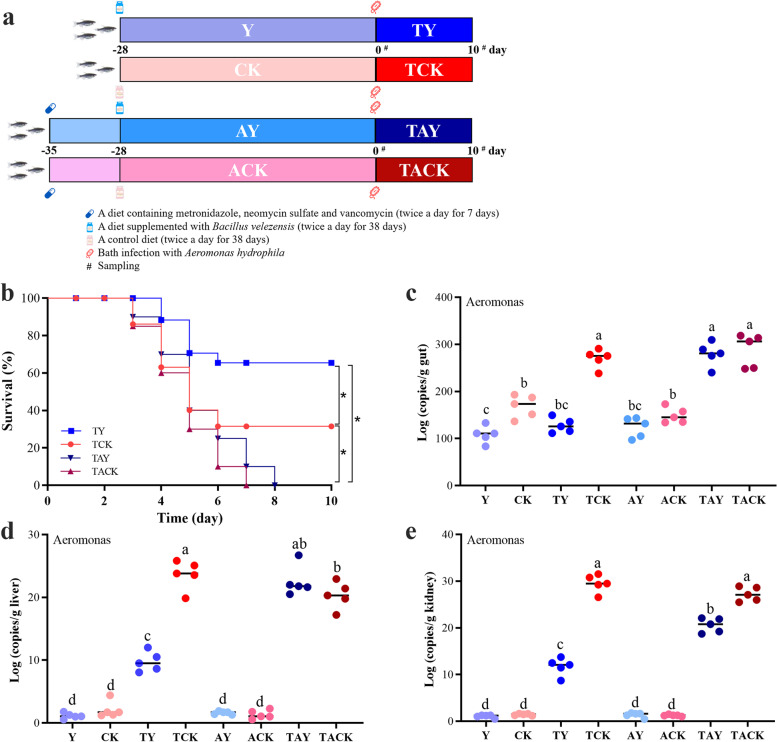
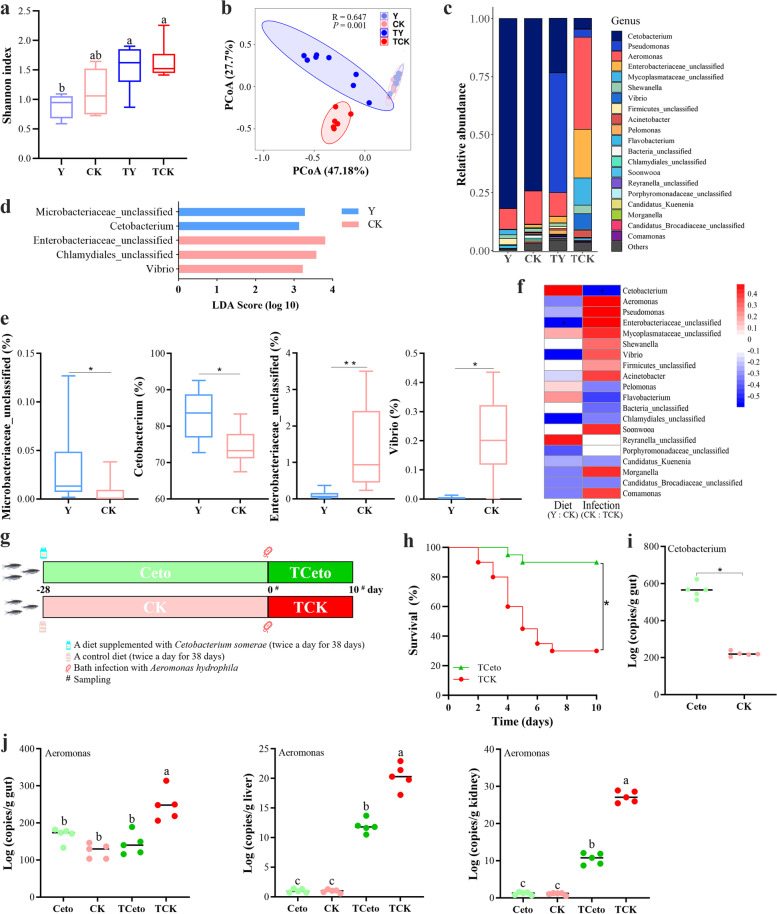
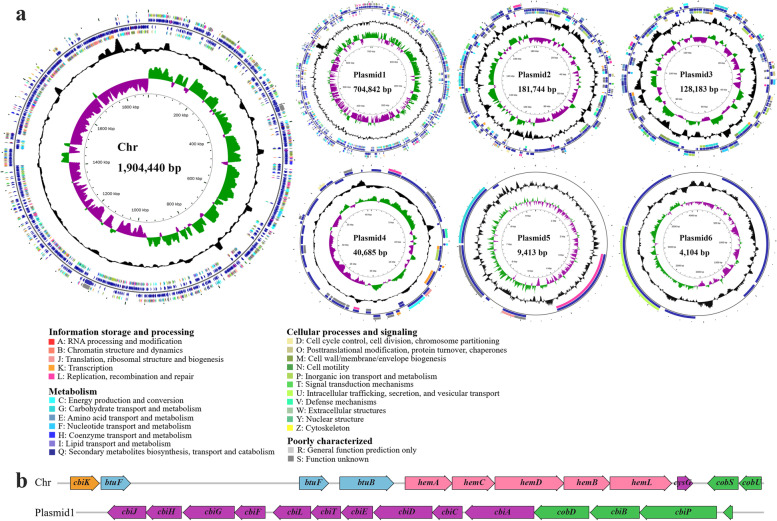
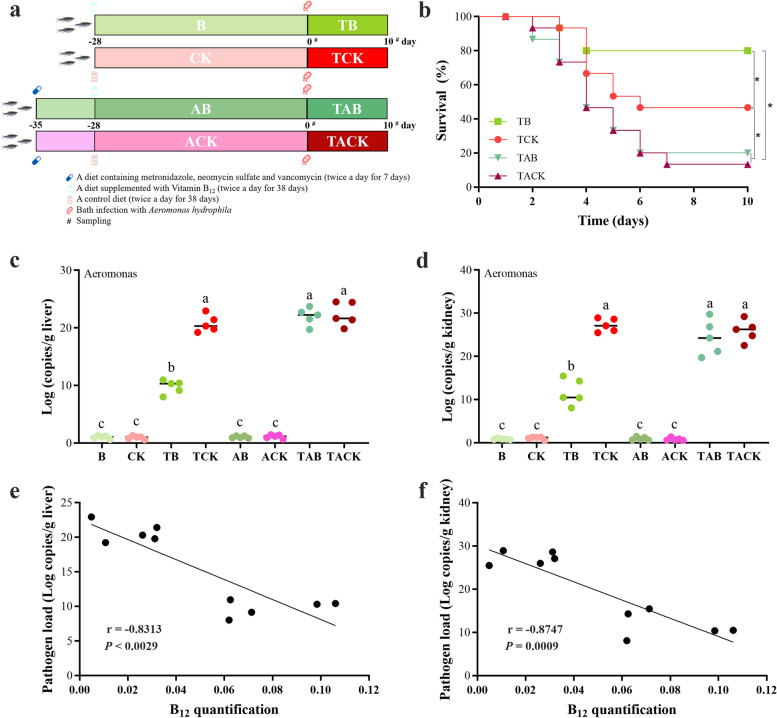
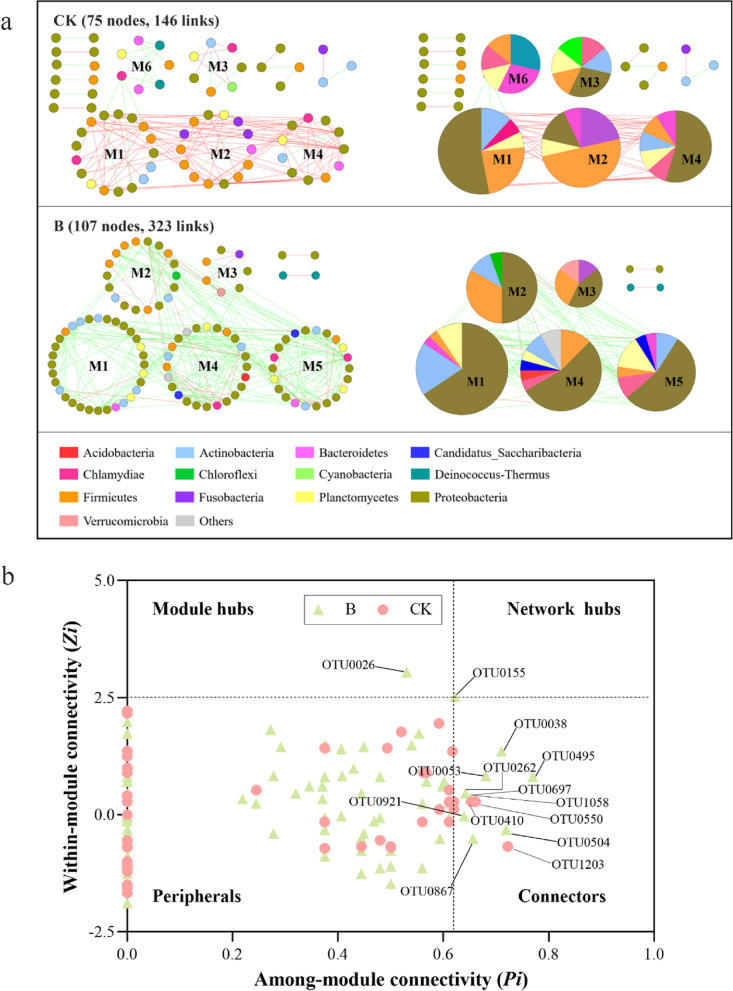
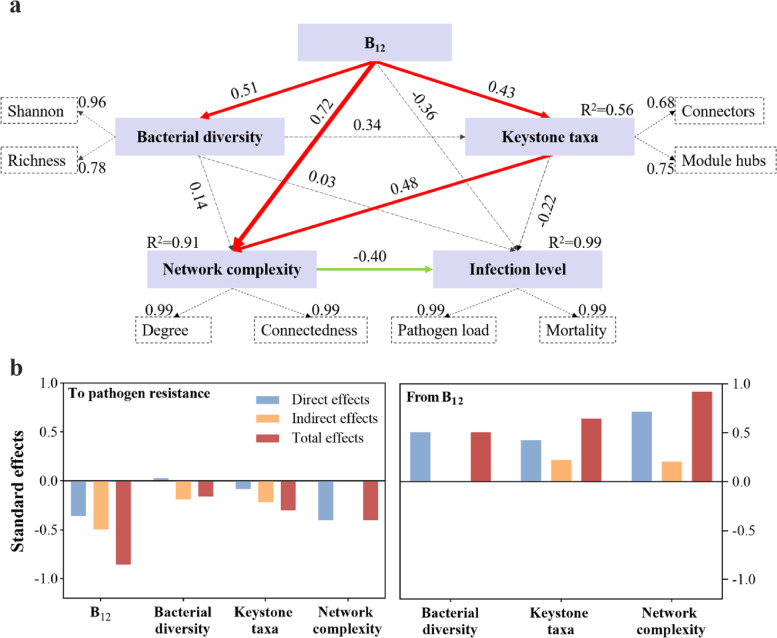
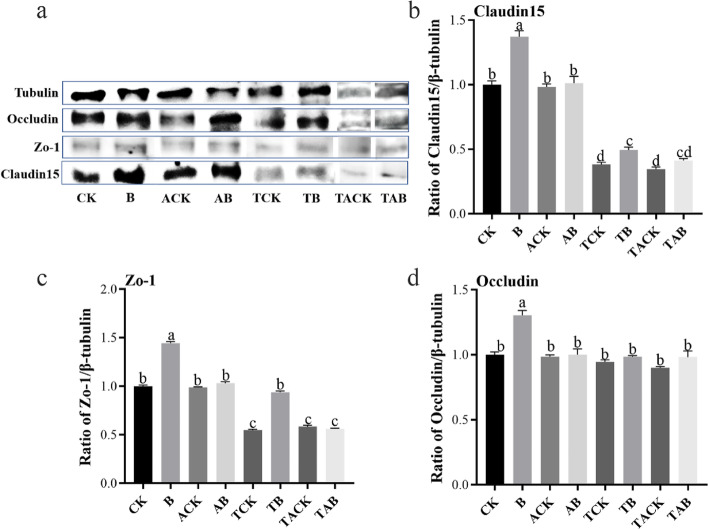
Results: Here, we describe the impacts of probiotic on host resistance to pathogen infections. Our findings revealed that (I) the protective effect of oral supplementation with B. velezensis against Aeromonas hydrophila infection was dependent on gut microbiota, specially the anaerobic indigenous gut microbe Cetobacterium; (II) Cetobacterium was a sensor of health, especially for fish infected with pathogenic bacteria; (III) the genome resolved the ability of Cetobacterium somerae CS2105-BJ to synthesize vitamin B12 de novo, while in vivo and in vitro metabolism assays also showed the ability of Cetobacterium somerae CS2105-BJ to produce vitamin B12; (IV) the addition of vitamin B12 significantly altered the gut redox status and the gut microbiome structure and function, and then improved the stability of the gut microbial ecological network, and enhanced the gut barrier tight junctions to prevent the pathogen infection.

Conclusion: Collectively, this study found that the effect of probiotics in enhancing host resistance to pathogen infections depended on function of B12 produced by an anaerobic indigenous gut microbe, Cetobacterium. Furthermore, as a gut microbial regulator, B12 exhibited the ability to strengthen the interactions within gut microbiota and gut barrier tight junctions, thereby improving host resistance against pathogen infection. Video Abstract.

Keywords: Cetobacterium; Co-occurrence network; Gut microbiome; Pathogen resistance; Probiotics; Vitamin B12.


Conflict of interest statement

The authors declare no competing interests.

Figures

Fig. 1
Fig. 1
Microbiota is essential to protect fish against A. hydrophila infection after B. velezensis 1704-Y supplementation. a The experimental design. (i) The zebrafish were fed a basic diet supplemented with/without B. velezensis 1704-Y (1 × 107 CFU/g diet) for 28 days (Group Y/CK), respectively, and then bath infected with A. hydrophila AH2006-3 J at a concentration of 1 × 108 CFU/mL (Group TY/TCK); (ii) The zebrafish were fed a diet containing an antibiotic mix (120 mg/kg metronidazole, 120 mg/kg neomycin sulfate and 60 mg/kg vancomycin) for 7 days (Group AY/ACK), and then received the same treatments as (i) (Group TAY/TACK). b Kaplan–Meier graph of the zebrafish survival after bath infection with A. hydrophila. * indicates significant difference (P < 0.05) between different groups. c–e Aeromonas load (Aero gene copies/g of fish tissues) in fish tissues (gut, liver and kidney) sampled prior to bath infection or at 10 days post-infection. Significant differences (P < 0.05) between different groups are indicated with different lowercase letters above the bars
Fig. 2
Fig. 2
Resistance to A. hydrophila infection is conferred by Cetobacterium somerae. a Shannon index comparison among the different groups. The zebrafish in Group Y and CK were fed a basic diet supplemented with/without Bacillus velezensis 1704-Y (BV1704-Y), respectively, and then bath infected with A. hydrophila 2006-3 J (AH2006-3 J) at a concentration of 1 × 108 CFU/mL (Group TY/TCK). b A principal coordinate analysis (PCoA) based on Bray–Curtis distance from the different groups (Y, CK, TY, and TCK) (ANOSIM R = 0.647, P = 0.001). c Relative abundance of the top 20 genera in the fish gut from the different groups. d Discriminative biomarkers identified by linear discriminant analysis effect size (LEfSe) with logarithmic LDA score > 3.0. e Relative abundance of selected different taxa. Data are expressed as box plot. ∗ P < 0.05, ∗  ∗ P < 0.01 by Mann–Whitney U test with Bonferroni-adjusted P-values. f Heat map of Pearson’s correlation coefficients between the top 20 genera and the diets (Y:CK, left) or infection status (CK:TCK, right). Dark red indicates a stronger positive correlation, dark blue indicates a stronger negative correlation, and white indicates no correlation. Black asterisk (*) means FDR-corrected P-value < 0.05. g The experimental design. The zebrafish were fed a basic diet supplemented with/without Cetobacterium somerae CS2105-BJ (1 × 107 CFU/g diet) for 28 days (Group Ceto/CK), and then bath infected with AH2006-3 J at a concentration of 1 × 108 CFU/mL (Group TCeto/TCK). h Kaplan–Meier graph of the zebrafish survival after bath infection with AH2006-3 J. i Cetobacterium load (gene copies/g of fish gut) in the gut of fish sampled prior to bath infection. j Aeromonas load (Aero gene copies/g of fish tissues) in fish tissues (gut, liver and kidney) sampled prior to bath infection or at 10 days post-infection. Significant differences (P < 0.05) between different groups are indicated with different lowercase letters
Fig. 3
Fig. 3
Genome analysis reveals the ability of C. somerae CS2105-BJ to synthesize vitamin B12 de novo. a Circular genomic map of CS2105-BJ chromosome and six plasmids. From the innermost to outermost circle, Circle 1 represents genome size; Circle 2 (dark purple and bottle green) represents GC skew; Circle 3 (black) shows GC plot; Circles 4 and 7 are color-coded according to the COG classification of the genes located on the forward and reverse strands, respectively. Circles 5 and 6 show the CDSs (dark blue), tRNA genes (dull red), and rRNA regions (purple). b Genomic organization of vitamin B12 biosynthetic genes. The pink arrows represent the genes for Uroporphyrinogen-III synthesis; the purple ones represent genes involved in the corrin ring synthesis; the orange one represents cobalt chelatase gene for insertion of cobalt ions into the corrin ring; the green ones represent genes for the attachment of the aminopropanol arm and assembly of the nucleotide loop in vitamin B12; the blue ones represent the genes encoding ABC transport systems for vitamin B12
Fig. 4
Fig. 4
Gut microbiota are the basis of B12 protection against A. hydrophila infection in zebrafish. a The experimental design. (i) The zebrafish were fed a basic diet supplemented with/without vitamin B12 (200 μg/kg diet per day) for 28 days (Group B/CK), respectively, and then bath infected with A. hydrophila strain at a concentration of 1 × 108 CFU/mL (Group TB/TCK). (ii) The zebrafish were fed a diet containing an antibiotic mix (120 mg/kg metronidazole, 120 mg/kg neomycin sulfate and 60 mg/kg vancomycin) for 7 days (Group AB/ACK), and then received the same treatments as (i) (Group TAB/TACK). b Kaplan–Meier graph of the zebrafish survival after bath infection with A. hydrophila. * indicates significant difference (P < 0.05) between different groups. c, d Aeromonas load (Aero gene copies/g of fish tissues) in fish tissues (liver and kidney) sampled prior to bath infection or at 10 days post-infection. Significant differences (P < 0.05) between different groups are indicated with different lowercase letters above the bars. e, f Linear correlation between the B12 content and pathogen load in liver and kidney, respectively. Linear correlation was performed with Pearson’s linear correlation
Fig. 5
Fig. 5
Vitamin B12 induces alterations in gut microbiota structure and function. a Principal coordinate analysis (PCoA) of Bray–Curtis distance was analyzed based on OTU level for microbiota beta diversity (ANOSIM R = 0.7817, P = 0.003). b Phylum-level taxonomic distributions of the microbial communities in gut of zebrafish fed with different diets. c Liner discriminant analysis effect size (LEfSe) was used to analyze the difference in microbial abundance between control and B12 supplemented group. The LDA value threshold was set at 4.0. d Bacterial community phenotypes of the gut microbiome were predicted using BugBase. Statistical significance was identified by the Wilcoxon test with false discovery rate (FDR)-corrected pairwise P-values. *, P < 0.05. e Functional alterations of the gut microbiome in zebrafish fed with control (CK) and B12-supplemented diet (B). Statistical significance was determined by using LEfSe, with a P value of < 0.05 (Wilcoxon test) and a linear discriminant analysis (LDA) score (log10) of > 2.5 being considered significant
Fig. 6
Fig. 6
Vitamin B12 influence the modules and the keystone taxa in the gut ecological network. a Network modules in different groups. Large modules (> 5 nodes) are shown in circular layout. Major phyla are indicated by the node colors. Positive and negative correlations are indicated by red and green connections, respectively. The matching pie charts for each network in the right panel indicate the distribution of the major phyla. The module ID of each large module is indicated by M1 to M6. b Classification of nodes in CK and B networks to find possible keystone OTUs. Each symbol represents an OTU. Pale green symbols represent the nodes in group B. Pink symbols represent the nodes in group CK. Zi > 2.5 and Pi > 0.62 indicates network hubs; Zi > 2.5 and Pi ≤ 0.62 indicate module hubs; Zi ≤ 2.5 and Pi > 0.62 indicate connectors; and Zi ≤ 2.5 and Pi ≤ 0.62 indicate peripherals. Detailed taxonomic information for node is listed in Table S4
Fig. 7
Fig. 7
Effects of the major factors on the pathogen resistance as determined by the PLS-PM analysis. a PLS-PM showing the cascading relationships of different factors. An observable variable or a latent variable is represented by a box. The loading for bacterial diversity, the potential keystone taxa, the network complexity, and infection level that create the latent variables are shown in the dashed rectangles. After 1000 bootstraps, path coefficients are calculated and represented by the width of the arrow (red stands for positive relationship, green stands for negative relationship). The dashed arrow indicates a coefficient that did not differ significantly from 0 (P > 0.05). The GoF statistic was used to evaluate the model, and the GoF value was 0.74. b Standardized effects of each factor on zebrafish pathogen resistance profiles calculated from the results of partial least squares path modeling. The direct and indirect impacts are added together to form the total effects
Fig. 8
Fig. 8
B12 enhances the tight junctions in the gut of zebrafish. a Western blots showing the expression of Zo-1, Occludin, and Claudin15 in the gut of zebrafish. b–d Densitometric analysis of Western blots from protein samples of the gut. Data were normalized for β-tubulin expression and expressed as fold change. Values represent means ± SD. Significant differences (P < 0.05) between different groups are indicated with different lowercase letters above the bars. CK: The zebrafish were fed a basic diet; B: The zebrafish were fed a basic diet supplemented with vitamin B12; ACK: The zebrafish treated with antibiotics for 7 days prior to administration of basic diet; AB: The zebrafish treated with antibiotics for 7 days prior to administration of B12; TCK: The zebrafish were fed a basic diet and then bath infected with A. hydrophila; TB: The zebrafish were fed a basic diet supplemented with vitamin B12 and then bath infected with A. hydrophila. TACK: The zebrafish treated with antibiotics for 7 days prior to administration of basic diet, and then fed a basic diet and then bath infected with A. hydrophila; TAB: The zebrafish treated with antibiotics for 7 days prior to administration of basic diet, and then fed a basic diet supplemented with vitamin B12 and then bath infected with A. hydrophila
Fig. 9
Fig. 9
Mechanisms of probiotic protection of the host against pathogen infections. Dietary supplementation with Bacillus velezensis BV1704-Y induces an increase in the abundance of the indigenous gut microbiota (Cetobacterium) and thus metabolizes sufficient amounts of vitamin B12. Vitamin B12 is used by the surrounding microbiota to form a more stable and complex gut ecological network while reducing the redox potential in the gut and maintaining the anaerobic state of the intestinal lumen, which further promotes the expression of intestinal tight junction proteins (Claudin15 and Zo-1) and prevents the infestation of Aeromonas

Similar articles

Cited by

References

    1. Qureshi A, Niazi JH. Biosensors for detecting viral and bacterial infections using host biomarkers: a review. Analyst. 2020;145(24):7825–7848. doi: 10.1039/D0AN00896F. - DOI - PubMed
    1. Hill C, Guarner F, Reid G, Gibson GR, Merenstein DJ, Pot B, et al. Expert consensus document: The International Scientific Association for Probiotics and Prebiotics consensus statement on the scope and appropriate use of the term probiotic. Nat Rev Gastroenterol Hepatol. 2014;11(8):506–14. doi: 10.1038/nrgastro.2014.66. - DOI - PubMed
    1. Sánchez B, Delgado S, Blanco-Míguez A, Lourenço A, Gueimonde M, Margolles A. Probiotics, gut microbiota, and their influence on host health and disease. Mol Nutr Food Res. 2017;61(1):1600240. doi: 10.1002/mnfr.201600240. - DOI - PubMed
    1. Maldonado-Gómez MX, Martínez I, Bottacini F, O’Callaghan A, Ventura M, van Sinderen D, et al. Stable engraftment of Bifidobacterium longum AH1206 in the human gut depends on individualized features of the resident microbiome. Cell Host Microbe. 2016;20(4):515–526. doi: 10.1016/j.chom.2016.09.001. - DOI - PubMed
    1. Suez J, Zmora N, Zilberman-Schapira G, Mor U, Dori-Bachash M, Bashiardes S, et al. Post-antibiotic gut mucosal microbiome reconstitution is impaired by probiotics and improved by autologous FMT. Cell. 2018;174(6):1406–1423.e1416. doi: 10.1016/j.cell.2018.08.047. - DOI - PubMed

Publication types

Supplementary concepts

LinkOut - more resources