. 2023 Jun 16;14(1):10.
doi: 10.1186/s13227-023-00214-y.

Feedback circuits are numerous in embryonic gene regulatory networks and offer a stabilizing influence on evolution of those networks

Affiliations

Feedback circuits are numerous in embryonic gene regulatory networks and offer a stabilizing influence on evolution of those networks

Abdull Jesus Massri et al. Evodevo. .

Abstract

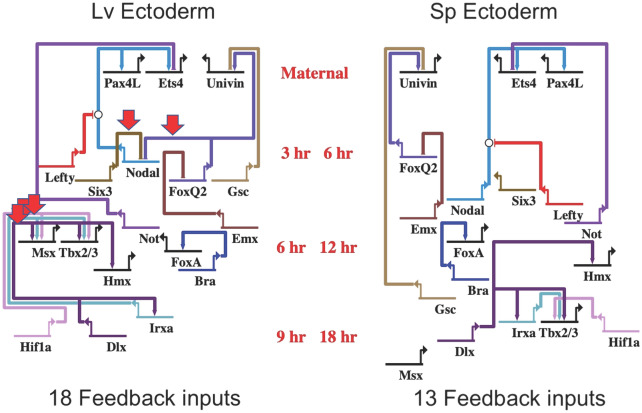
The developmental gene regulatory networks (dGRNs) of two sea urchin species, Lytechinus variegatus (Lv) and Strongylocentrotus purpuratus (Sp), have remained remarkably similar despite about 50 million years since a common ancestor. Hundreds of parallel experimental perturbations of transcription factors with similar outcomes support this conclusion. A recent scRNA-seq analysis suggested that the earliest expression of several genes within the dGRNs differs between Lv and Sp. Here, we present a careful reanalysis of the dGRNs in these two species, paying close attention to timing of first expression. We find that initial expression of genes critical for cell fate specification occurs during several compressed time periods in both species. Previously unrecognized feedback circuits are inferred from the temporally corrected dGRNs. Although many of these feedbacks differ in location within the respective GRNs, the overall number is similar between species. We identify several prominent differences in timing of first expression for key developmental regulatory genes; comparison with a third species indicates that these heterochronies likely originated in an unbiased manner with respect to embryonic cell lineage and evolutionary branch. Together, these results suggest that interactions can evolve even within highly conserved dGRNs and that feedback circuits may buffer the effects of heterochronies in the expression of key regulatory genes.

Keywords: Embryonic specification; Evolutionary mechanism; Feedback circuits; Gene regulatory networks; Sea urchin development.


Conflict of interest statement

The authors declare no competing interests.

Figures

Fig. 1
Fig. 1
Evolutionary changes in a hypothetical Gene Regulatory Network (GRN). The consequences of altering an interaction within a GRN can differ enormously, depending on local context. Here, ovals represent genes and arrows represent the activity of that gene product as transcriptional activation (—>) or inhibition ( -|) of another gene. Altering a connection near the beginning of the GRN (red arrow) is more likely to have widespread effects than a connection that involves a single gene at the periphery of the network (blue arrow). Genes encoding regulators near the periphery are in a position to alter functionally related sets of genes in a coordinated manner (gold arrows) that might change a single trait without altering others. Interactions that provide feedback inhibition (purple arrow) or feedback activation can stabilize expression if changes evolve elsewhere in the GRN
Fig. 2
Fig. 2
Classic and updated dGRNs of the endoderm of Sp. On the left is the classic model of the endoderm dGRN using the graphic program BioTapestry [61] (modified after [26]). On the right is an updated version of that GRN with each gene placed along the time line from top to bottom to reflect its time of first expression. Time of first expression is from [37]. Note, when timing is considered, the early specification of endoderm is largely compressed into a 7-h period of the first 24 h of development
Fig. 3
Fig. 3
Time of first transcription of 81 genes in Sp vs Lv. The time of transcriptional activation of Sp is recorded along the X axis and time of gene activation of Lv along the Y axis. (The Lv times are doubled to normalize developmental progression based on temperature differences in culture.) The black circles are genes that are expressed at the same time (within ± 2 h) in both species, given that allowance for temperature normalization. The circles above or below the gray area on either side of the diagonal line represent genes that are heterochronically expressed between the two species. Those circles above the line are genes that are activated earlier in Sp, relative to time of activation in Lv. Circles below the line represent genes that are activated earlier in Lv relative to Sp. The circle at 0,0 represents 20 genes that are expressed maternally in both species. The gray box represents 2 h above and below the diagonal line. Genes within that box are considered to be expressed at the same developmental times in both species allowing for natural variation and/or sensitivity of detection to account for deviations from the diagonal line
Fig. 4
Fig. 4
Mesodermal dGRNs of Lv and Sp reflecting time of first expression. Edges (positive or negative inputs to other genes) are unchanged from the large bank of perturbation data that established the dGRNs. Time of development is shown in red to the side of each dGRN. Maternally expressed genes are in the gray area at the top. Early specification is in green, and later the mesoderm is subdivided into ventral and dorsal GRNs as a consequence of Nodal signaling [62]
Fig. 5
Fig. 5
Inferred feedback inputs in Lv and Sp ectoderm during the first 9 and 18 h of specification. Based on time of first expression recorded in Additional file 5: Table S1, the feedback inputs emerged for every gene that had an experimentally based input into the regulation of a gene first expressed earlier. In comparing the two species most feedback inputs are conserved (13/18) though several feedbacks differ because of heterochronic shifts in gene expression (red arrows). Heterochronic shifts in expression of foxQ2, six3, and msx account for a difference of 5 feedback inputs between the two ectoderm dGRNs

Similar articles

Cited by

References

    1. Carroll SB, Grenier JK, Weatherbee SD. From DNA to diversity. Malden: Blackwell; 2001.
    1. Wilkins AS. The evolution of developmental pathways. Sunderland: Sinauer Associates; 2002.
    1. The DE, Genome R. Gene regulatory networks in development and evolution. San Diego: Academic Press/Elsevier; 2006. p. 289.
    1. Erwin DH, Davidson EH. The evolution of hierarchical gene regulatory networks. Nat Rev Genet. 2009;10(2):141–148. doi: 10.1038/nrg2499. - DOI - PubMed
    1. Wittkopp PJ, Williams BL, Selegue JE, Carroll SB. Drosophila pigmentation evolution: divergent genotypes underlying convergent phenotypes. Proc Natl Acad Sci U S A. 2003;100(4):1808–1813. doi: 10.1073/pnas.0336368100. - DOI - PMC - PubMed

LinkOut - more resources