Review
. 2022 Feb 15;2(2):20210239.
doi: 10.1002/EXP.20210239. eCollection 2022 Apr.

Electrolyte formulation strategies for potassium-based batteries

Affiliations
Review

Electrolyte formulation strategies for potassium-based batteries

Ling Ni et al. Exploration (Beijing). .

Abstract

Potassium (K)-based batteries are viewed as the most promising alternatives to lithium-based batteries, owing to their abundant potassium resource, lower redox potentials (-2.97 V vs. SHE), and low cost. Recently, significant achievements on electrode materials have boosted the development of potassium-based batteries. However, the poor interfacial compatibility between electrode and electrolyte hinders their practical. Hence, rational design of electrolyte/electrode interface by electrolytes is the key to develop K-based batteries. In this review, the principles for formulating organic electrolytes are comprehensively summarized. Then, recent progress of various liquid organic and solid-state K+ electrolytes for potassium-ion batteries and beyond are discussed. Finally, we offer the current challenges that need to be addressed for advanced K-based batteries.

Keywords: fundamentals of organic electrolytes; liquid electrolytes; potassium‐based batteries; solid‐state electrolytes.


Conflict of interest statement

There are no conflicts to declare.

Figures

FIGURE 1
FIGURE 1
Classifications and characteristics of K‐based batteries
FIGURE 2
FIGURE 2
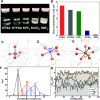
(A) Photograph of mixtures of 0.5 M electrolytes with KFSI, KTFSI, KPF6, KBF4, and KClO4 in PC. (B) Ionic conductivities of the prepared electrolytes at 25°C. Reproduced with permission.[ 23 ] Copyright 2018, RSC. The solvation structures of (C) Li+, (D) Na+, and (E) K+ in EC. (F) The oxygen coordination number in the first solvation shell of Li+, Na+, and K+ ions. (G) Comparison of solvation energies (ΔE sol) of Li+, Na+, and K+ ions. Reproduced with permission.[ 6 ] Copyright 2017, ACS
FIGURE 3
FIGURE 3
(A) The anode and cathode potential range of electrolyte. Reproduced with permission.[ 33 ] Copyright 2008, RSC. (B) Comparison of LUMO energy level changes between the ion‐solvent complexes and pure solvents. Reproduced with permission.[35a] Copyright 2018, Wiley. (C–E) C 1s, (F–H) F 1s, and (I–K) S 1s HAXPES spectra of the hard carbon electrodes in (C, F, I) Li, (D, G, J) Na, and (E, H, K) K cells with 1 M AFSI/PC (A = Li, Na, and K) electrolyte. TOF‐SIMS positive ion spectra of the hard carbon electrodes after 10 cycles in (L) Li, (M) Na, and (N) K cells. Reproduced with permission.[ 39 ] Copyright 2020, ACS. (O) Electrochemical impedance spectroscopy of symmetrical alkali‐metal cells. Reproduced with permission.[ 42 ] Copyright 2017, Elsevier
FIGURE 4
FIGURE 4
Comparison of (A) cycling performance and (B) coulombic efficiency of graphite anodes in KPF6 based EC/PC, EC/DEC, and EC/DMC electrolytes. Reproduced with permission.[ 58 ] Copyright 2016, Wiley. (C) Cycling performance curves of RP/C anodes in different electrolytes at current density of 50 mA g−1 (D) Solvation energies of solvated K+‐solvent complexes. Reproduced with permission.[ 60 ] Copyright 2019, Wiley. (E) The possible adsorption sites for K+ in surfaces of (110)@DME, (110)@PC, (110)@EC, and (110)@, respectively. Reproduced with permission.[ 61 ] Copyright 2020, Wiley
FIGURE 5
FIGURE 5
Schematically illustrating the work mechanism and disadvantage of rechargeable potassium‐based batteries: (A) K‐ion, (B) K metal batteries, (C) K‐S/Se, and (D) K‐O2. Reproduced with permission.[ 82 ] Copyright 2018, Wiley
FIGURE 6
FIGURE 6
(A) The charge–discharge curve of graphite at C/10. (B) XRD patterns of graphite corresponding to the marked potential in (A). (C) Structure diagrams of different potassium graphite intercalation compounds. (D) Rate performance and (E) cycle performance of graphite at 0.5 C. Reproduced with permission.[81b] Copyright 2015, RSC
FIGURE 7
FIGURE 7
(A) Schematic of reversible K+‐solvent co‐intercalation in graphite. (B) Typical charge/discharge curves of graphite electrode based on 1 M KCF3SO3 DEGDME electrolyte. (C) Rate and (D) cycling performance of the graphite electrode. Reproduced with permission.[ 117 ] Copyright 2020, Wiley. Electrochemical performance of graphite for potassium storage. (E) Cycling performance of graphite in two different electrolytes. (F,G) Charge–discharge profiles of graphite with 0.8 M KPF6 in EC/EMC electrolyte or KFSI/EMC electrolyte. (H) Cycle performance of graphite with different area mass loading in KFSI based electrolyte. (I) Area capacity of graphite calculated from the theoretical and experimental results. Reproduced with permission.[ 118 ] Copyright 2019, Wiley
FIGURE 8
FIGURE 8
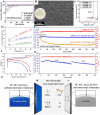
(A) Cycle performance of the graphite electrode based on three different electrolytes, with the inset figures indicating the fire retardance of TMP based electrolyte. (B) SEM image, with the insets showing the SAED and XRD patterns of graphite after 1000 cycles. (C) Rate performance of graphite in three different electrolytes. (D) Cycle performance of graphite||PTCDA full cell TMP based electrolyte at 20 mA g−1, with the inset displaying the corresponding first and second cycle charging–discharging profiles. (E) XPS fitting curves of the graphite surfaces after cycling. (F) Solvation ratios, numbers of TMP with K+, and total numbers of TMP molecules per K+ ion at different molar ratios. Reproduced with permission.[ 57 ] Copyright 2021, Wiley. (G) Comparative first (dis‐)charge curve of graphite electrode in the electrolyte of 1.0 M KFSI in TMP with and without DTD. (H) Rate capability of graphite electrode in the electrolyte with 6 wt% DTD. Reproduced with permission.[ 77 ] Copyright 2020, Wiley
FIGURE 9
FIGURE 9
(A) cycling performance of K metal in KFSI/DME electrolytes. (B) SEM imaging of the plated K in KFSI/DME electrolyte. (C) Electrochemical stability of KFSI/DME electrolytes. Reproduced with permission.[ 126 ] Copyright 2017, RSC. (D) Ionic conductivities of the buffered K‐Cl‐IL, 0.9 M KPF6 in EC/DEC (1/1), and 0.5 M KTFSI in Py13TFSI IL at 8, 22, and 50°C. (E) Cycling performances of K metal‐KMCFC@rGO batteries using in K‐Cl‐IL and organic electrolytes at 100 mA g−1 with cycling at 50 mA g−1 for five cycles at first marked by the dashed rectangle. (F) Charge/discharge curves of K metal‐KMCFC@rGO battery running at 22 and 50°C. Current density, 100 mA g−1. (G) Cycle performance of K metal‐KMCFC@rGO battery at 50 and 60°C. Current density, 100 mA g−1. (H) Schematic diagram of the battery configuration, electrolyte composition, and SEI component. Reproduced with permission.[ 127 ] Copyright 2020, NAS
FIGURE 10
FIGURE 10
(A,B) AFM images of polished K surface. (C) Voltage profiles of symmetric polished K cells. Reproduced with permission.[ 130 ] Copyright 2018, Springer Nature
FIGURE 11
FIGURE 11
(A) The plating/striping behavior of potassium in a coin cell with the polymer‐gel electrolyte at 1.0 mV s−1. (B) Ionic conductivity of the PMMA polymer‐gel electrolyte with temperature. (C) LSV plot of PMMA at 1.0 mV s−1. (D) Charge/discharge curves of the polyaniline cathode at 10 mA g−1. (E) Cycle performance of the polyaniline cathode at 50 mA g−1. (F) Rate performance of the polyaniline cathode ranging from 10 to 200 mA g−1. Reproduced with permission.[ 132 ] Copyright 2018, Wiley
FIGURE 12
FIGURE 12
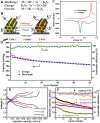
(A) Discharge, charge, and overall reaction. (B) Schematic diagram of K‐S batteries with CMK‐3/sulfur electrode. (C) Corresponding differential capacity plots of S cathode. (D) Cycling performance and coulombic efficiency at 50 mA g–1. Reproduced with permission.[135a] Copyright 2014, RSC. (E) Discharge/charge profiles of the KǁCelgard/SWCNTǁS/CNF cells at various rates. (F) Cycling performance and CE with cycle number for the KǁCelgard/SWCNTǁS/CNF cells and the KǁCelgardǁS/CNF cell. Reproduced with permission.[ 138 ] Copyright 2018, Elsevier
FIGURE 13
FIGURE 13
(A,B) First‐cycle discharge/charge profiles of K‐S batteries at 10 mA g−1. (C) “Transparent” batteries capture the polysulfide shuttle behaviors. (D)Voltage profile at 5 mA g−1. (E) Ex‐situ XRD patterns. (F) Schematic showing the reaction mechanism interpreted by XRD analysis. Elsevier. Reproduced with permission.[ 139 ] Copyright 2019, Elsevier
FIGURE 14
FIGURE 14
(A) Reaction mechanism of c‐PAN‐Se. (B) Rate capabilities of c‐PAN‐Se. (C) Cycle performance of c‐PAN‐Se at 5 C. (D) HEXRD pattern of c‐PAN‐Se. (E) Raman spectroscopic analysis of c‐PAN‐Se. (F) Structural diagram of the Se and K2Se structures. Reproduced with permission.[ 141 ] Copyright 2017, Elsevier
FIGURE 15
FIGURE 15
(A) In situ Raman analysis of the Se@NPCFs in the K‐Se batteries at different voltages. (B,C) Ex situ HRTEM images of the Se@NPCFs electrode from the left discharge/charge curve at different states. (D) Formation energies of existing potassiation selenides by theoretical calculations. Reproduced with permission.[ 142 ] Copyright 2020, Wiley. (E) Voltage curves of the K‐Se batteries in 1, 3, and 5 M electrolytes. (F) Cycle performance of the K‐Se batteries in 5 M electrolytes. Reproduced with permission.[ 143 ] Copyright 2020, ACS
FIGURE 16
FIGURE 16
(A) The first two continuous battery discharge–charge cycles at 0.16 mA cm−2 current density. Reproduced with permission.[ 146 ] Copyright 2013, RSC. (B) Discharge/charge profiles of K‐O2 batteries with a Nafion‐K+ membrane. Reproduced with permission.[ 147 ] Copyright 2014, ACS. (C) The stability test of K metal with pure tetraglyme and 1 m KTFSI in tetraglyme under Ar after one month. (D,E) Cross‐section SEM of the K anode in K‐O2 battery with 1 M KPF6, and 1 M KTFSI based DME electrolyte, respectively. (F) Voltage curves of K‐O2 battery with 1 M KTFSI based DME electrolyte. Reproduced with permission.[ 148 ] Copyright 2017, Wiley. (G) Voltage curves of K‐O2 battery with the modified K anode. (H) Cycle performance of K‐O2 cells with pristine and modified K metal anodes (cycling capacity: 0.056 mAh cm−2). Reproduced with permission.[ 149 ] Copyright 2018, Wiley. (I) Voltage curves of DMSO‐based K‐O2 batteries. Reproduced with permission.[ 150 ] Copyright 2018, Wiley
FIGURE 17
FIGURE 17
(A) ‘Log σ–x’ curve for the SPEs. Reproduced with permission.[ 152 ] Copyright 2016, RSC. (B) Ionic conductivity of the Poly (propylene carbonate) (PPC/KFSI) electrolyte with increasing concentration of KFSI. (C) CV measurement of K metal ǁ stainless steel cell in the PPC/KFSI electrolyte. (D) The LSV curves for the PPC/KFSI electrolyte. (E) Charge/discharge curves of PTCDA with PPC/KFSI electrolyte at 10 mA g−1. The inset image is the schematic diagram for the reaction mechanism of PTCDA cathode in PIBs. (F) Cycle performance of PTCDA with different electrolytes at 20 mA g−1. The inset digital image shows the solubility of PTCDA. Reproduced with permission.[ 154 ] Copyright 2018, Elsevier. (G) Images of flexible self‐supporting membrane. (H) Charge/discharge curves of PIBs with PEO/KFSI solid electrolyte at 25 mA g−1. (I) Cycle performance of Ni3S2@Ni electrode with PEO/KFSI and organic electrolyte at 25 mA g−1. Reproduced with permission.[ 155 ] Copyright 2019, Elsevier
FIGURE 18
FIGURE 18
(A) Arrhenius plot of K‐ and Na‐BASE conductors. (B) Rate capability of a K‐S cell at 150°C (cell active area: 3 cm2). (C) Cycle performance and CEs of a K‐S cell. Reproduced with permission.[ 172 ] Copyright 2015, Wiley. (D) 2D layer composed of FeO6 octahedra, and FeO4 tetrahedra with 1D 3‐ring channels. (E) CV measurement of the K/K2Fe4O7/Pt cell. (F) Cycle performance of K||K2Fe4O7||PBA battery at 10 C. (G) 3D open framework structure of K2Fe4O7 viewed along b‐axis. Reproduced with permission.[ 175 ] Copyright 2018, RSC. (H) Crystal structure of K2Mg2TeO6 along c‐axis: Mg, Te, K, O are shown by purple, blue, brown red. (I) Arrhenius plot of K2Mg2TeO6. Reproduced with permission.[ 168 ] Copyright 2018, Springer Nature

References

    1. Zeng X., Li M., El‐Hady D. A., Alshitari W., Al‐Bogami A. S., Lu J., Amine K., Adv. Energy Mater. 2019, 9, 1900161.
    1. Zhang W., Liu Y., Guo Z., Sci. Adv. 2019, 5, 7412. - PMC - PubMed
    1. a) Liu P., Wang Y., Hao H., Basu S., Feng X., Xu Y., Boscoboinik J. A., Nanda J., Watt J., Mitlin D., Adv. Mater. 2020, 32, 2002908; - PubMed
    2. b) Li J., Gao W., Huang L., Jiang Y., Chang X., Sun S., Pan L., Appl. Surf. Sci. 2022. 571, 151307.
    1. Matsuura N., Umemoto K., Takeuchi Z. i., Bull. Chem. Soc. Jpn. 1974, 47, 813.
    1. Matsuda Y., Nakashima H., Morita M., Takasu Y., J. Electrochem. Soc. 1981, 128, 2552.

LinkOut - more resources