

Using mercury stable isotope fractionation to identify the contribution of historical mercury mining sources present in downstream water, sediment and fish
- PMID: 37323923
- PMCID: PMC10269370
- DOI: 10.3389/fenvc.2023.1096199
Using mercury stable isotope fractionation to identify the contribution of historical mercury mining sources present in downstream water, sediment and fish
Abstract
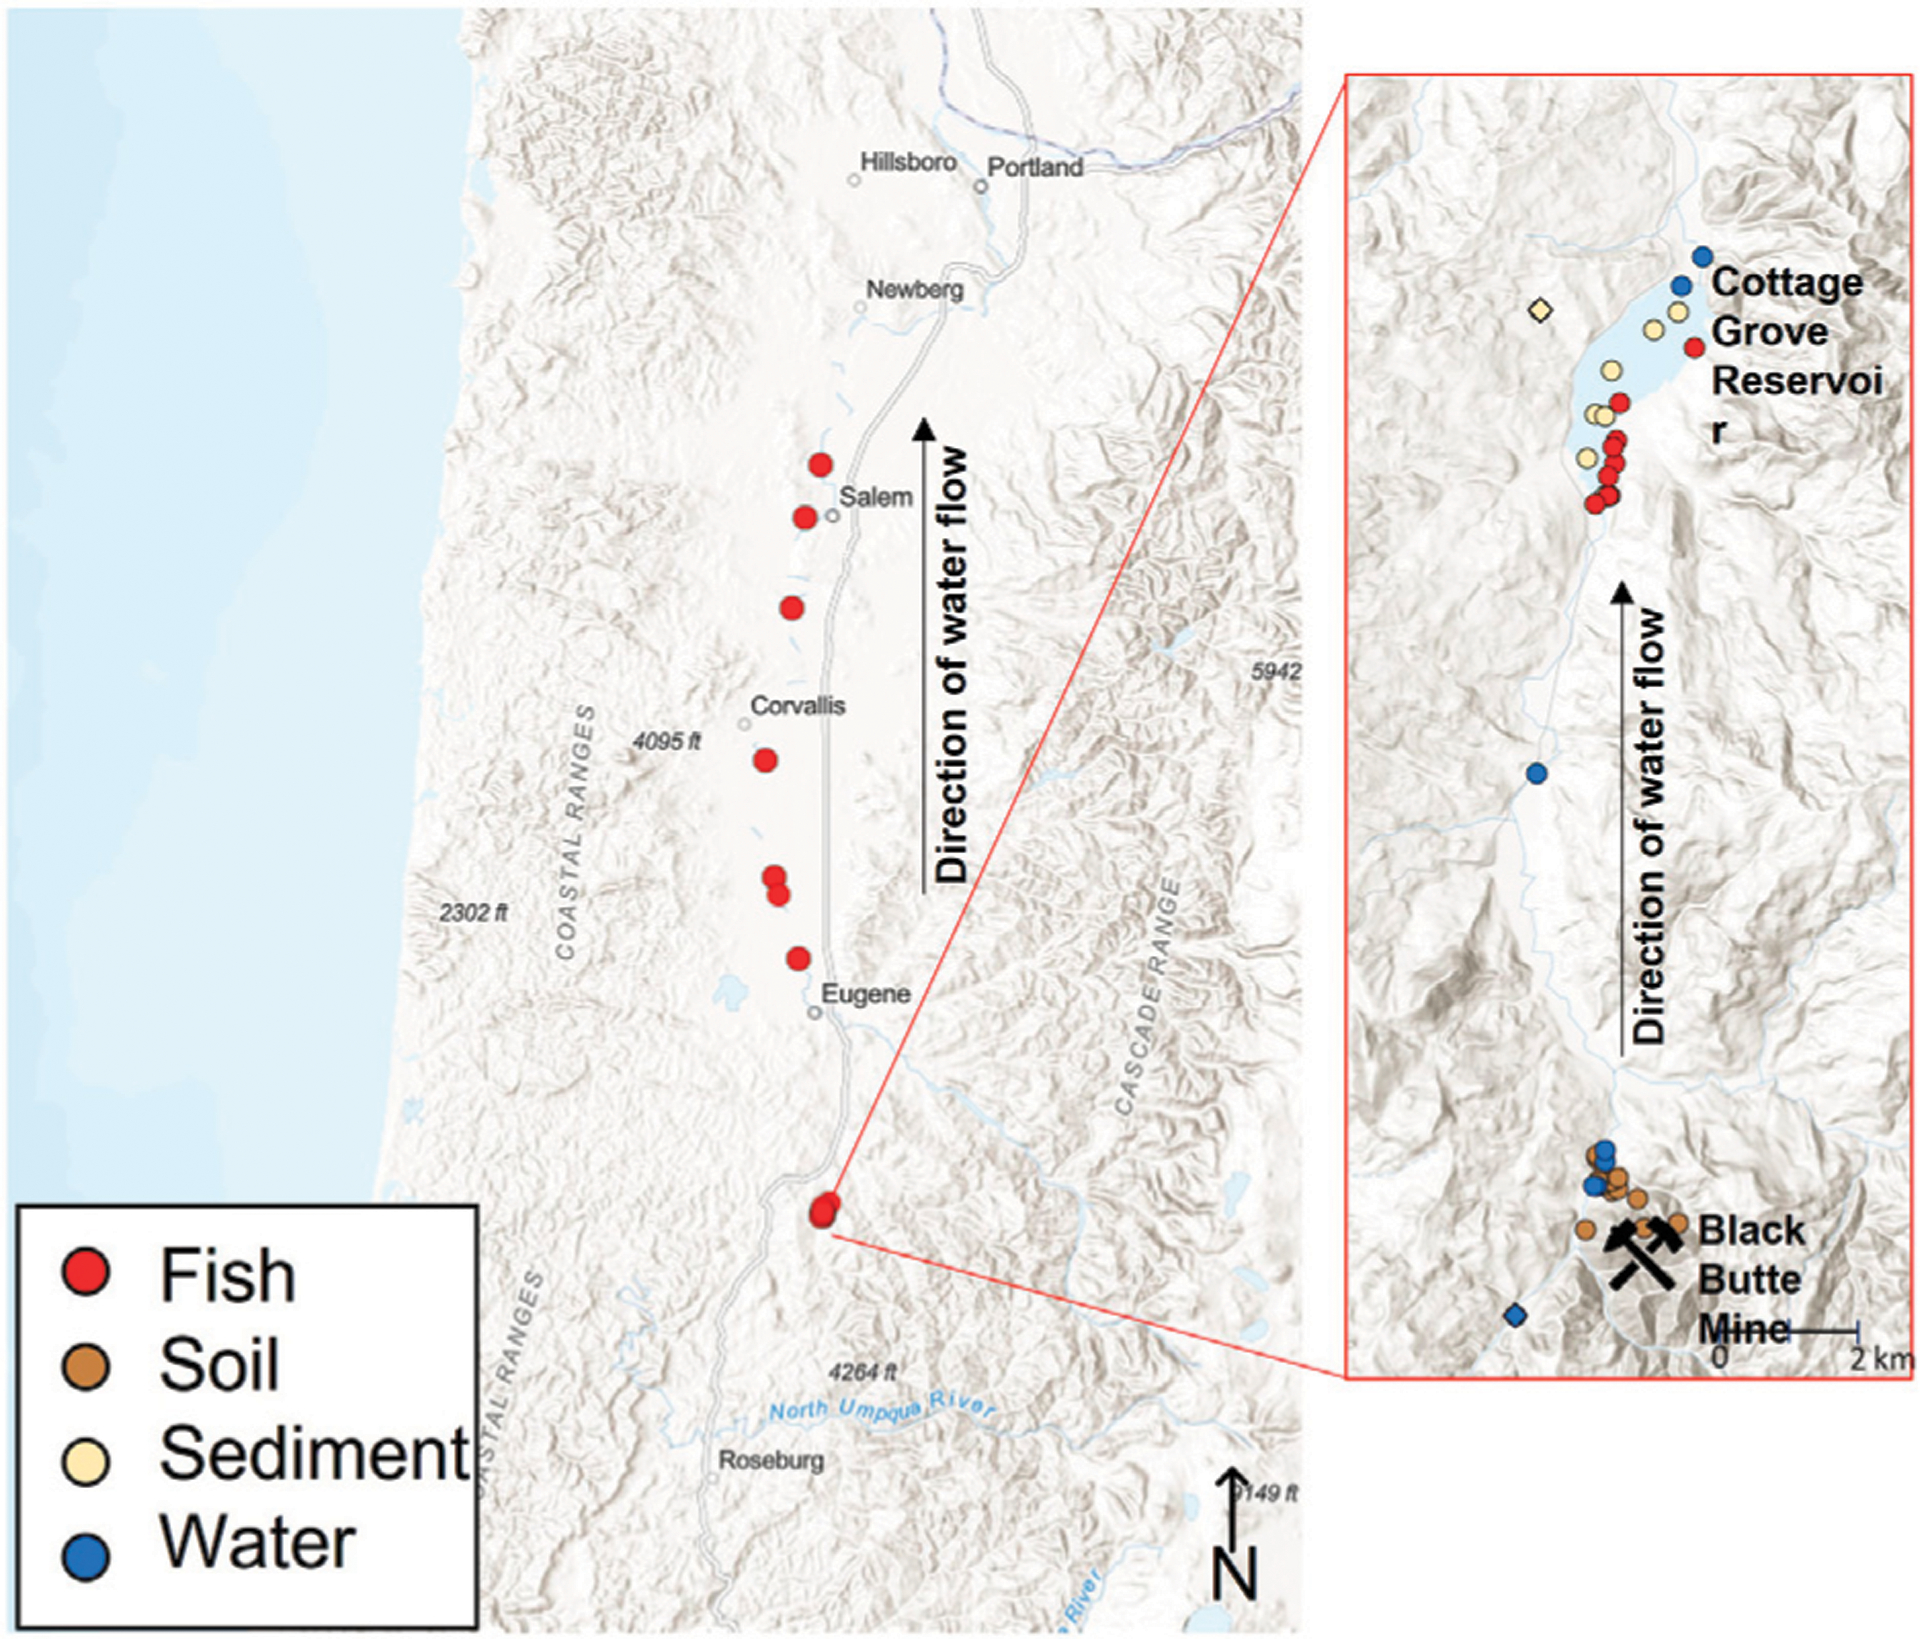
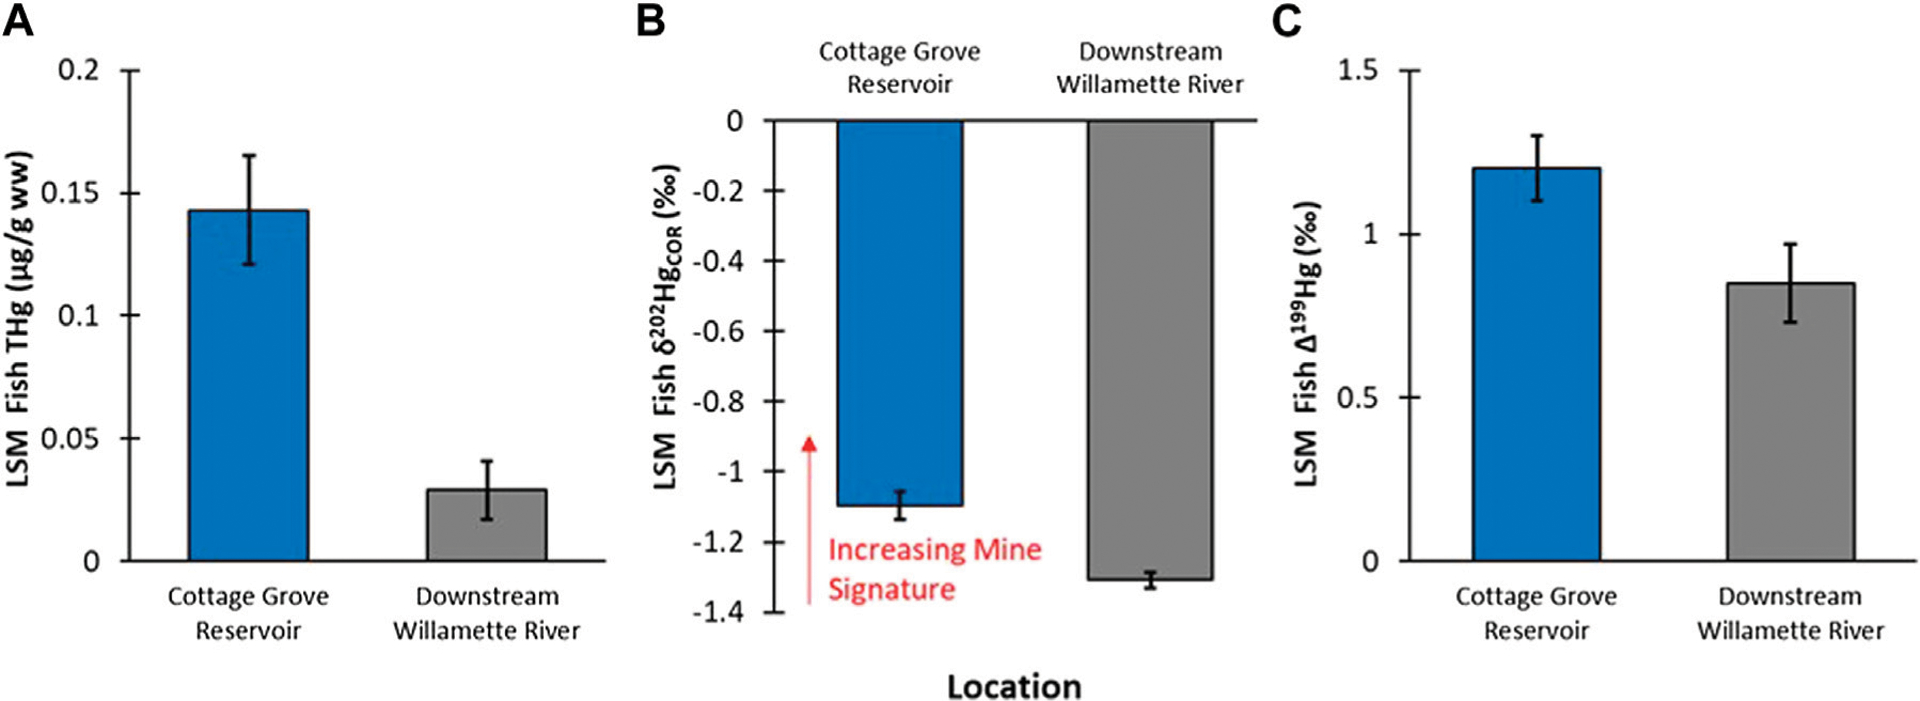
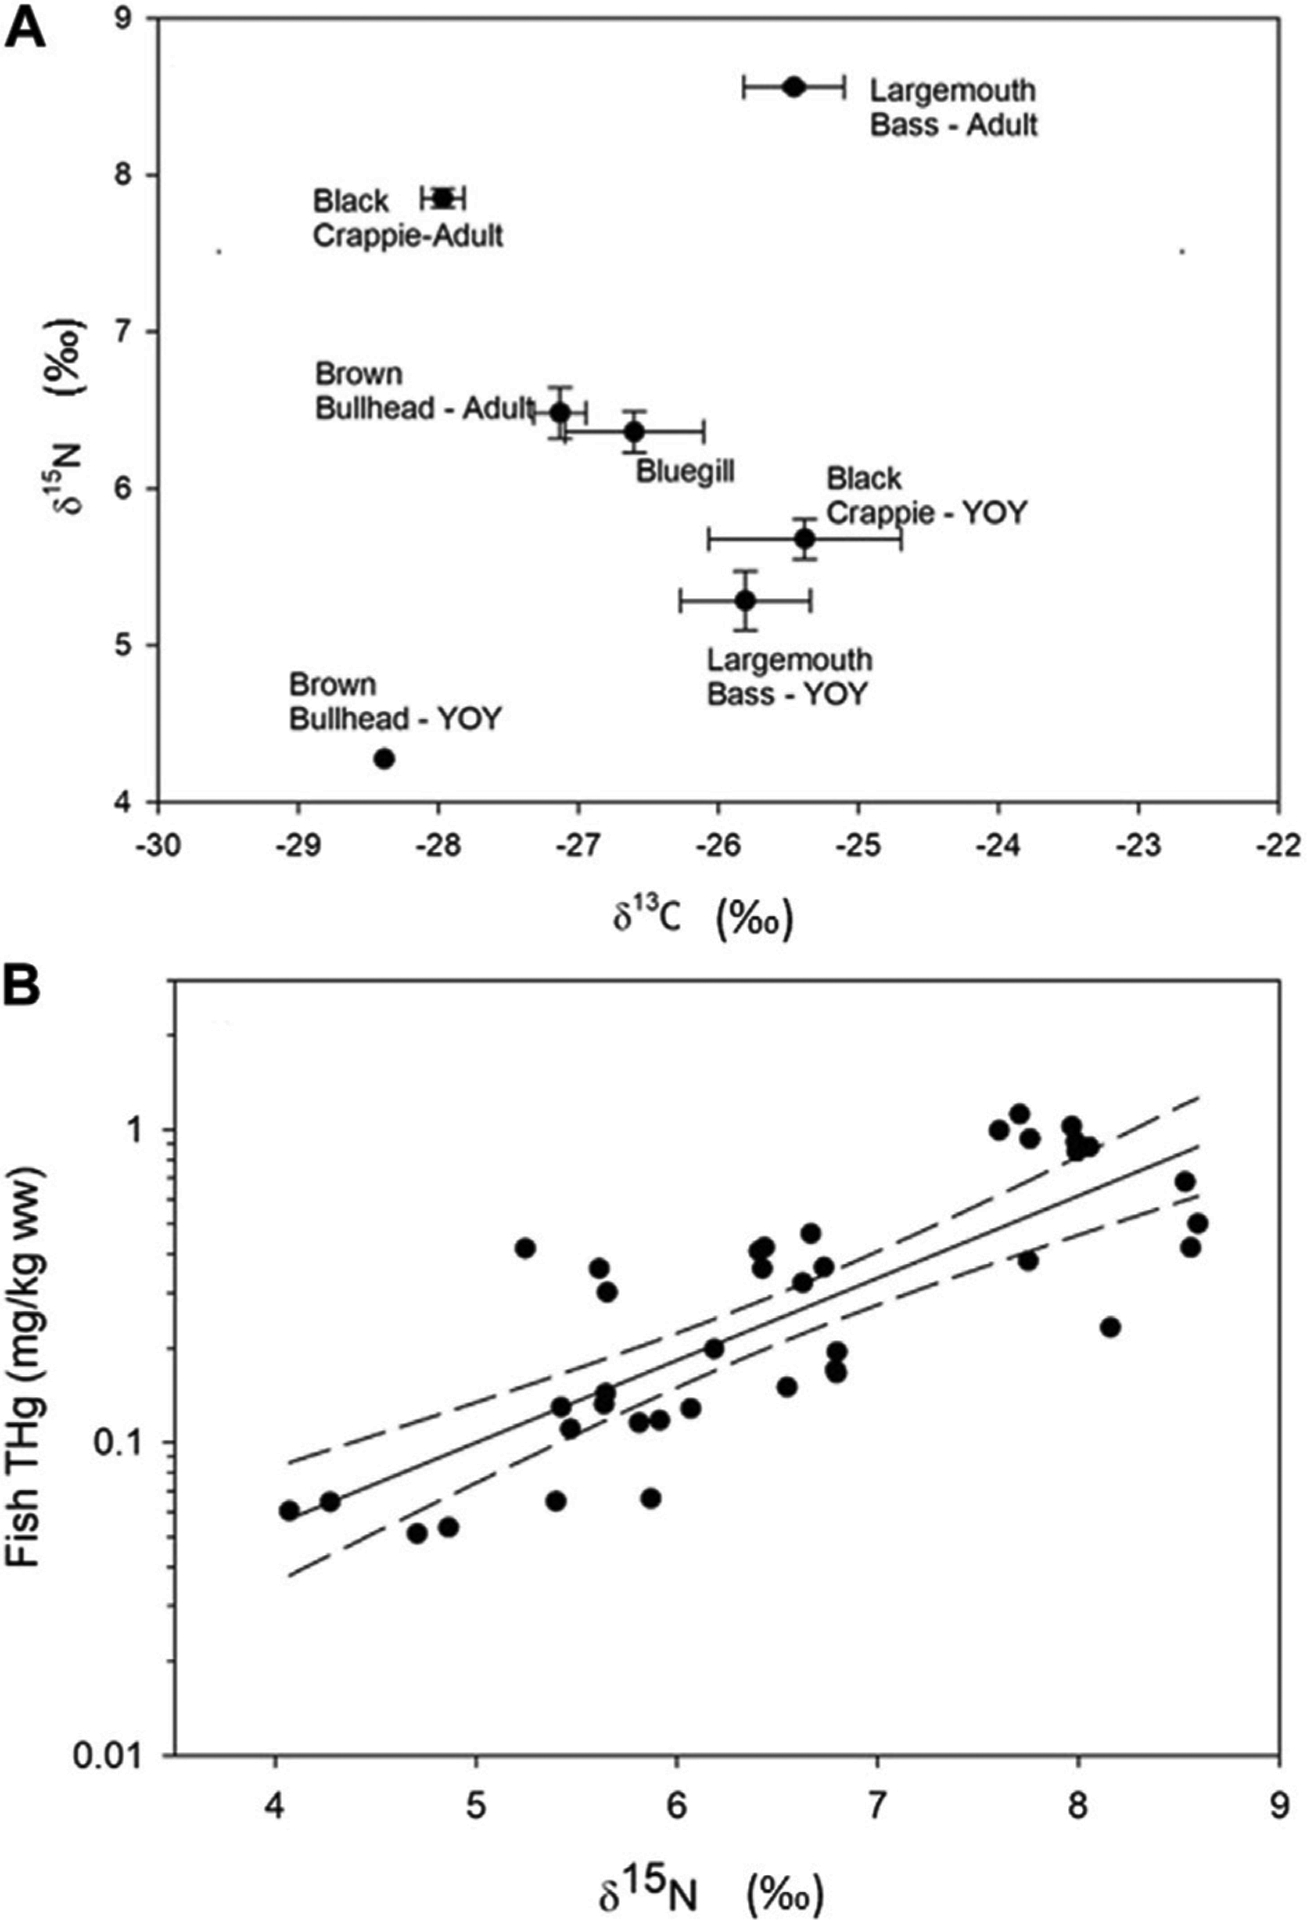
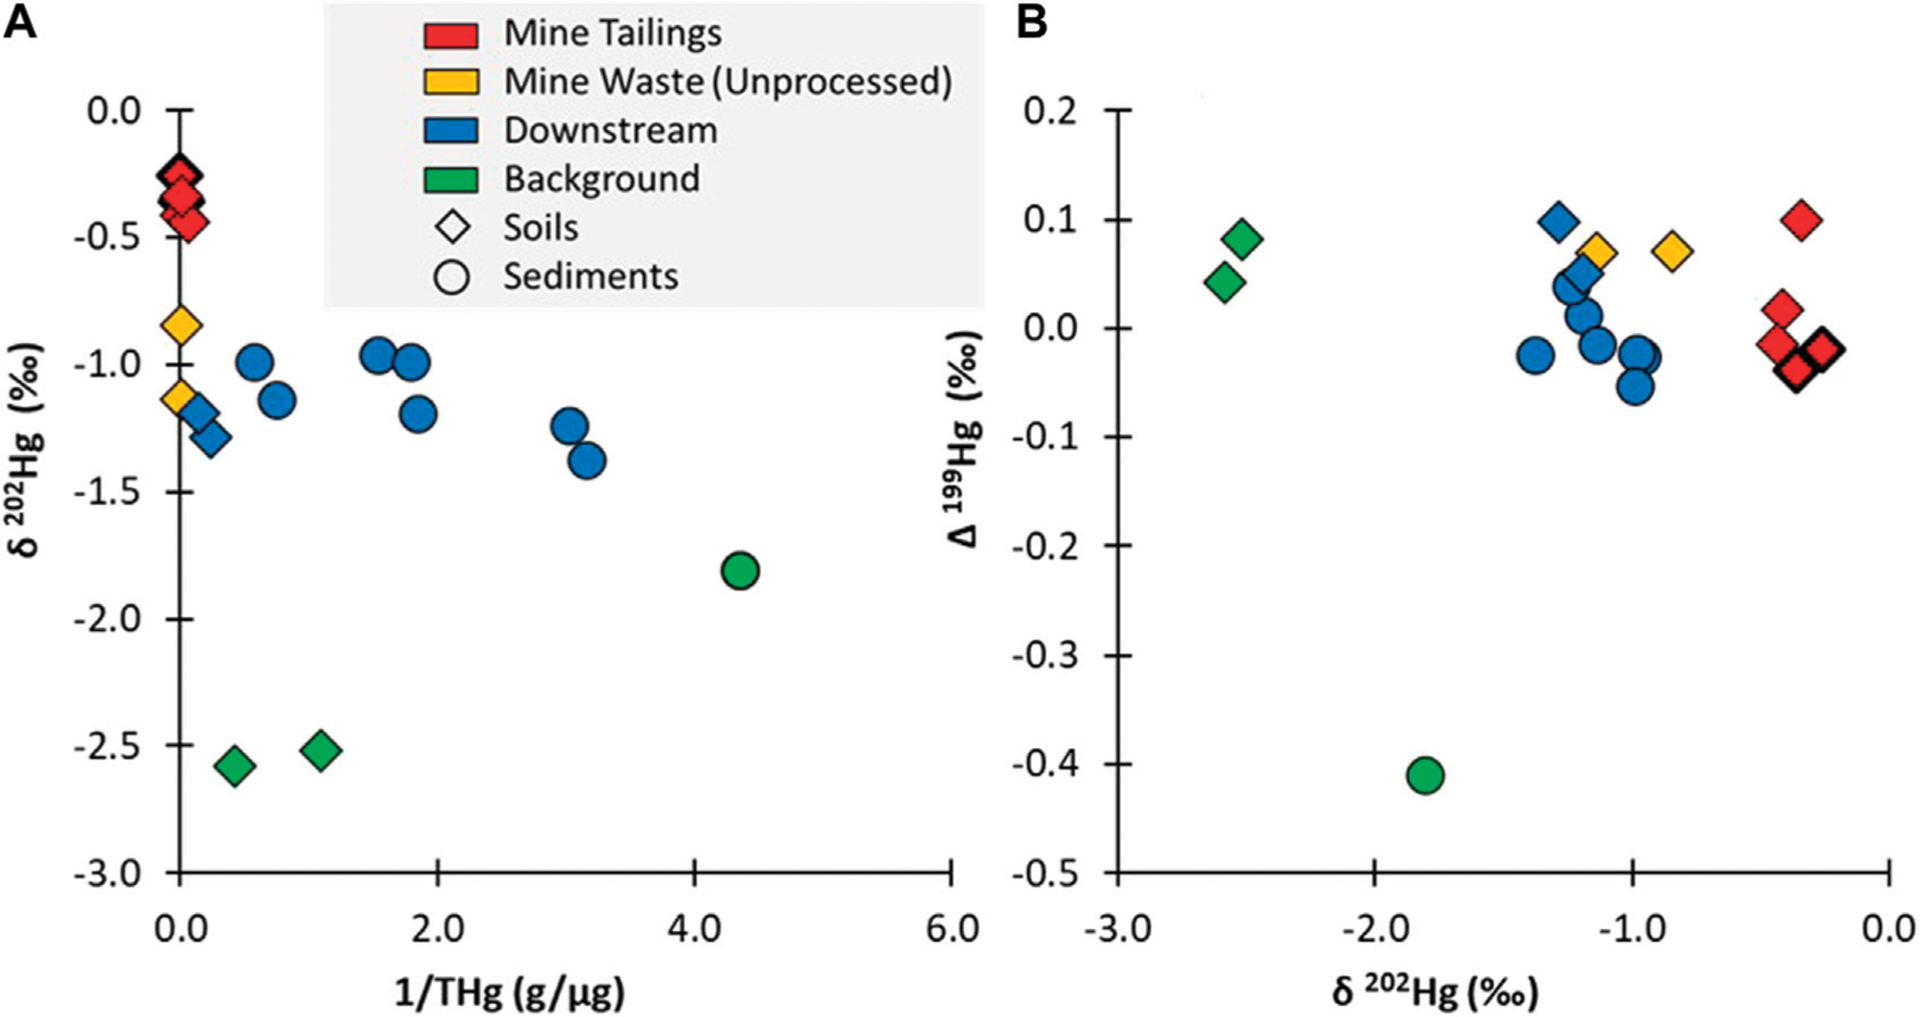
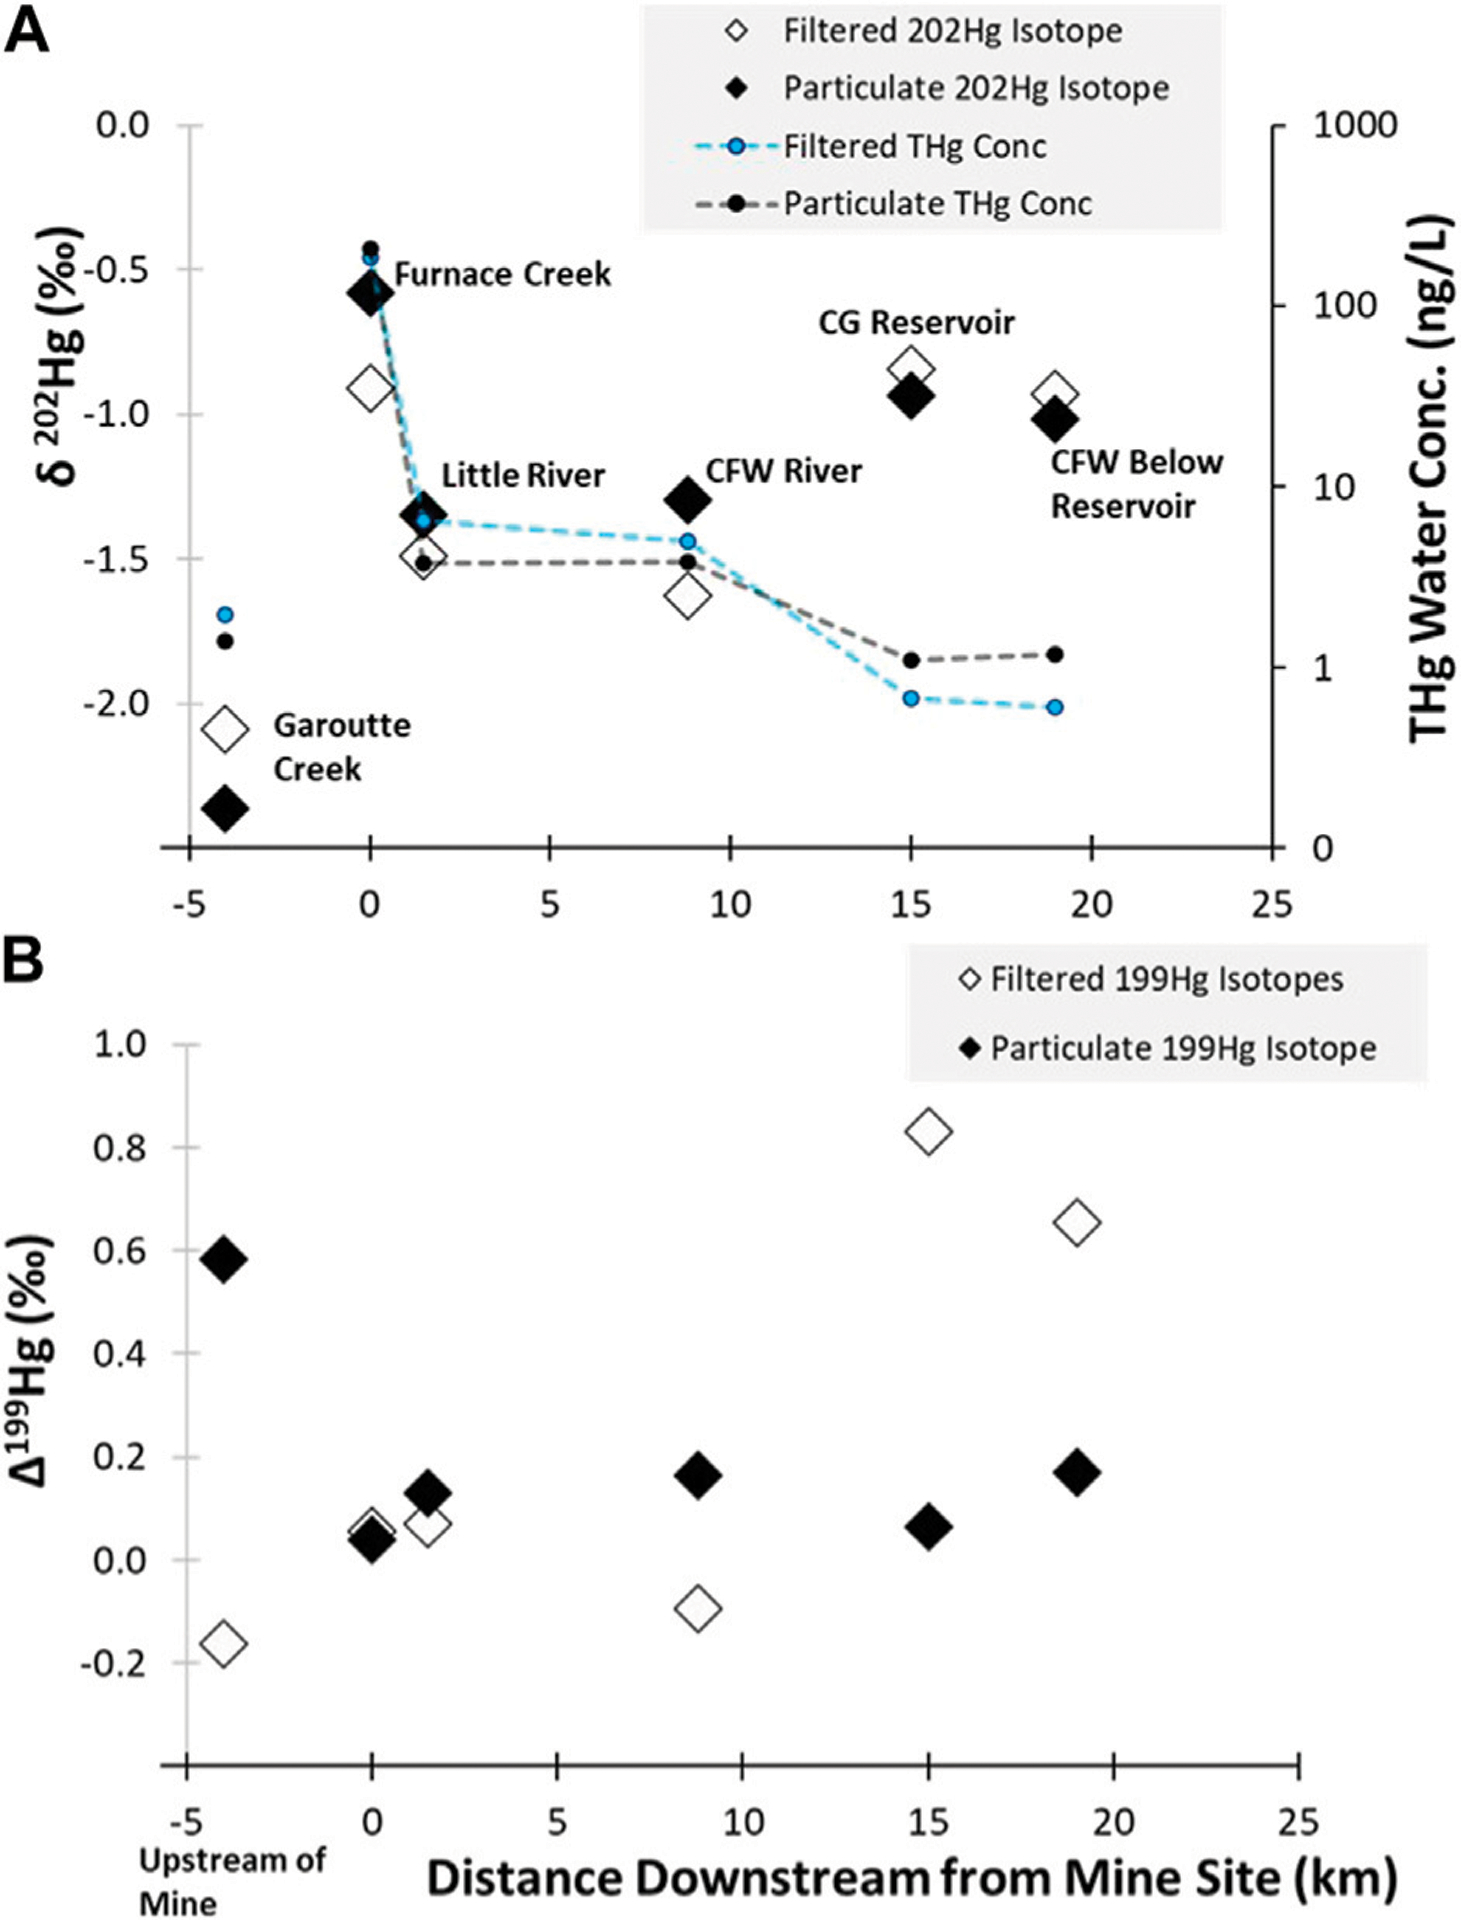
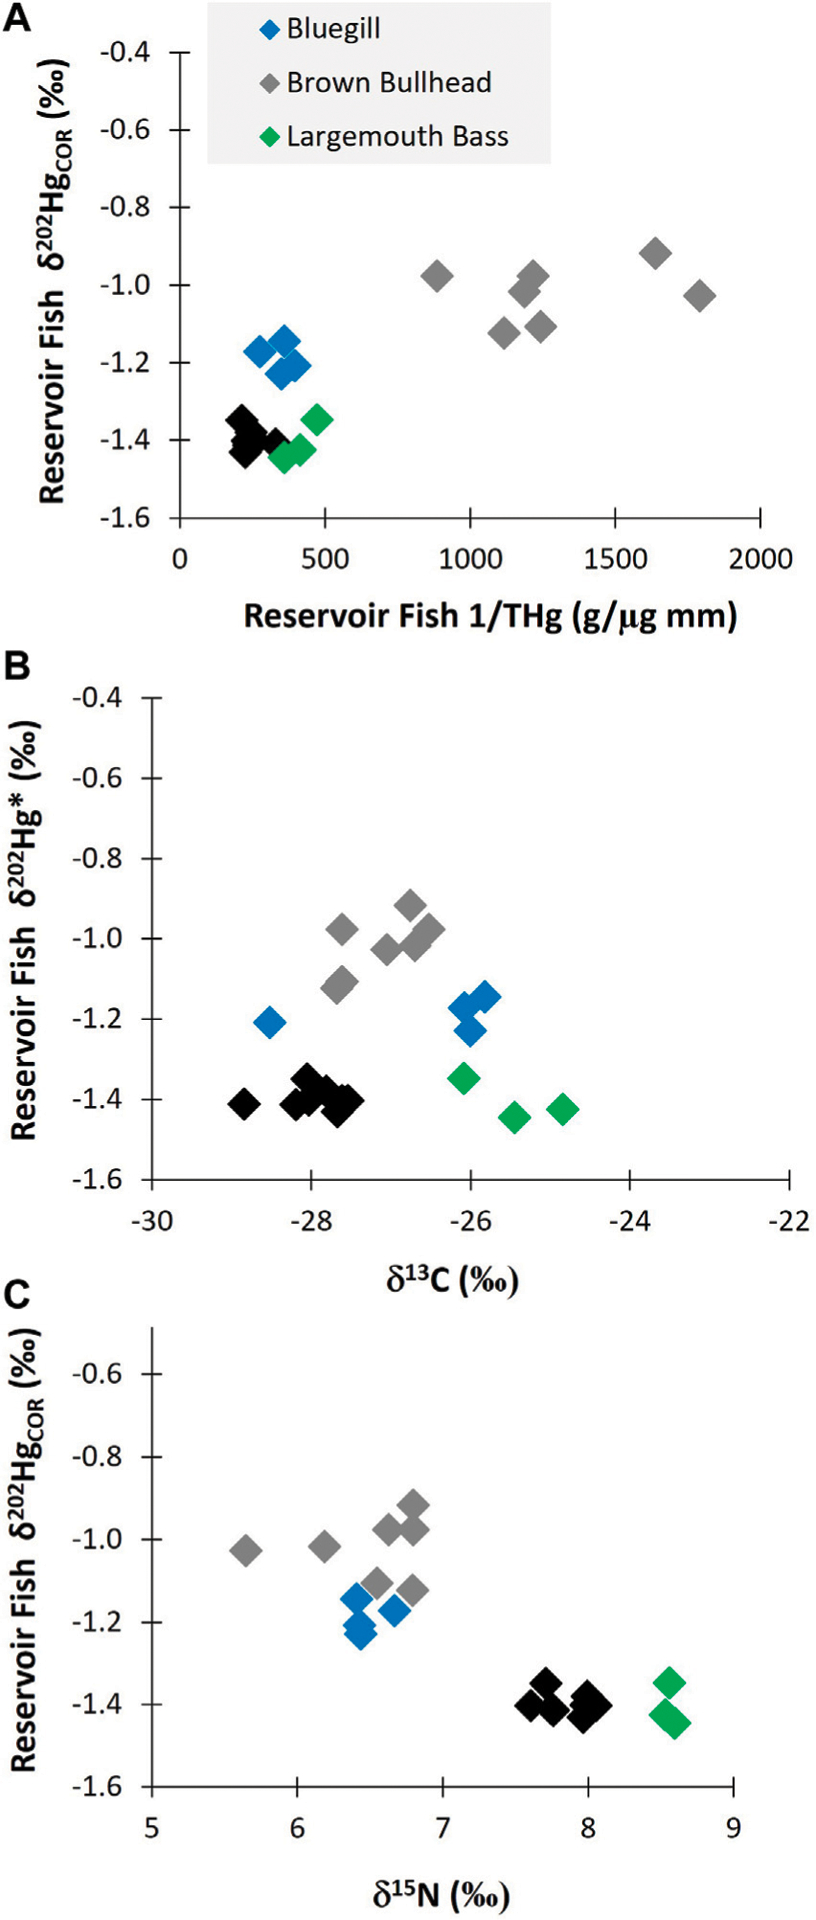
Ecosystems downstream of mercury (Hg) contaminated sites can be impacted by both localized releases as well as Hg deposited to the watershed from atmospheric transport. Identifying the source of Hg in water, sediment, and fish downstream of contaminated sites is important for determining the effectiveness of source-control remediation actions. This study uses measurements of Hg stable isotopes in soil, sediment, water, and fish to differentiate between Hg from an abandoned Hg mine from non-mine-related sources. The study site is located within the Willamette River watershed (Oregon, United States), which includes free-flowing river segments and a reservoir downstream of the mine. The concentrations of total-Hg (THg) in the reservoir fish were 4-fold higher than those further downstream (>90 km) from the mine site in free-flowing sections of the river. Mercury stable isotope fractionation analysis showed that the mine tailings (δ202Hg: -0.36‰ ± 0.03‰) had a distinctive isotopic composition compared to background soils (δ202Hg: -2.30‰ ± 0.25‰). Similar differences in isotopic composition were observed between stream water that flowed through the tailings (particulate bound δ202Hg: -0.58‰; dissolved: -0.91‰) versus a background stream (particle-bound δ202Hg: -2.36‰; dissolved: -2.09‰). Within the reservoir sediment, the Hg isotopic composition indicated that the proportion of the Hg related to mine-release increased with THg concentrations. However, in the fish samples the opposite trend was observed-the degree of mine-related Hg was lower in fish with the higher THg concentrations. While sediment concentrations clearly show the influence of the mine, the relationship in fish is more complicated due to differences in methylmercury (MeHg) formation and the foraging behavior of different fish species. The fish tissue δ13C and Δ199Hg values indicate that there is a higher influence of mine-sourced Hg in fish feeding in a more sediment-based food web and less so in planktonic and littoral-based food webs. Identifying the relative proportion of Hg from local contaminated site can help inform remediation decisions, especially when the relationship between total Hg concentrations and sources do not show similar covariation between abiotic and biotic media.
Keywords: abandoned mines; contaminated sites; mercury; reservoirs; stable isotopes.
Conflict of interest statement
Conflict of interest The authors declare that the research was conducted in the absence of any commercial or financial relationships that could be construed as a potential conflict of interest.
Figures
Similar articles
-
Mercury isotope compositions in seawater and marine fish revealed the sources and processes of mercury in the food web within differing marine compartments.Water Res. 2023 Aug 1;241:120150. doi: 10.1016/j.watres.2023.120150. Epub 2023 May 30. Water Res. 2023. PMID: 37269625
-
Hg concentrations and stable isotope variations in tropical fish species of a gold-mining-impacted watershed in French Guiana.Environ Sci Pollut Res Int. 2021 Nov;28(43):60609-60621. doi: 10.1007/s11356-021-14858-7. Epub 2021 Jun 23. Environ Sci Pollut Res Int. 2021. PMID: 34159470
-
Isotopic Composition of Inorganic Mercury and Methylmercury Downstream of a Historical Gold Mining Region.Environ Sci Technol. 2016 Feb 16;50(4):1691-702. doi: 10.1021/acs.est.5b04413. Epub 2016 Feb 3. Environ Sci Technol. 2016. PMID: 26789018
-
Distribution, speciation, and transport of mercury in stream-sediment, stream-water, and fish collected near abandoned mercury mines in southwestern Alaska, USA.Sci Total Environ. 2000 Oct 9;260(1-3):21-33. doi: 10.1016/s0048-9697(00)00539-8. Sci Total Environ. 2000. PMID: 11032113
-
Methylmercury degradation and exposure pathways in streams and wetlands impacted by historical mining.Sci Total Environ. 2016 Oct 15;568:1192-1203. doi: 10.1016/j.scitotenv.2016.04.139. Epub 2016 May 24. Sci Total Environ. 2016. PMID: 27234290
Cited by
-
Mixed Model Approaches Can Leverage Database Information to Improve the Estimation of Size-Adjusted Contaminant Concentrations in Fish Populations.Environ Sci Technol. 2025 Mar 18;59(10):4797-4806. doi: 10.1021/acs.est.4c10303. Epub 2025 Mar 4. Environ Sci Technol. 2025. PMID: 40038908 Free PMC article.
-
Geographic Drivers of Mercury Entry into Aquatic Food Webs Revealed by Mercury Stable Isotopes in Dragonfly Larvae.Environ Sci Technol. 2024 Jul 16;58(30):13444-55. doi: 10.1021/acs.est.4c02436. Online ahead of print. Environ Sci Technol. 2024. PMID: 39012137 Free PMC article.
References
-
- Ambers RKR, and Hygelund BN (2001). Contamination of two Oregon reservoirs by cinnabar mining and mercury amalgamation. Environ. Geol 40, 699–707. doi:10.1007/s002540000173 - DOI
Grants and funding
LinkOut - more resources
Full Text Sources