

Predictive value of cell population data with Sysmex XN-series hematology analyzer for culture-proven bacteremia
- PMID: 37324133
- PMCID: PMC10267328
- DOI: 10.3389/fmed.2023.1156889
Predictive value of cell population data with Sysmex XN-series hematology analyzer for culture-proven bacteremia
Abstract
Background: Cell population data (CPD) parameters related to neutrophils, such as fluorescent light intensity (NE-SFL) and fluorescent light distribution width index (NE-WY), have emerged as potential biomarkers for sepsis. However, the diagnostic implication in acute bacterial infection remains unclear. This study assessed the diagnostic value of NE-WY and NE-SFL for bacteremia in patients with acute bacterial infections, and those associations with other sepsis biomarkers.
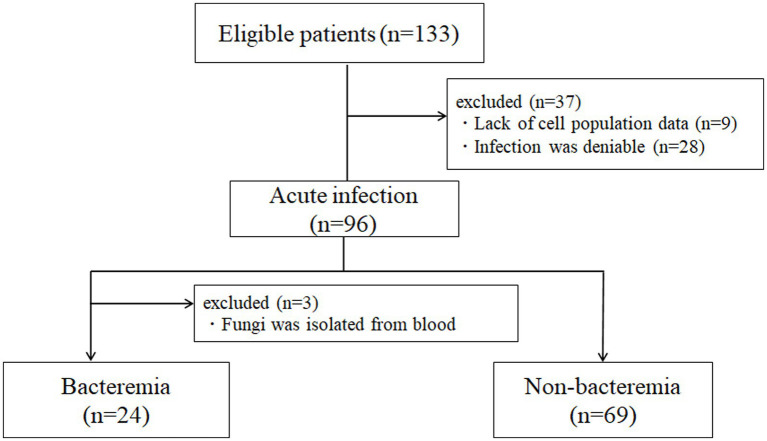
Methods: Patients with acute bacterial infections were enrolled in this prospective observational cohort study. For all patients, a blood sample, with at least two sets of blood cultures, were collected at the onset of infection. Microbiological evaluation included examination of the blood bacterial load using PCR. CPD was assessed using Automated Hematology analyzer Sysmex series XN-2000. Serum levels of procalcitonin (PCT), interleukin-6 (IL-6), presepsin, and CRP were also assessed.
Results: Of 93 patients with acute bacterial infection, 24 developed culture-proven bacteremia and 69 did not. NE-SFL and NE-WY were significantly higher in patients with bacteremia than in those without bacteremia (p < 0.005, respectively), and were significantly correlated with the bacterial load determined by PCR (r = 0.384 and r = 0.374, p < 0.005, respectively). To assess the diagnostic value for bacteremia, receiver operating characteristic curve analysis was used. NE-SFL and NE-WY showed an area under the curve of 0.685 and 0.708, respectively, while those of PCT, IL-6, presepsin, and CRP were 0.744, 0.778, 0.685, and 0.528, respectively. Correlation analysis showed that the levels of NE-WY and NE-SFL were strongly correlated with PCT and IL-6 levels.
Conclusion: This study demonstrated that NE-WY and NE-SFL could predict bacteremia in a manner that may be different from that of other indicators. These findings suggest there are potential benefits of NE-WY/NE-SFL in predicting severe bacterial infections.
Keywords: XN-series; bacteremia; cell population data; interleukin-6; presepsin; procalcitonin; sepsis.
Copyright © 2023 Miyajima, Niimi, Ueno, Matsui, Higashi, Kojima, Kono, Iwasaki, Nagaoka, Yamamoto and Kitajima.
Conflict of interest statement
NK and YI were employed by the company Sysmex Corporation. Author MK was employed by the company Subsidiary of Sysmex Corporation. The authors declare that this study received funding from Sysmex Corporation. The funder had the following involvement in the study: study design, analysis, interpretation of data. The remaining authors declare that the research was conducted in the absence of any commercial or financial relationships that could be construed as a potential conflict of interest.
Figures


References
LinkOut - more resources
Full Text Sources
Research Materials
Miscellaneous