. 2023 Apr 19;5(3):fcad130.
doi: 10.1093/braincomms/fcad130. eCollection 2023.

Spatial characterization of tangle-bearing neurons and ghost tangles in the human inferior temporal gyrus with three-dimensional imaging

Affiliations

Spatial characterization of tangle-bearing neurons and ghost tangles in the human inferior temporal gyrus with three-dimensional imaging

Theodore J Zwang et al. Brain Commun. .

Abstract

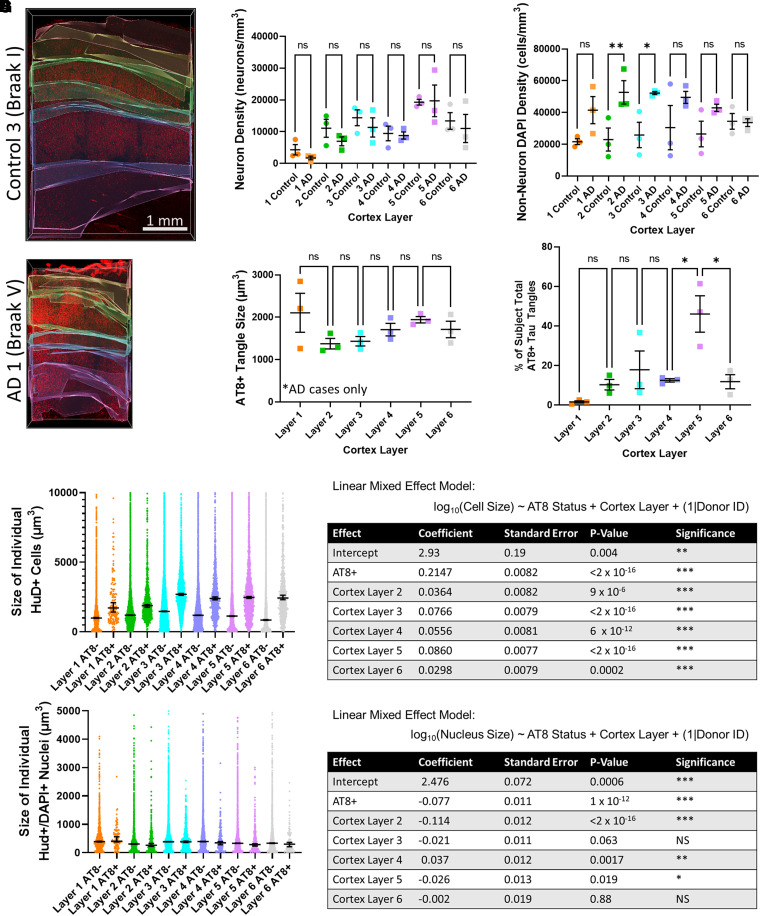
Studies of post-mortem human tissue provide insight into pathological processes, but are inherently limited by practical considerations that limit the scale at which tissue can be examined, and the obvious issue that the tissue reflects only one time point in a continuous disease process. We approached this problem by adapting new tissue clearance techniques to an entire cortical area of human brain, which allows surveillance of hundreds of thousands of neurons throughout the depth of the entire cortical thickness. This approach allows detection of 'rare' events that may be difficult to detect in standard 5 micrometre-thick paraffin sections. For example, it is well established that neurofibrillary tangles begin within a neuron, and ultimately, in at least some instances, persist in the brain even after the neuron has died. These are referred to as 'ghost tangles', a term that appropriately implies their 'difficult to see' ephemeral qualities. We set out to find ghost tangles as one example of the power of the tissue clearance/image analysis techniques to detect rare events, and to learn what happens at the end-point of a tangle's life history. We were able to identify 8103 tau tangles, 132 465 neurons and 299 640 nuclei in tissue samples from three subjects with severe Alzheimer's disease (Braak V-VI) and 4 tau tangles, 200 447 neurons and 462 715 nuclei in tissue samples from three subjects with no significant tau pathology (Braak 0-I). Among these data, we located 57 ghost tangles, which makes them only 0.7% of the total tau tangles observed. We found that ghost tangles are more likely to be found in cortical layers 3 and 5 (49/57), with a select few scattered across other layers 1, 2, 4 and 6. This ability to find rare events, such as ghost tangles, in large enough quantities to statistically test their distribution exemplifies how tissue clearing can be used as a powerful tool for studying selective vulnerability or resilience to pathology across brain regions.

Keywords: ghost tangles; inferior temporal gyrus; spatial mapping; tau; tissue clearing.


Conflict of interest statement

The authors declare no competing interests. Dr. Hyman has a family member who works for Novartis and has equity and serves on the Senior Advisory Boards of Dewpoint and Lattus.

Figures

Graphical Abstract
Graphical Abstract
Figure 1
Figure 1
Immunohistochemistry in cleared human inferior temporal gyrus. The antibodies HuD-A568 (red) and AT8-A647 (white) as well as DAPI (cyan) were used to label human inferior temporal gyrus tissue from six subjects with different degrees of tau pathology. Additional subject information can be found in Table 1. All tissue samples show clear HuD labelling of neurons and DAPI labelling of nuclei. AT8 staining is significantly more abundant in Alzheimer’s disease cases (Braak V–VI) than in control cases (Braak 0–I).
Figure 2
Figure 2
Semi-automatic identification of neurons and tangles. (A) Top-down view of HuD (red) and AT8 (grey), (B) or only AT8 staining through 500 μm. Region is from the same image volume shown in Fig. 1 with Braak stage V. (C) Object identities were exported by Ilastik providing information regarding characteristics used for classification, as well as a segmentation mask that was used to visualize and judge the success of registering HuD+ neurons (D) and AT8+ tangles. Visualization of segmentation masks were generated using Imaris and using a value of 1 μm to smooth the surfaces.
Figure 3
Figure 3
Comparison of classified cells across cortical layers. (A) Representative examples of segmentation masks that were used to define which part of each image corresponds to different cortex layers. Layers were determined looking at the distribution of neuron sizes (HuD, red) and are artificially coloured from top to bottom: layer 1 = orange, layer 2 = green, layer 3 = cyan, layer 4 = blue, layer 5 = magenta and layer 6 = white. (B) Neuron density was calculated by counting individual neurons then dividing by volume to determine the number of neurons present in a 1 mm block of tissue from cortical surface down to white matter. One-way ANOVA showed a statistically significant difference (P = 0.0023), however, pairwise t-test comparisons between Alzheimer’s disease tissue and control tissue showed no statistically significant difference (P > 0.05) likely due to the small sample size and large variability between samples. Each data point represents value from a single individual. N = 3 independent samples each for Alzheimer’s disease and control tissue. (C) Density of non-neuron DAPI+ cells was calculated similarly and found a statistically significant difference with one-way ANOVA (P = 0.018). Statistically significant differences were found in densities between Alzheimer’s disease and control tissue in layers 2 (P = 0.005) and 3 (P = 0.011) and insignificant differences for layers 1 (P = 0.05), 4 (P = 0.0589), 5 (P = 0.1) and 6 (P = 0.93). Each data point represents value from a single individual. N = 3 independent samples each for Alzheimer’s disease and control tissue. (D) AT8+ tangle size was compared across layers for each of the three Braak V–VI tissue samples tested. There is no significant difference in the sizes of tangles across layers. (E) The per cent of each subject’s total tau burden was split across layers (ANOVA P = 0.0025). The largest accumulation of tangles is in cortex layer 5, followed by cortex layer 3. A small number of tangles were present in layers 2, 4 and 6, and very few tangles were present in cortex layer 1. Each data point represents value from a single individual. N = 3 independent samples each for Alzheimer’s disease and control tissue. (F) Comparison between the size of each individual neuron with a tau tangle or without a tau tangle, defined as HuD+/AT8+ and HuD+/AT8− cells, respectively. These data were fit to a linear mixed effect model and showed significant effect on HuD+ cell size from donor, AT8 status and cortex layer. Some cells had sizes larger than the y-axis cutoff displayed, which upon inspection were multiple neurons that had been merged into one and were therefore excluded. (G) Comparison between the size of each individual neuron nuclei with a tau tangle or without a tau tangle, defined as the total volume of a DAPI+ object that colocalizes with HuD+/AT8+ cells and total volume of a DAPI+ object that colocalizes with HuD+/AT8− cells, respectively. These data were fit to a linear mixed effect model and showed significant effect on DAPI+ nucleus size from donor, AT8 status and cortex layer. DAPI with sizes above 5000 were almost exclusively unsplit clusters of objects and were excluded. Additional statistics information including the number of individual neurons in each layer can be found in the supplemental information. In all plots, statistical significance was represented as: P > 0.05 (ns), P < 0.05 (*), P < 0.01 (**) and P < 0.001 (***).
Figure 4
Figure 4
Location of ghost tangles. (A) Image of inferior temporal gyrus (sample AD 1) from Fig. 1 with HuD (red) and isolated ghost tangles (white). Zoomed-in regions (blue arrow) from tissue in panel A show HuD (red), AT8 (white) and with yellow outlining ghost tangles. (B) Image of inferior temporal gyrus (samples AD 2 and AD 3) with HuD (red) and location of isolated ghost tangles (white).

References

    1. Serrano-Pozo A, Frosch MP, Masliah E, Hyman BT. Neuropathological alterations in Alzheimer disease. Cold Spring Harb Perspect Med. 2011;1(1):a006189. - PMC - PubMed
    1. Moloney CM, Lowe VJ, Murray ME. Visualization of neurofibrillary tangle maturity in Alzheimer’s disease: A clinicopathologic perspective for biomarker research. Alzheimers Dement. 2021; 17(9):1554–1574. - PMC - PubMed
    1. Ueda HR, Ertürk A, Chung K, et al. . Tissue clearing and its applications in neuroscience. Nat Rev Neurosci. 2020;21(2):61–79. - PMC - PubMed
    1. Rusch H, Brammerloh M, Stieler J, et al. . Finding the best clearing approach—Towards 3D wide-scale multimodal imaging of aged human brain tissue. Neuroimage. 2022;247:118832. - PubMed
    1. Gilvesy A, Husen E, Magloczky Z, et al. . Spatiotemporal characterization of cellular tau pathology in the human locus coeruleus—pericoerulear complex by three-dimensional imaging. Acta Neuropathol. 2022;144(4):651–676. - PMC - PubMed

LinkOut - more resources