

Calculating sample entropy from isometric torque signals: methodological considerations and recommendations
- PMID: 37324377
- PMCID: PMC10267410
- DOI: 10.3389/fphys.2023.1173702
Calculating sample entropy from isometric torque signals: methodological considerations and recommendations
Abstract
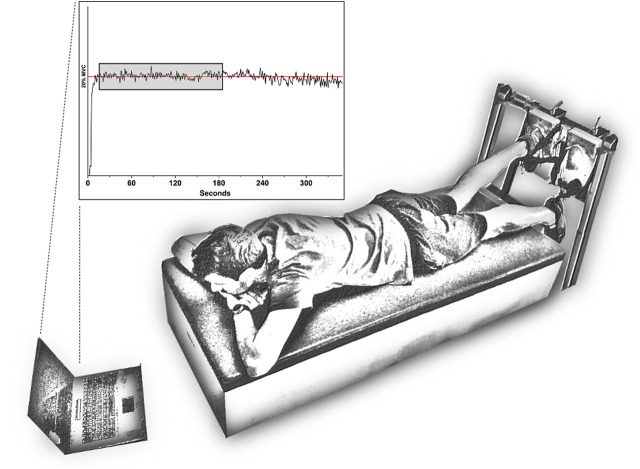
We investigated the effect of different sampling frequencies, input parameters and observation times for sample entropy (SaEn) calculated on torque data recorded from a submaximal isometric contraction. Forty-six participants performed sustained isometric knee flexion at 20% of their maximal contraction level and torque data was sampled at 1,000 Hz for 180 s. Power spectral analysis was used to determine the appropriate sampling frequency. The time series were downsampled to 750, 500, 250, 100, 50, and 25 Hz to investigate the effect of different sampling frequency. Relative parameter consistency was investigated using combinations of vector lengths of two and three and tolerance limits of 0.1, 0.15, 0.2, 0.25, 0.3, 0.35, and 0.4, and data lengths between 500 and 18,000 data points. The effect of different observations times was evaluated using Bland-Altman plot for observations times between 5 and 90 s. SaEn increased at sampling frequencies below 100 Hz and was unaltered above 250 Hz. In agreement with the power spectral analysis, this advocates for a sampling frequency between 100 and 250 Hz. Relative consistency was observed across the tested parameters and at least 30 s of observation time was required for a valid calculation of SaEn from torque data.
Keywords: motor control; muscle contraction; nonlinear analysis; regularity; time series.
Copyright © 2023 Raffalt, Yentes, Freitas and Vaz.
Conflict of interest statement
The authors declare that the research was conducted in the absence of any commercial or financial relationships that could be construed as a potential conflict of interest.
Figures


Similar articles
-
Sampling frequency influences sample entropy of kinematics during walking.Med Biol Eng Comput. 2019 Apr;57(4):759-764. doi: 10.1007/s11517-018-1920-2. Epub 2018 Nov 3. Med Biol Eng Comput. 2019. PMID: 30392162 Free PMC article. Clinical Trial.
-
Variability, frequency composition, and complexity of submaximal isometric knee extension force from subacute to chronic stroke.Neuroscience. 2014 Jul 25;273:189-98. doi: 10.1016/j.neuroscience.2014.05.018. Epub 2014 May 16. Neuroscience. 2014. PMID: 24840274
-
Variability, frequency composition, and temporal regularity of submaximal isometric elbow flexion force in subacute stroke.Exp Brain Res. 2016 Nov;234(11):3145-3155. doi: 10.1007/s00221-016-4712-7. Epub 2016 Jul 1. Exp Brain Res. 2016. PMID: 27370944
-
Approximate entropy based on attempted steady isometric contractions with the ankle dorsal- and plantarflexors: reliability and optimal sampling frequency.J Neurosci Methods. 2009 Feb 15;177(1):212-6. doi: 10.1016/j.jneumeth.2008.09.025. Epub 2008 Oct 8. J Neurosci Methods. 2009. PMID: 18955081
-
Effect of burst-modulated alternating current carrier frequency on current amplitude required to produce maximally tolerated electrically stimulated quadriceps femoris knee extension torque.Am J Phys Med Rehabil. 2009 Dec;88(12):973-8. doi: 10.1097/PHM.0b013e3181c1eda5. Am J Phys Med Rehabil. 2009. PMID: 19935181
Cited by
-
Force Fluctuations During Role-Differentiated Bimanual Movements Reflect Cognitive Impairments in Older Adults: A Cohort Sequential Study.J Gerontol A Biol Sci Med Sci. 2024 Oct 1;79(10):glae137. doi: 10.1093/gerona/glae137. J Gerontol A Biol Sci Med Sci. 2024. PMID: 38912976 Free PMC article.
-
Force fluctuations regulation and the role of neurophysiological mechanisms throughout different isometric contraction intensities.Sci Rep. 2025 Aug 4;15(1):28442. doi: 10.1038/s41598-025-14543-6. Sci Rep. 2025. PMID: 40760095 Free PMC article.
-
Changes in torque complexity with fatigue are related to motor unit behaviour.Sci Rep. 2025 Apr 15;15(1):12881. doi: 10.1038/s41598-025-96102-7. Sci Rep. 2025. PMID: 40234656 Free PMC article.
-
Comparison of Mean Values and Entropy in Accelerometry Time Series from Two Microtechnology Sensors Recorded at 100 vs. 1000 Hz During Cumulative Tackles in Young Elite Rugby League Players.Sensors (Basel). 2024 Dec 11;24(24):7910. doi: 10.3390/s24247910. Sensors (Basel). 2024. PMID: 39771647 Free PMC article.
References
LinkOut - more resources
Full Text Sources